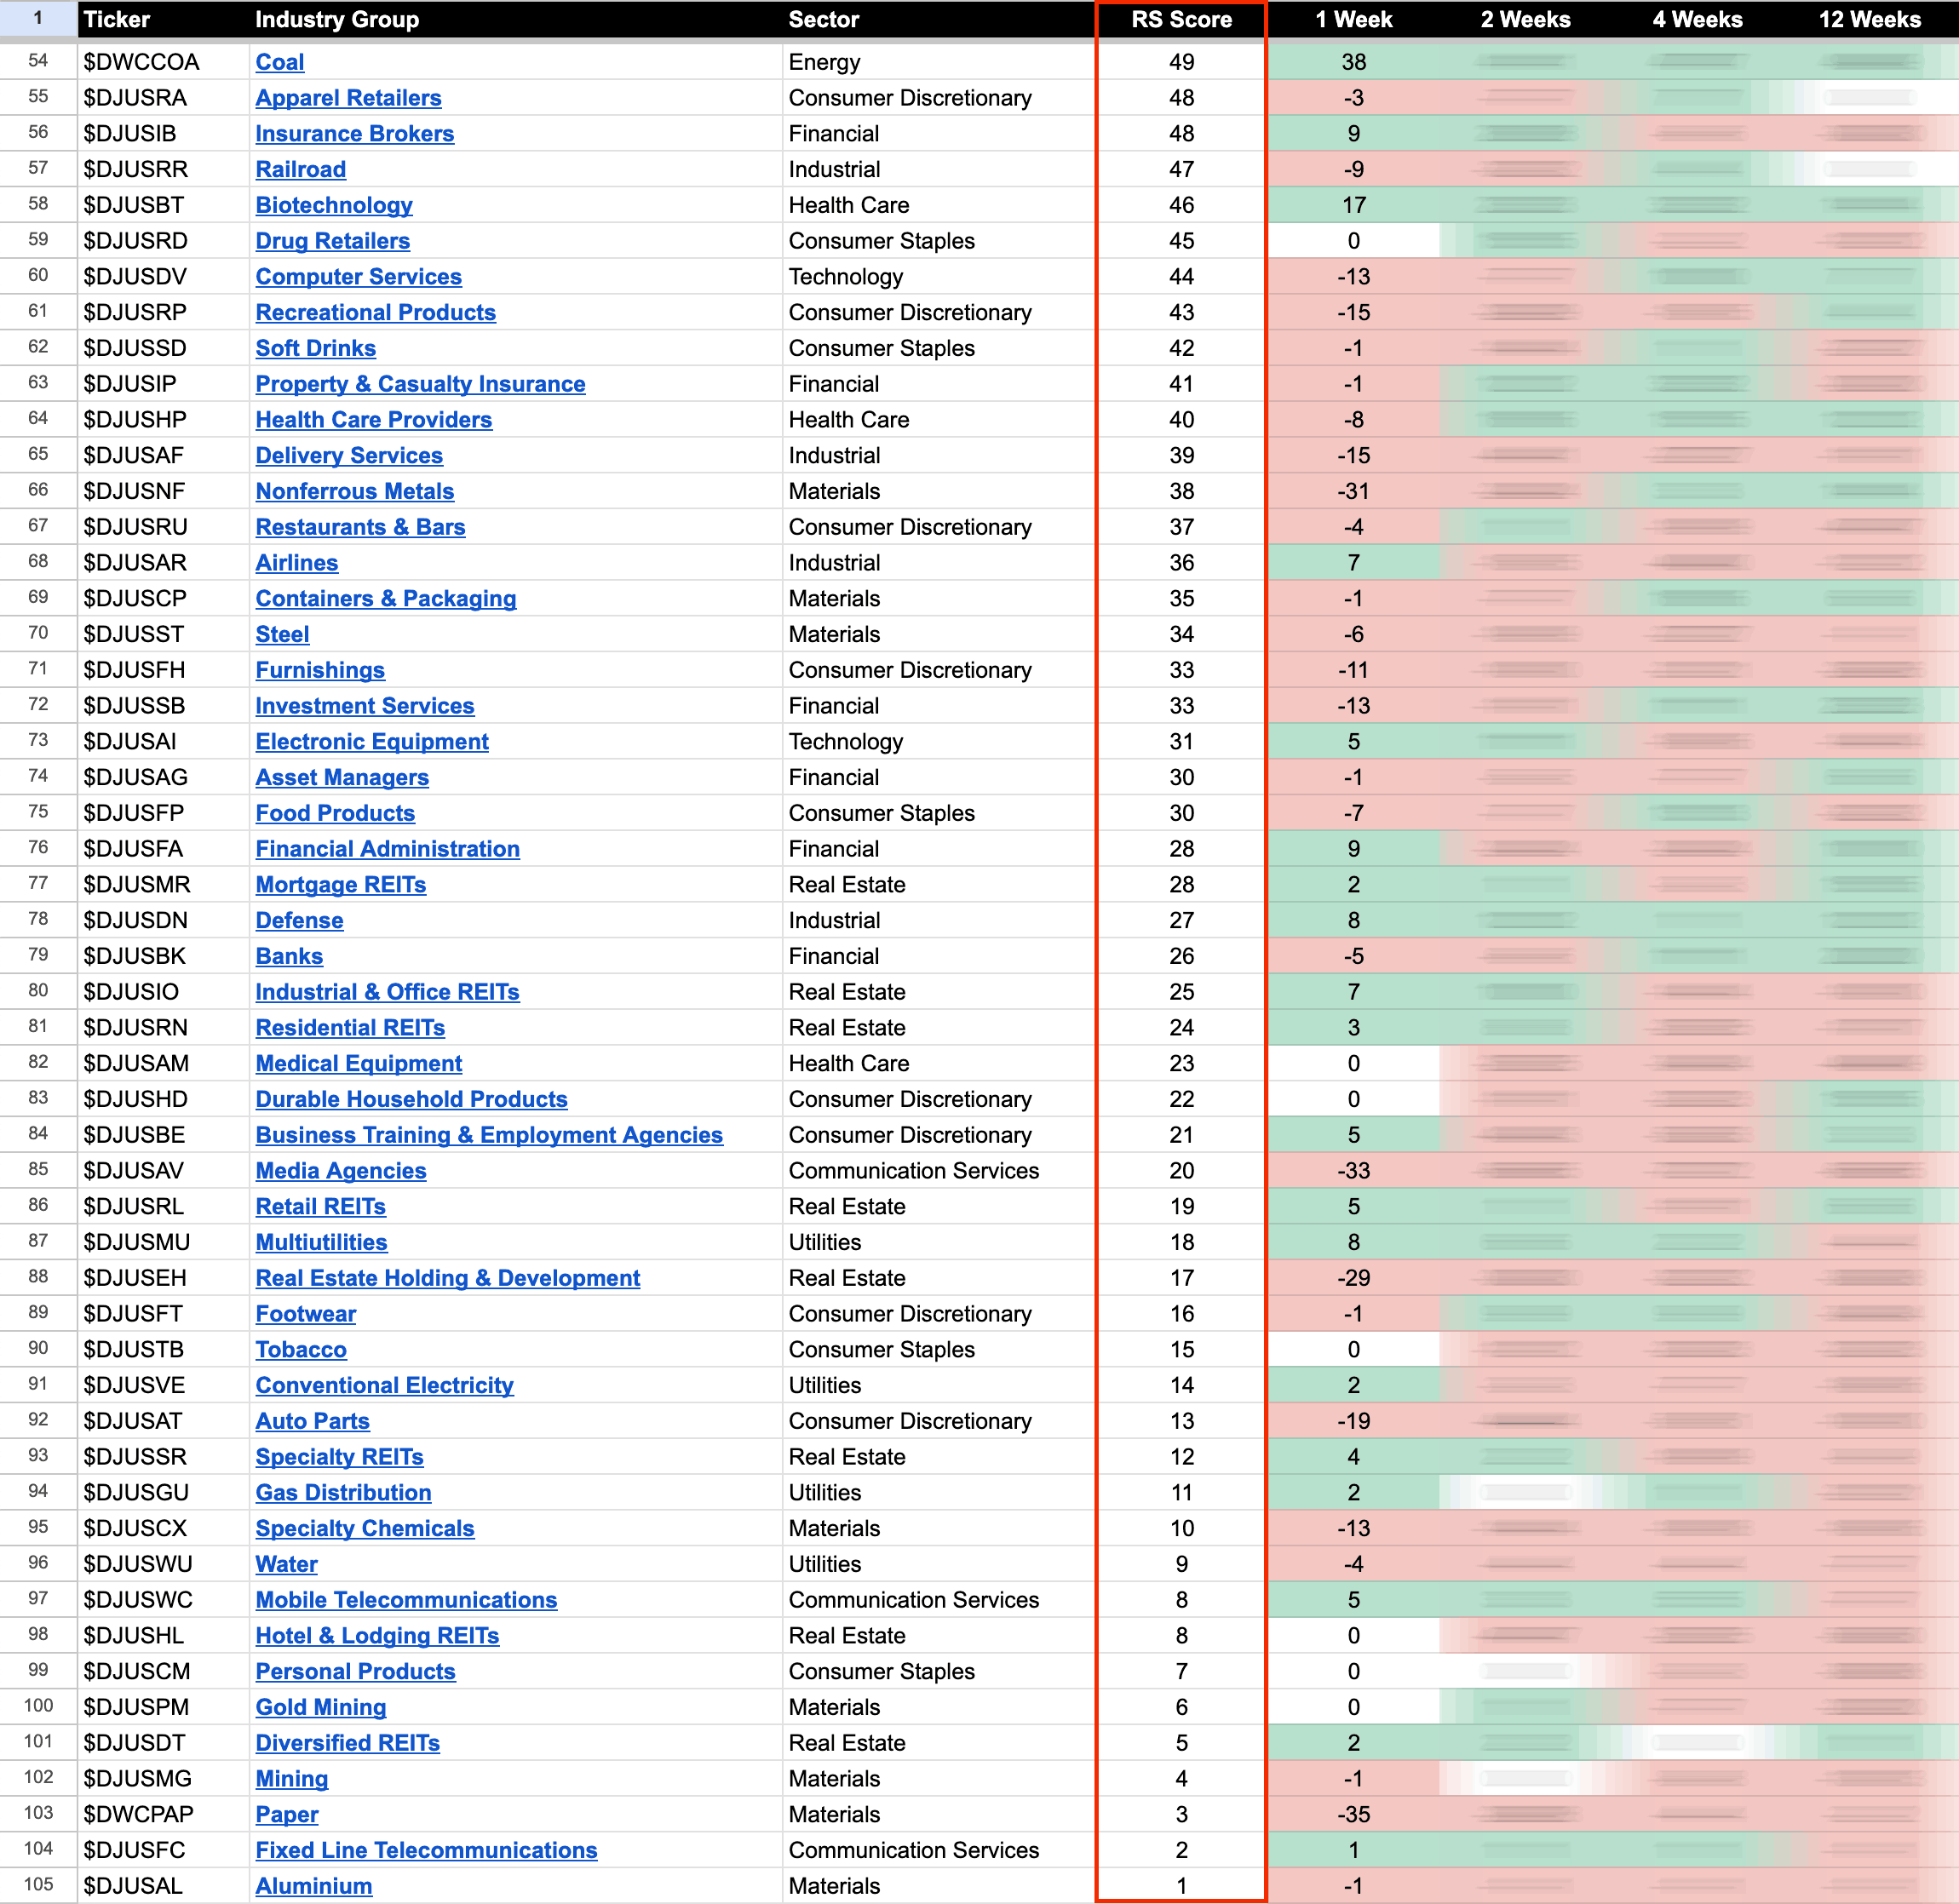
US Stocks Industry Groups Relative Strength Rankings
The full post is available to view by members only. For immediate access:
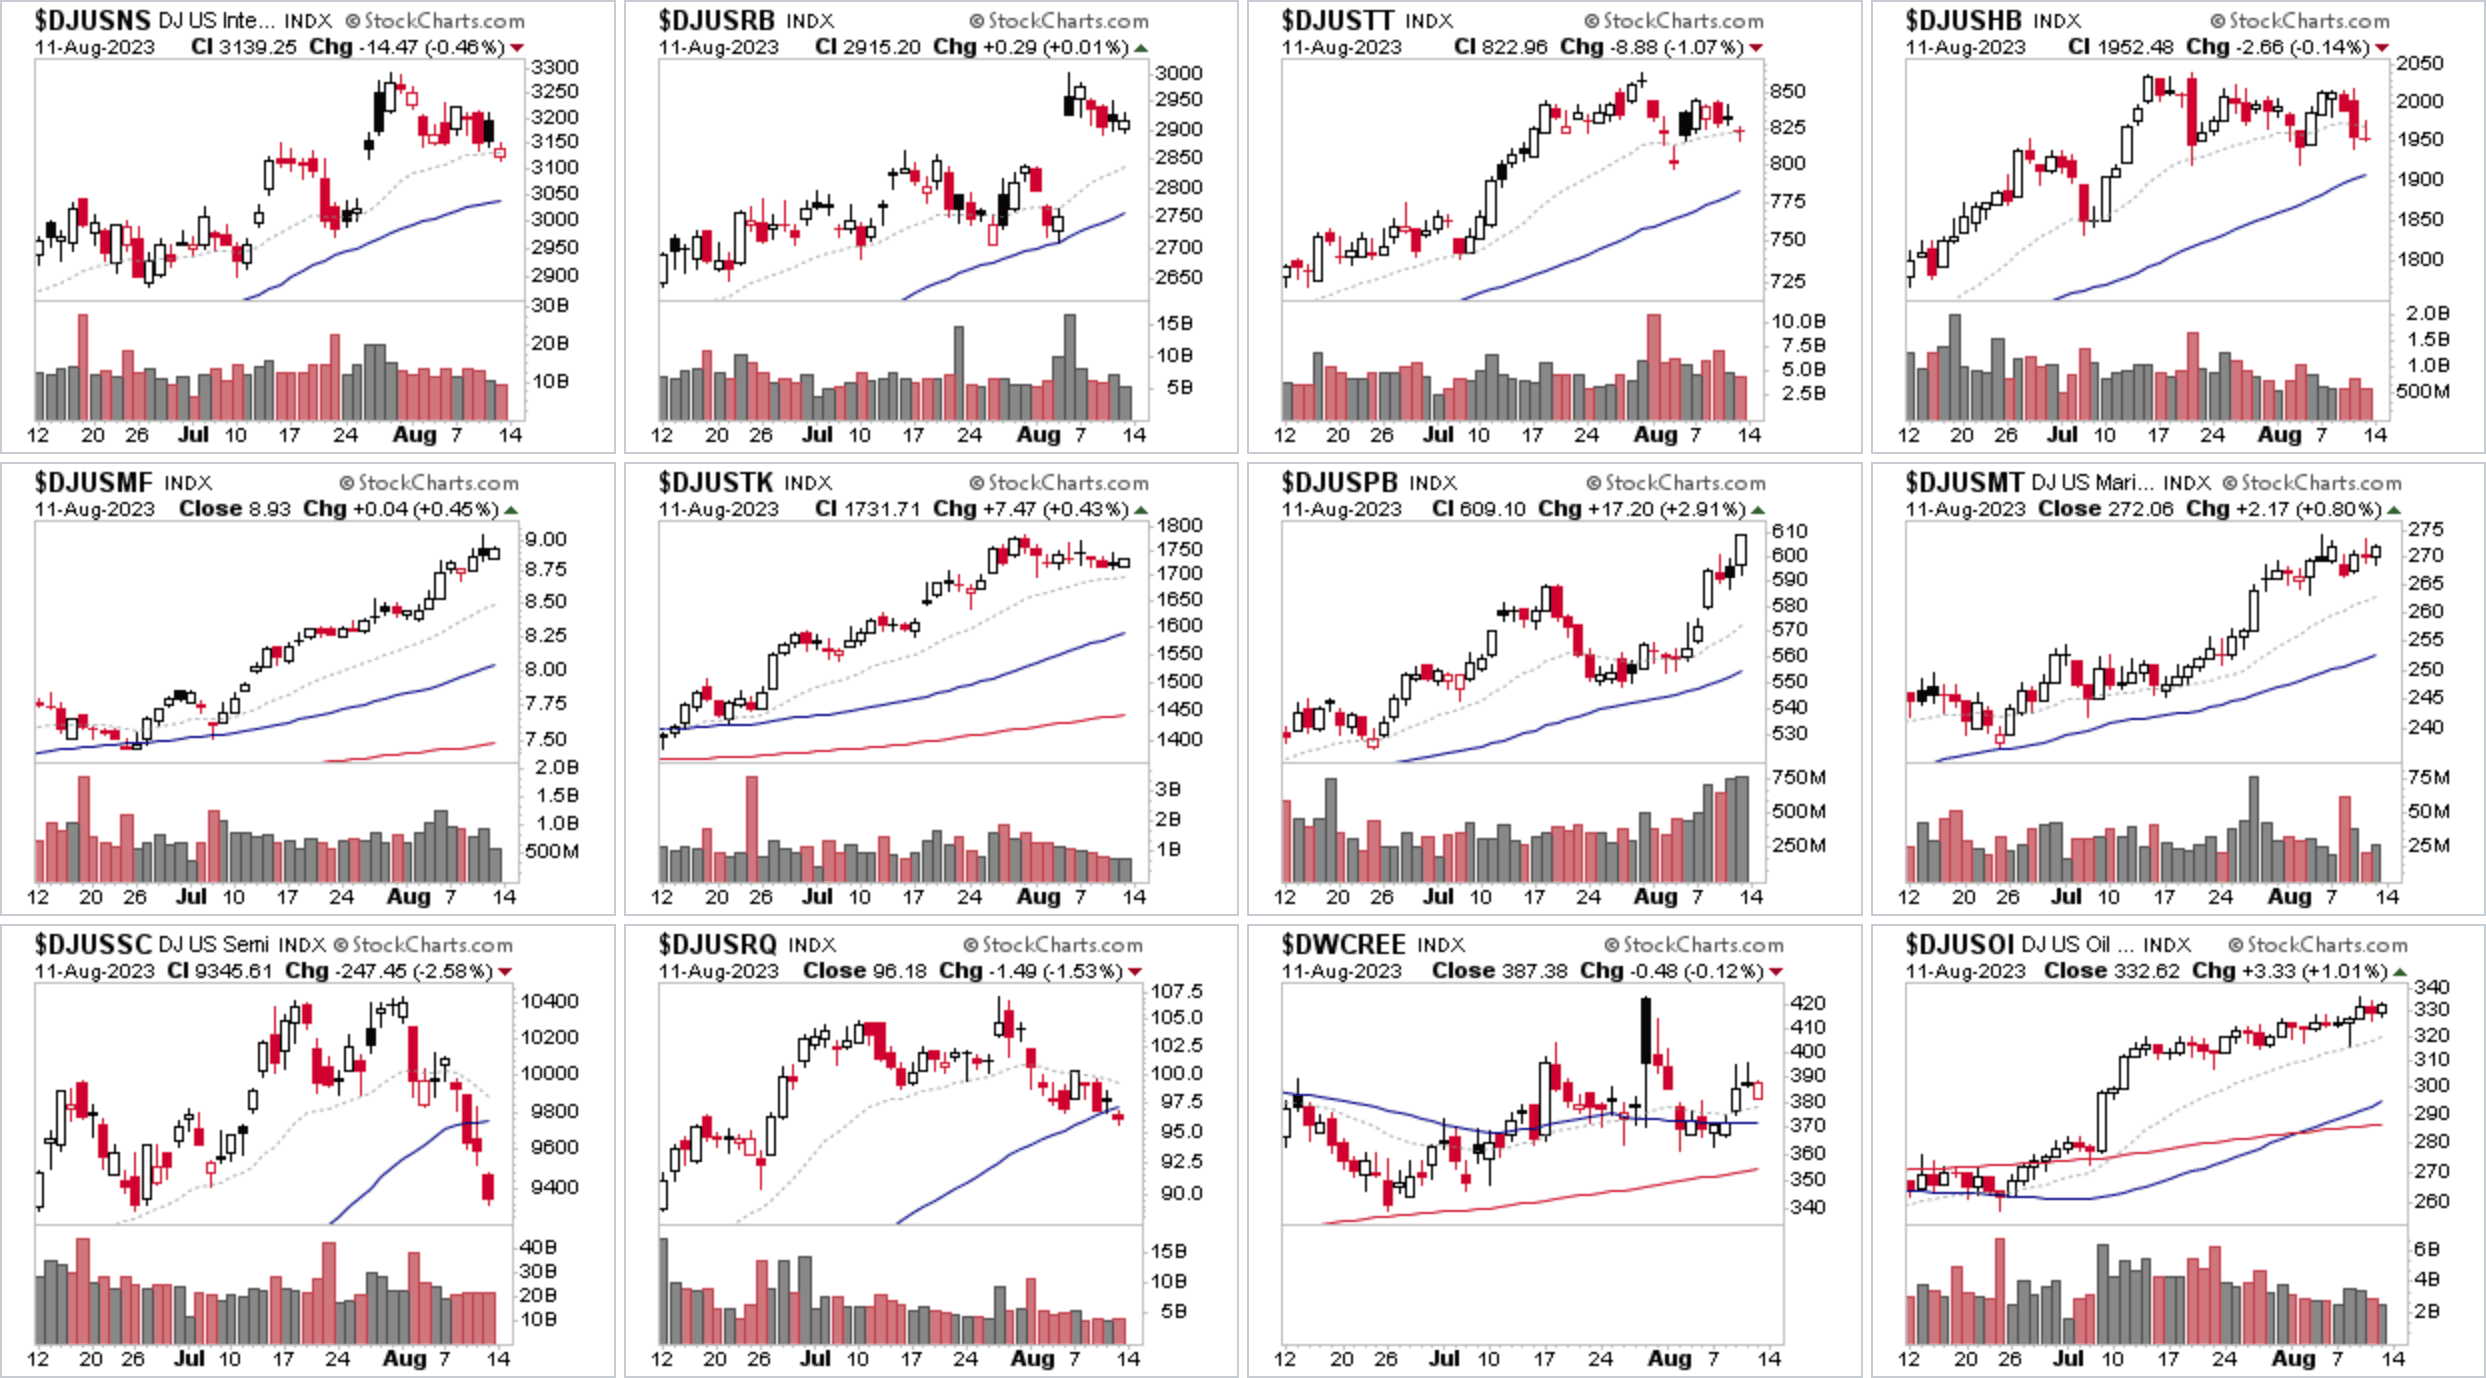
US Industry Groups by Highest RS Score
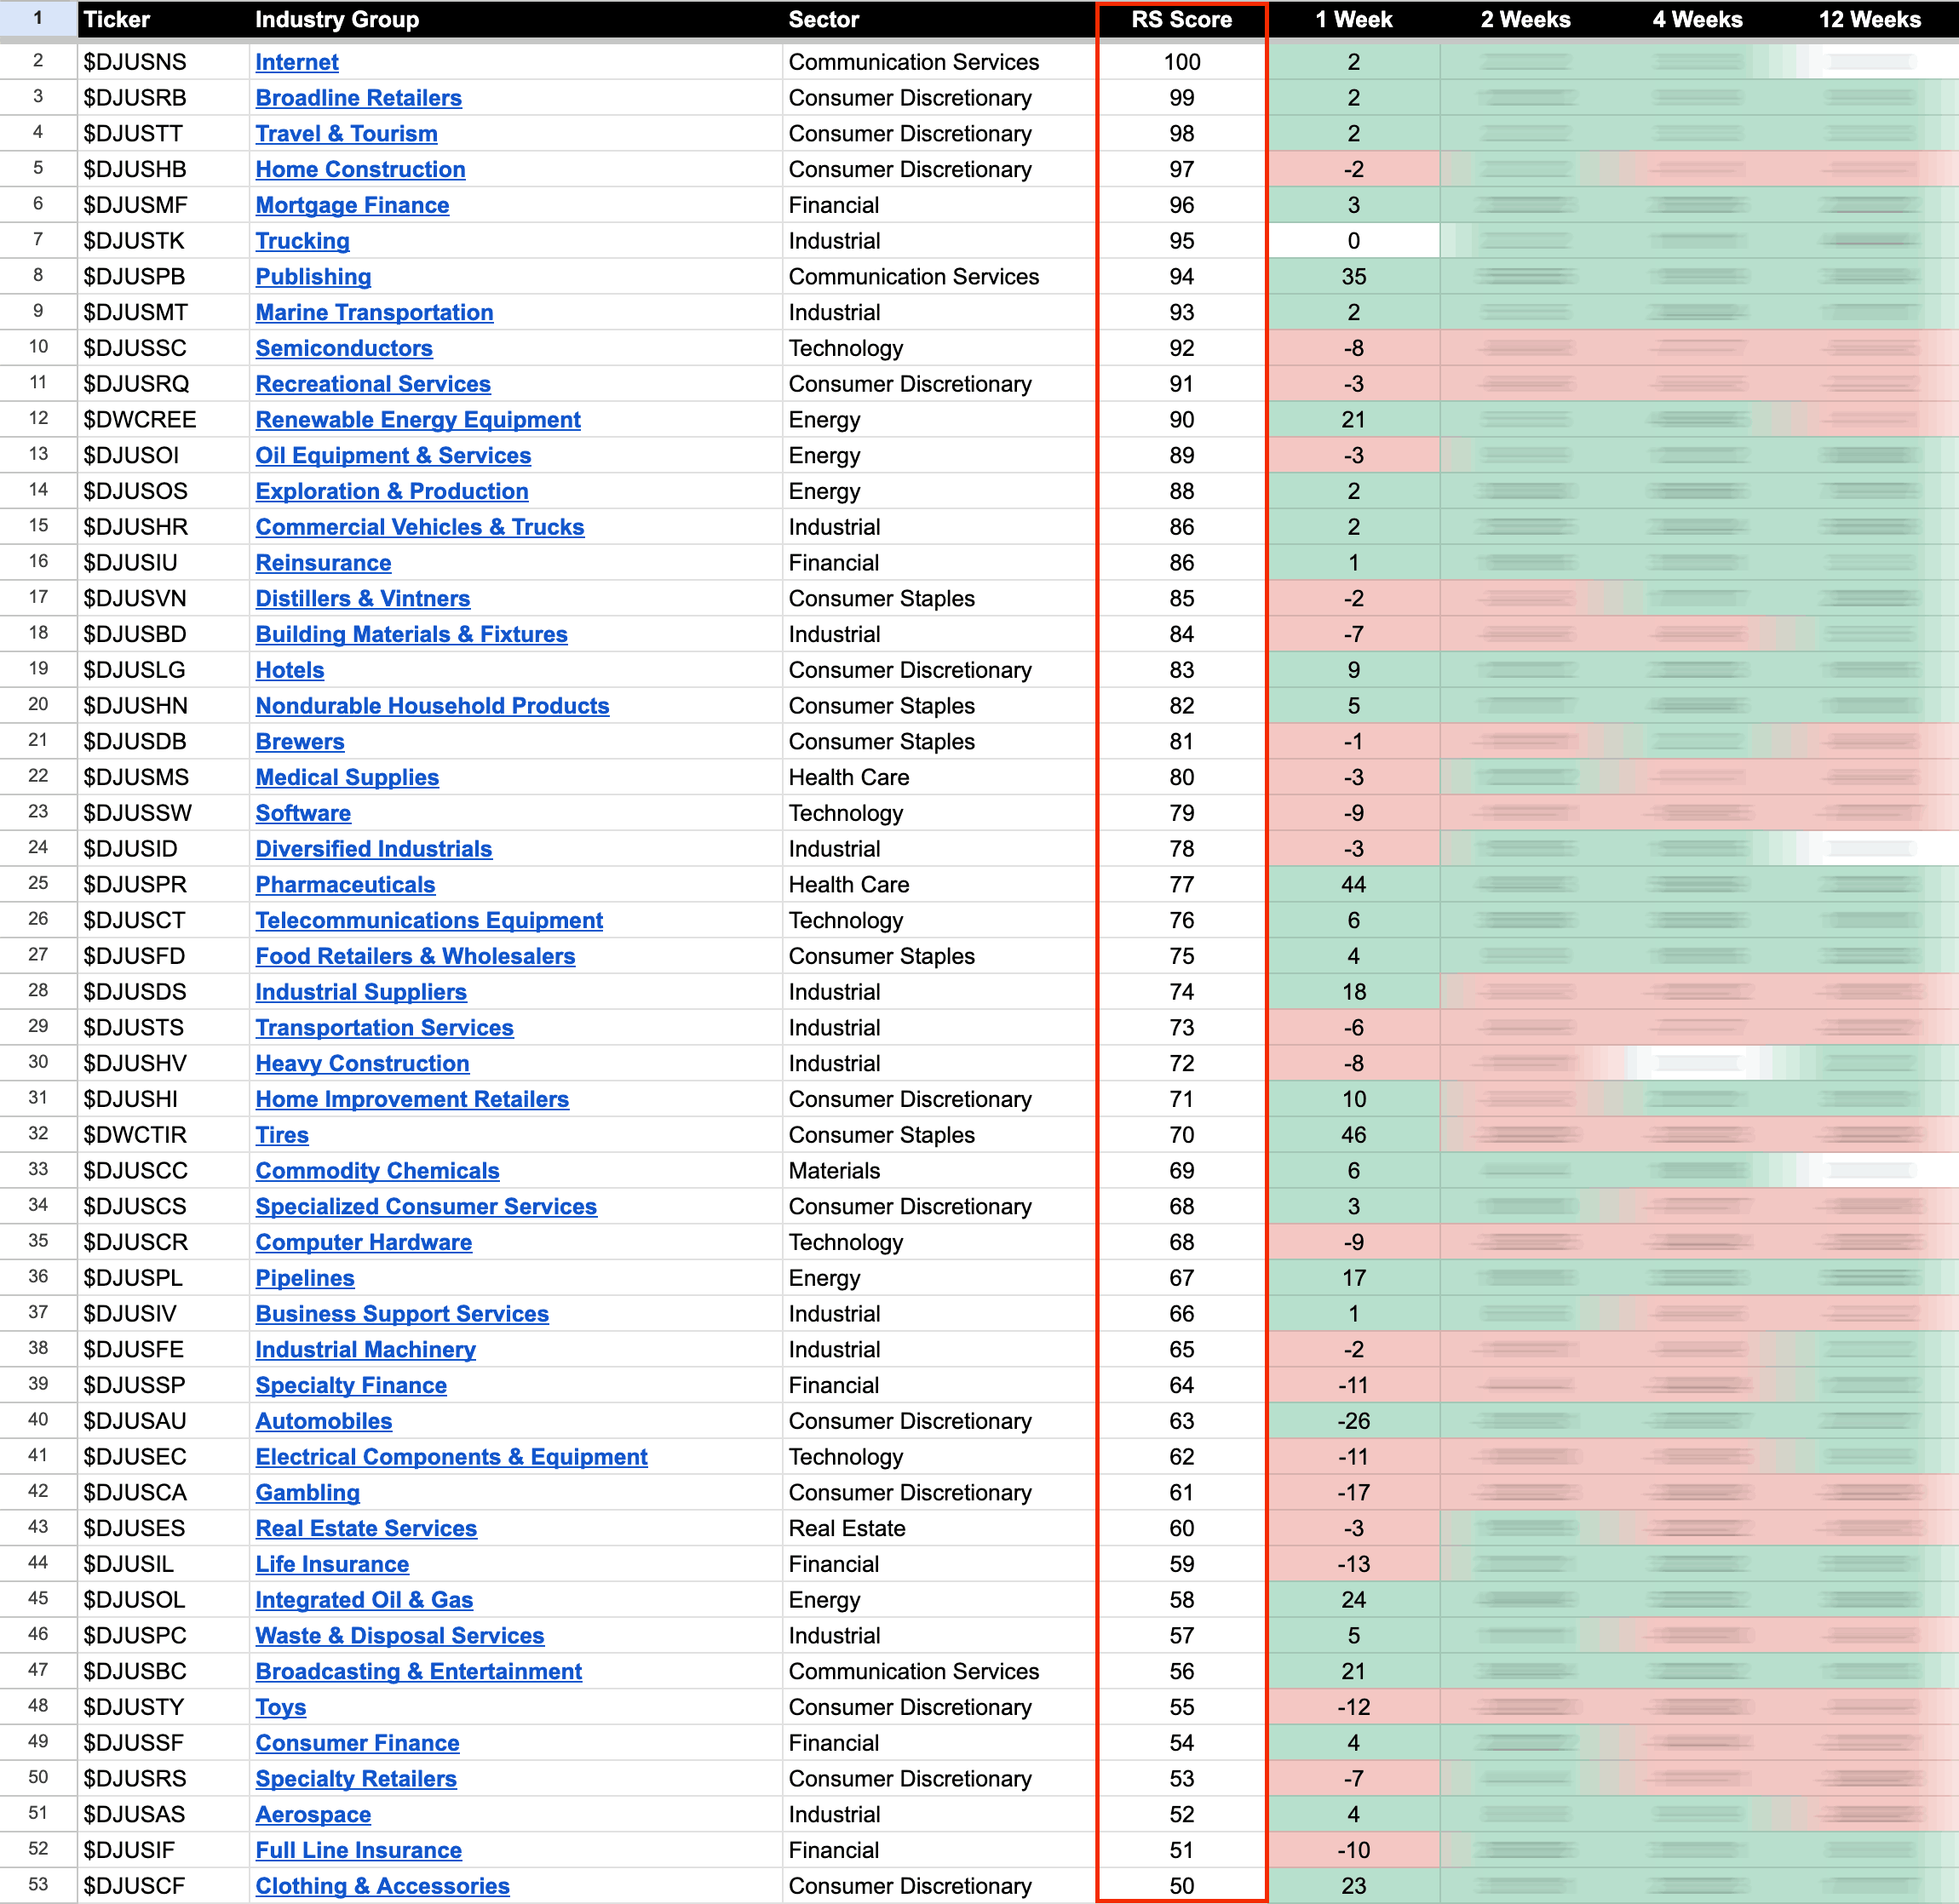
The Internet ($DJUSNS) group has moved to the top of the US Industry Groups Relative Strength Rankings this week, up from 3rd the prior week, as last weeks leader – Semiconductors ($DJUSSC) – dropped off -8 RS points to 9th position overall. Due to multiple stocks in the group having heavy declines this week, led by the continued pullback in NVDA, which has fallen below its 50 day MA for the first time since early January. However it's yet to report earnings, which are upcoming on the 08/23/2023 (AMC).
Energy groups continue to show improvement in the RS Rankings as Light Crude Oil Futures (CL) tested its Stage 2 breakout level this week, which boosted numerous energy stocks, including Coal ($DWCCOA), which three months ago was at the bottom of the RS rankings as it declined lower in Stage 4. But has now risen up +49 RS points since making a low in late May, with the group chart potentially moving into early Stage 1, with its first close above the still declining 30 week MA this week, and with a few stocks in the group even returning to Stage 2 and hitting new all time highs.
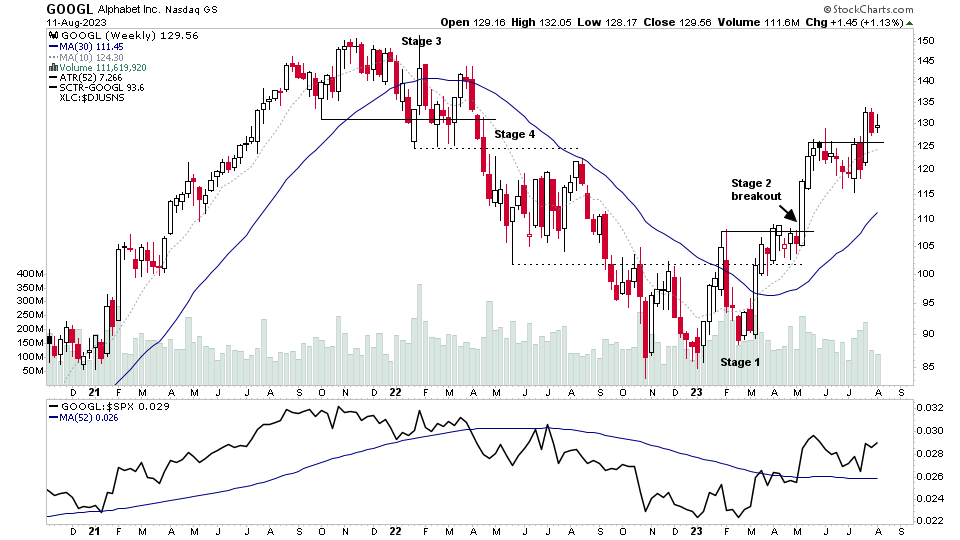
Returning to the leading Internet group, the mega cap Alphabet stocks – GOOG & GOOGL – continues to be a major driver of the group strength, with an inside week on contracting volume, above the recent Stage 2 continuation breakout level, and it is only -3.1% off of it's 52 week high, and hence is showing strong relative strength in comparison to the Nasdaq 100 for example so far in this correction.
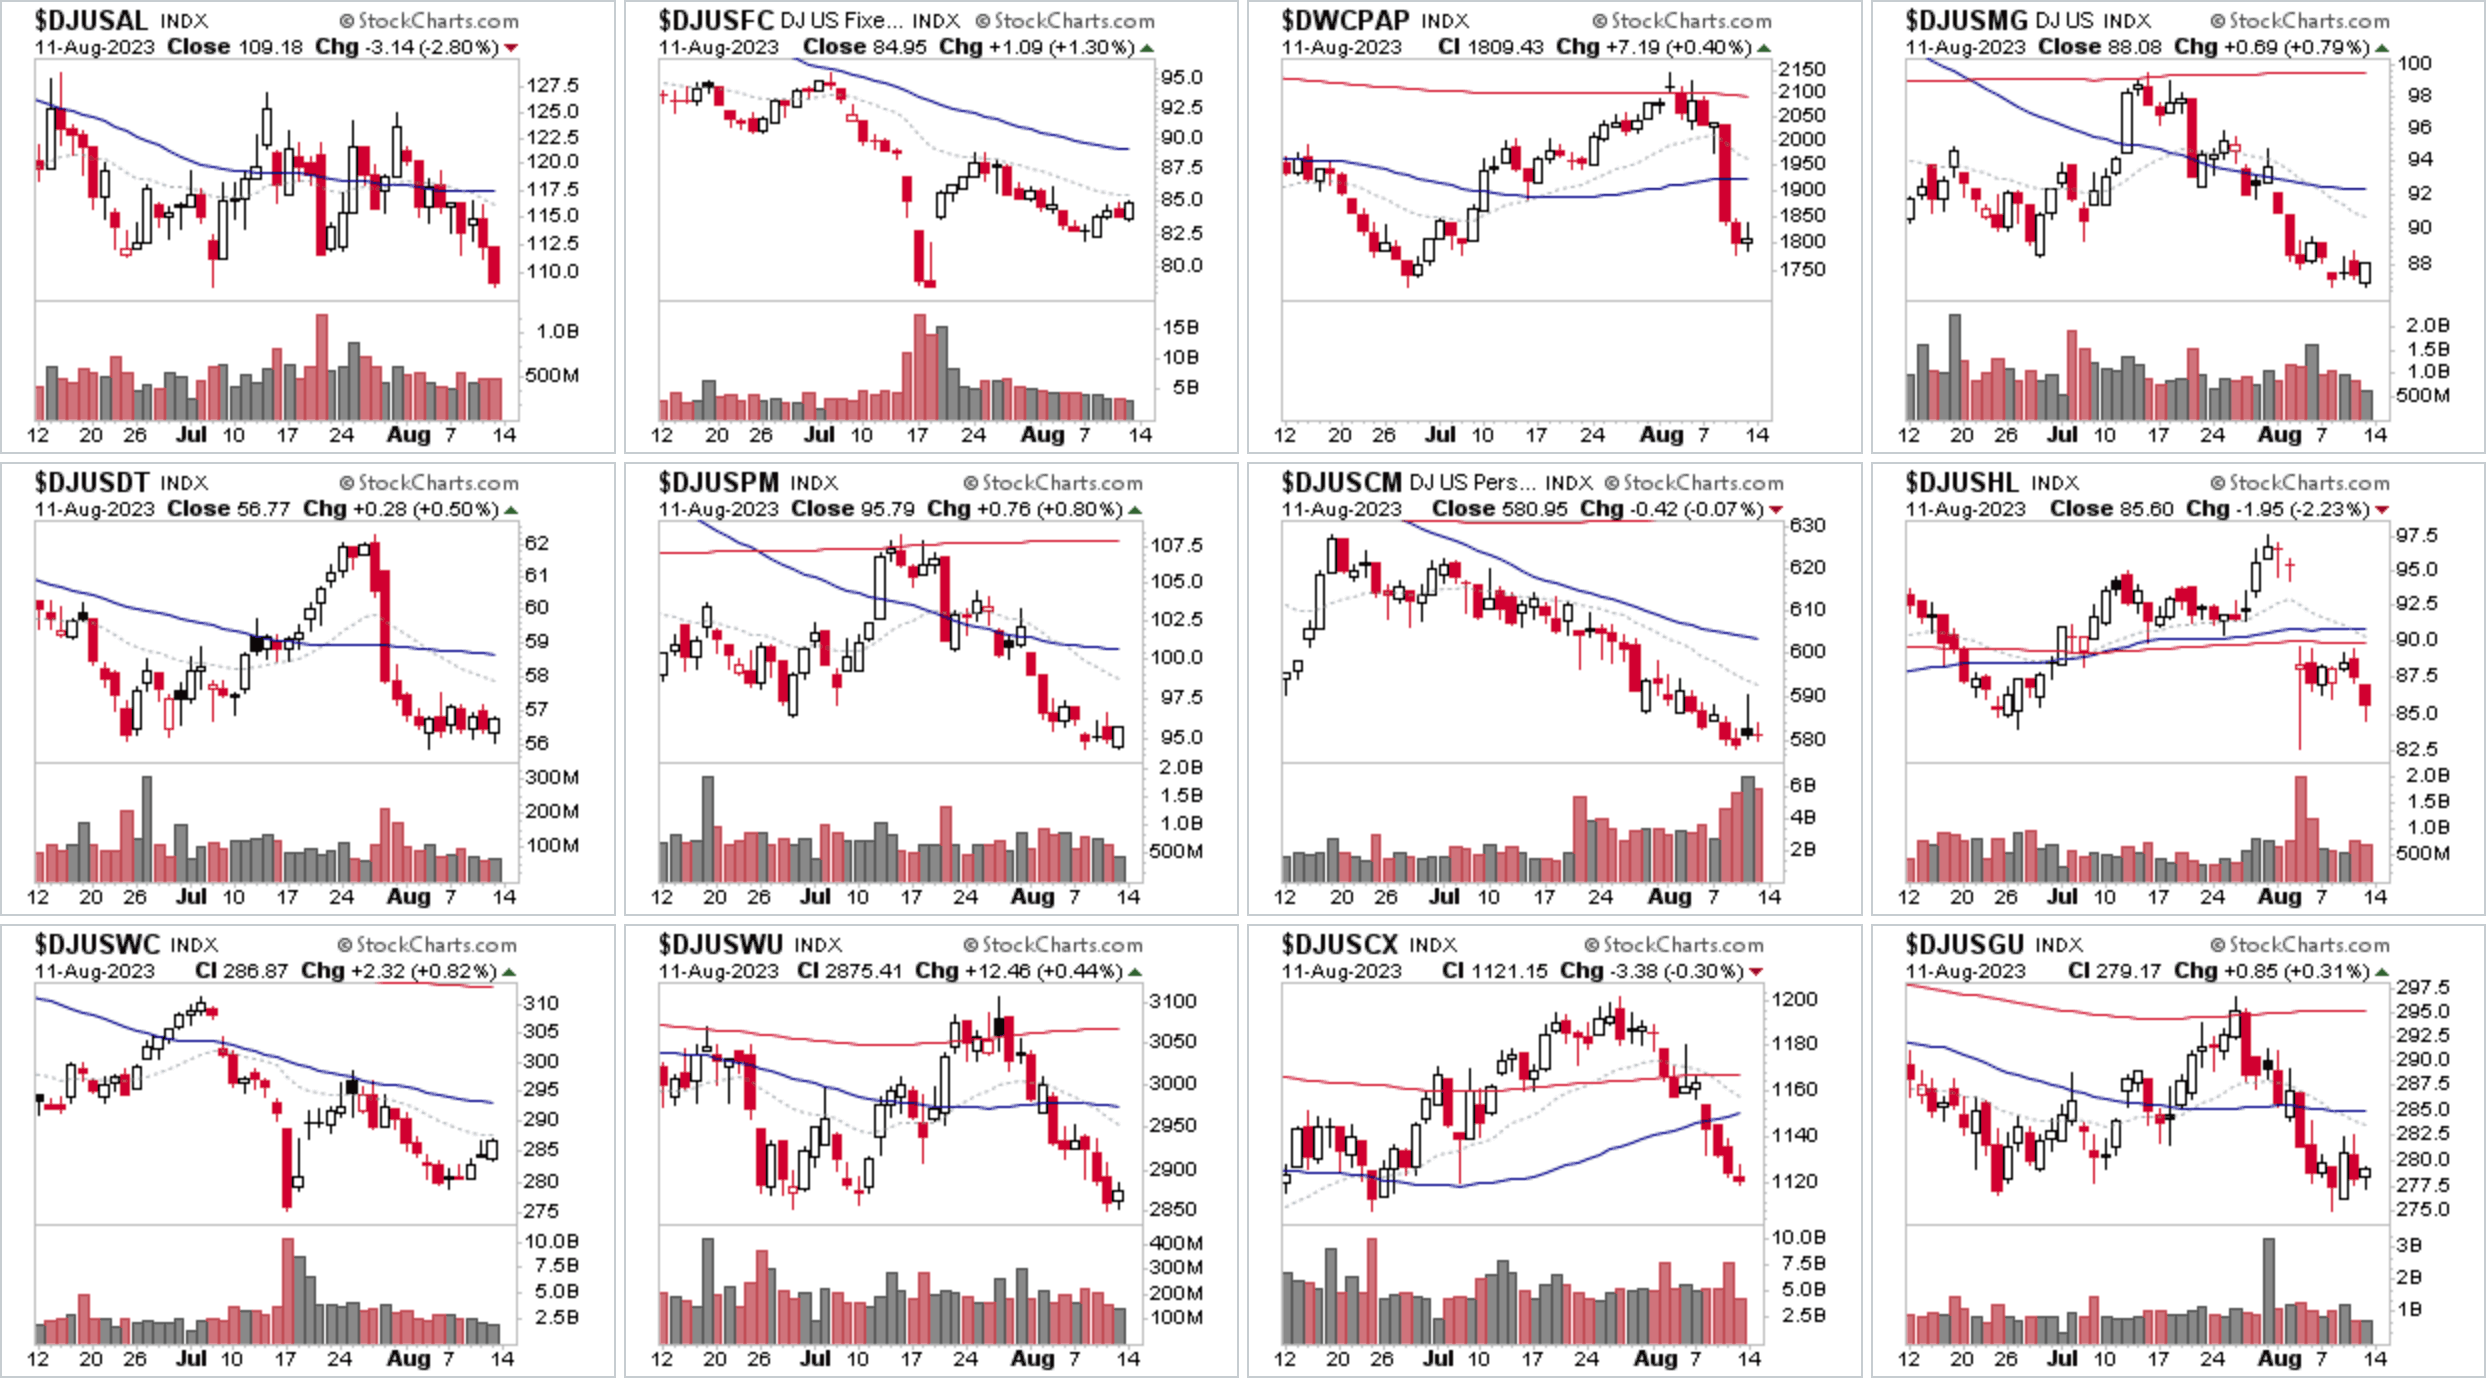
US Industry Groups by Weakest RS Score
Aluminium ($DJUSAL) returned to the bottom spot of the RS rankings, with Materials sector groups populating 4 of the bottom 10 in the RS rankings currently.
US Industry Groups sorted by Relative Strength
The purpose of the Relative Strength (RS) tables is to track the short, medium and long-term RS changes of the individual groups to find the new leadership earlier than the crowd.
RS Score of 100 is the strongest, and 0 is the weakest.
In the Stage Analysis method we are looking to focus on the strongest groups, as what is strong, tends to stay strong for a long time. But we also want to find the improving / up and coming groups that are starting to rise up strongly through the RS table from the lower zone, in order to find the future leading stocks before they break out from a Stage 1 base and move into a Stage 2 advancing phase.
Each week I go through the most interesting groups on the move in more detail during the Stage Analysis Members weekend video – as Industry Group analysis is a key part of Stan Weinstein's Stage Analysis method.
Become a Stage Analysis Member:
To see more like this and other premium content, such as the regular US Stocks watchlist, detailed videos and intraday posts, become a Stage Analysis member.
Join Today
Disclaimer: For educational purpose only. Not investment advice. Seek professional advice from a financial advisor before making any investing decisions.

