The Stage Analysis members weekend video begins with discussion of the the US Watchlist Stocks in detail on multiple timeframes, Stages Summary, Relative Strength Rankings, the Sector breadth and Sub-industries Bell Curves, the key Market Breadth Charts to determine the Weight of Evidence, Bitcoin & Ethereum and the Major US Stock Market Indexes Update.
Read More

Blog
13 April, 2025
Stage Analysis Members Video – 13 April 2025 (1hr 5mins)
12 April, 2025
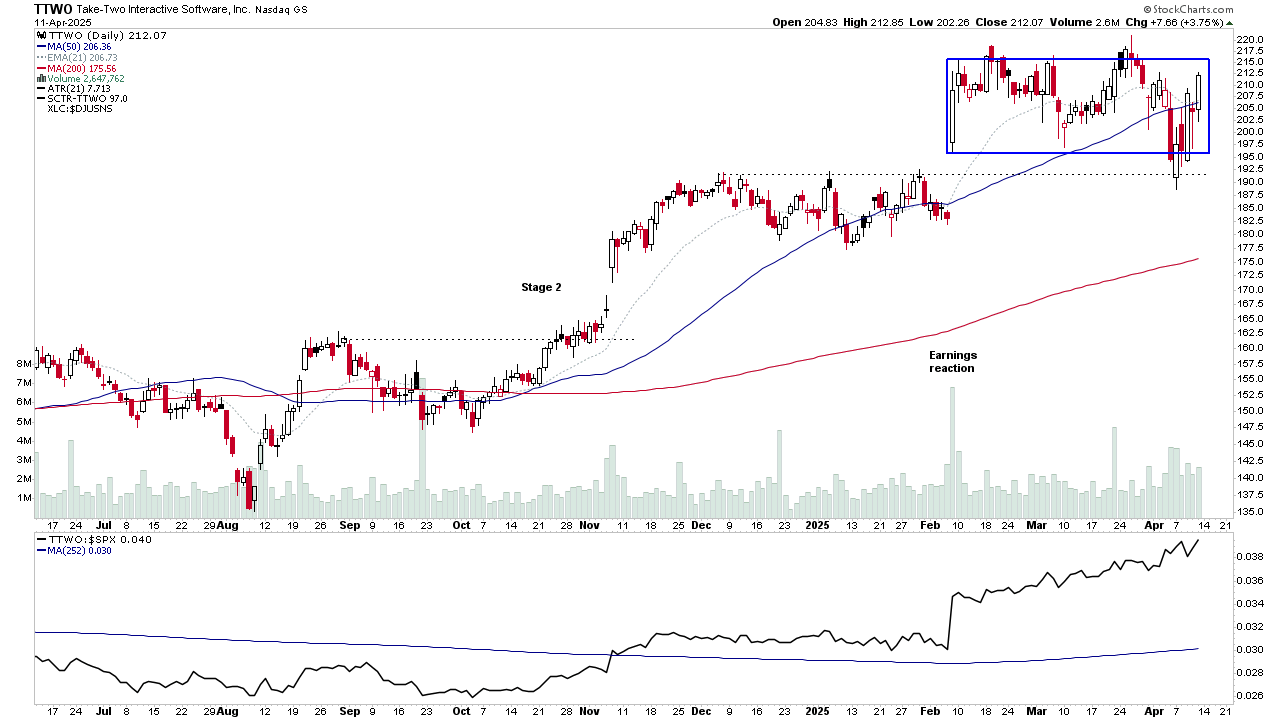
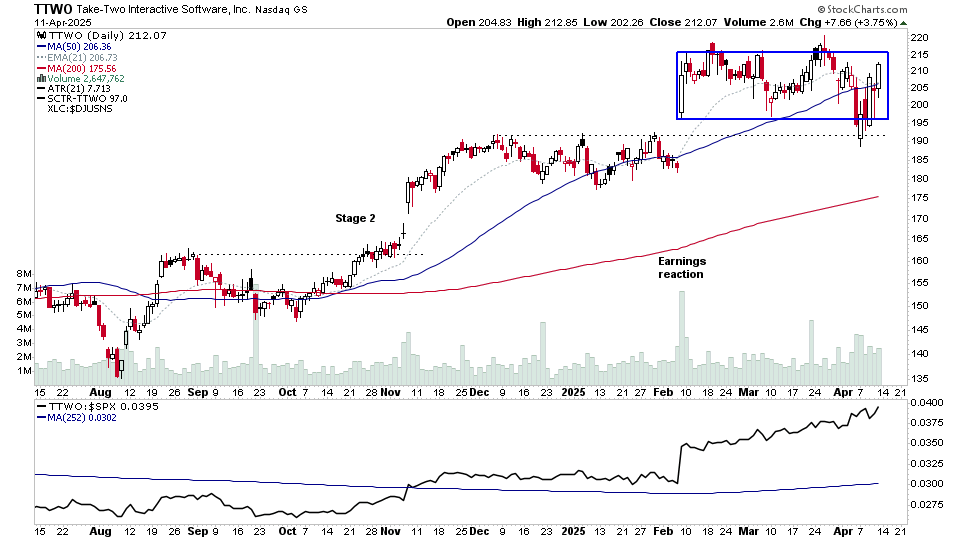
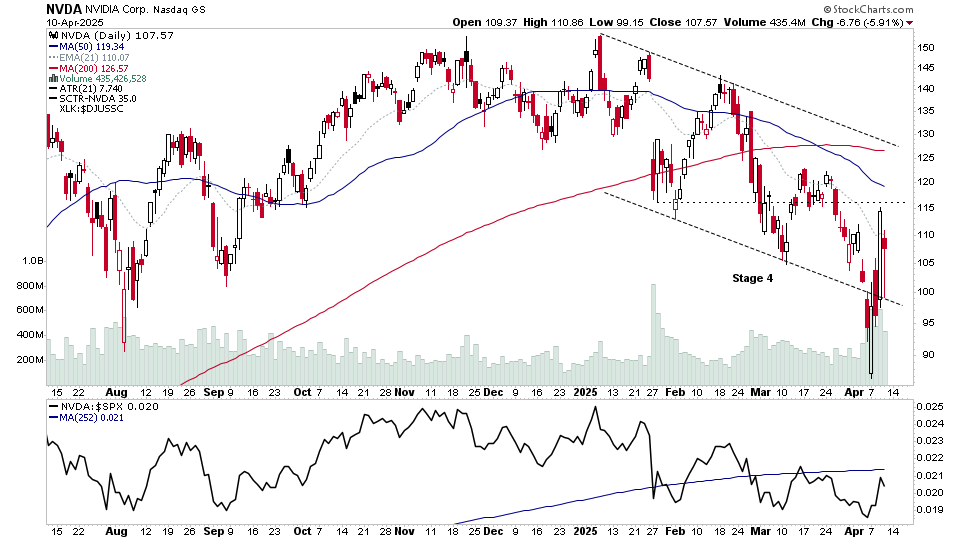
US Stocks Watchlist – 12 April 2025
There were 19 stocks highlighted from the US stocks watchlist scans today...
Read More
11 April, 2025
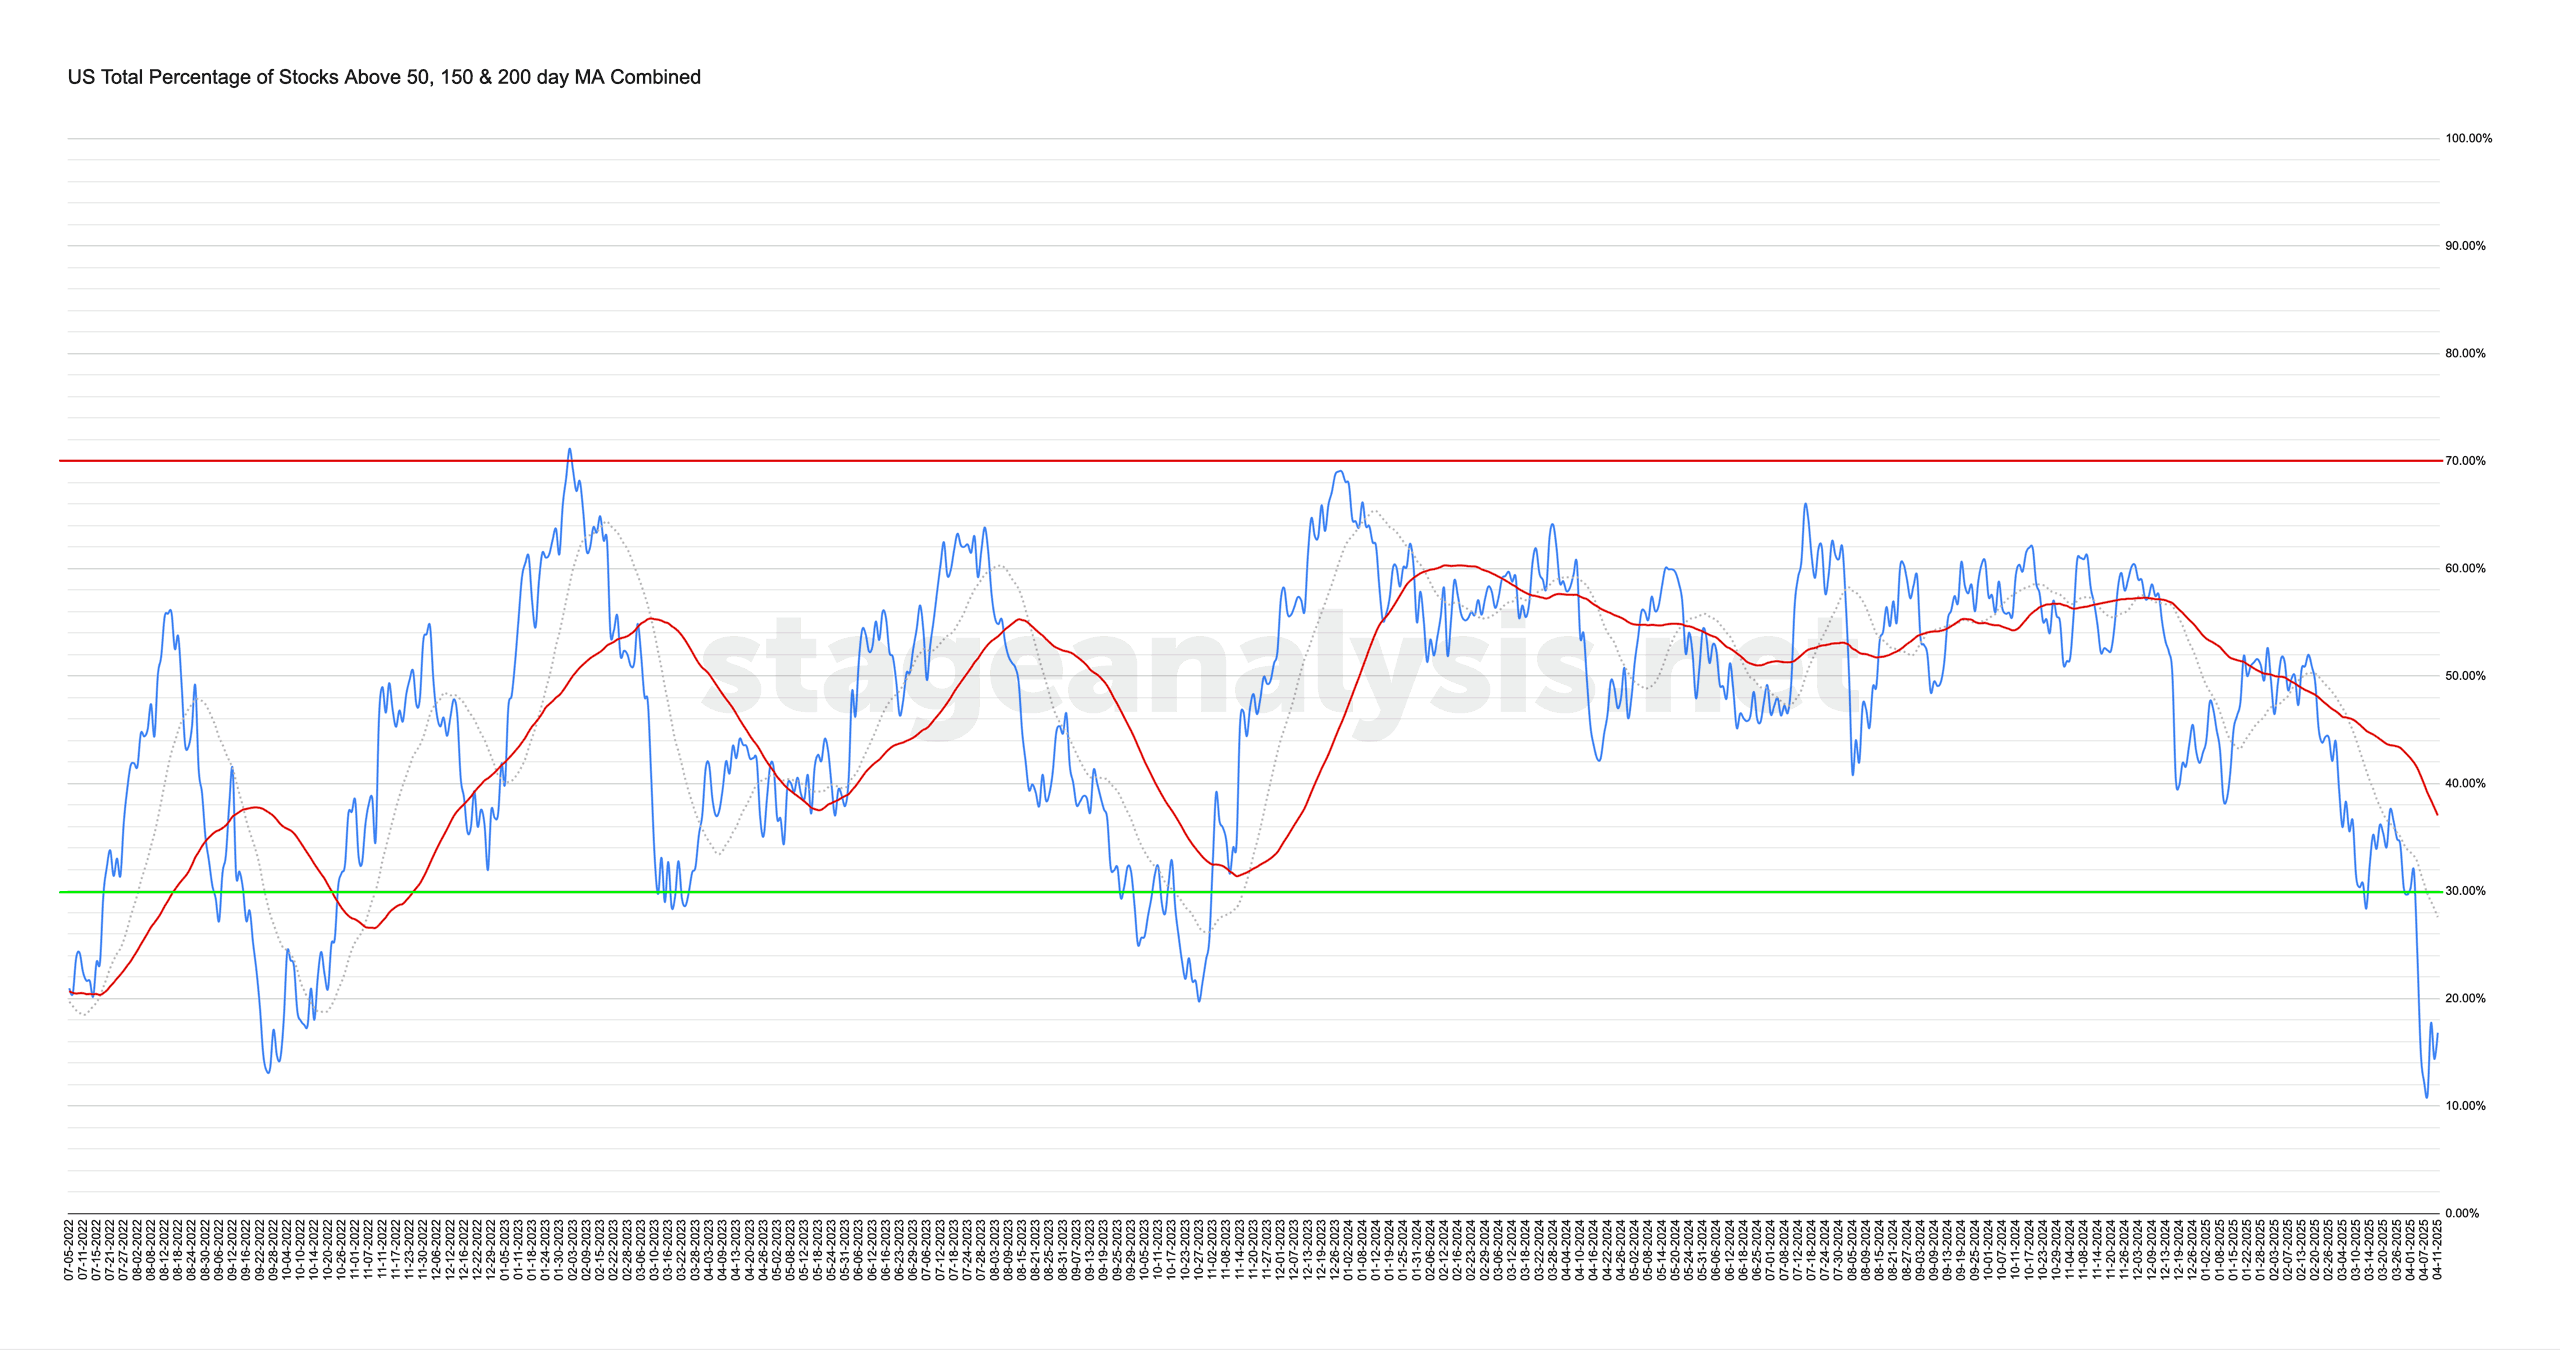
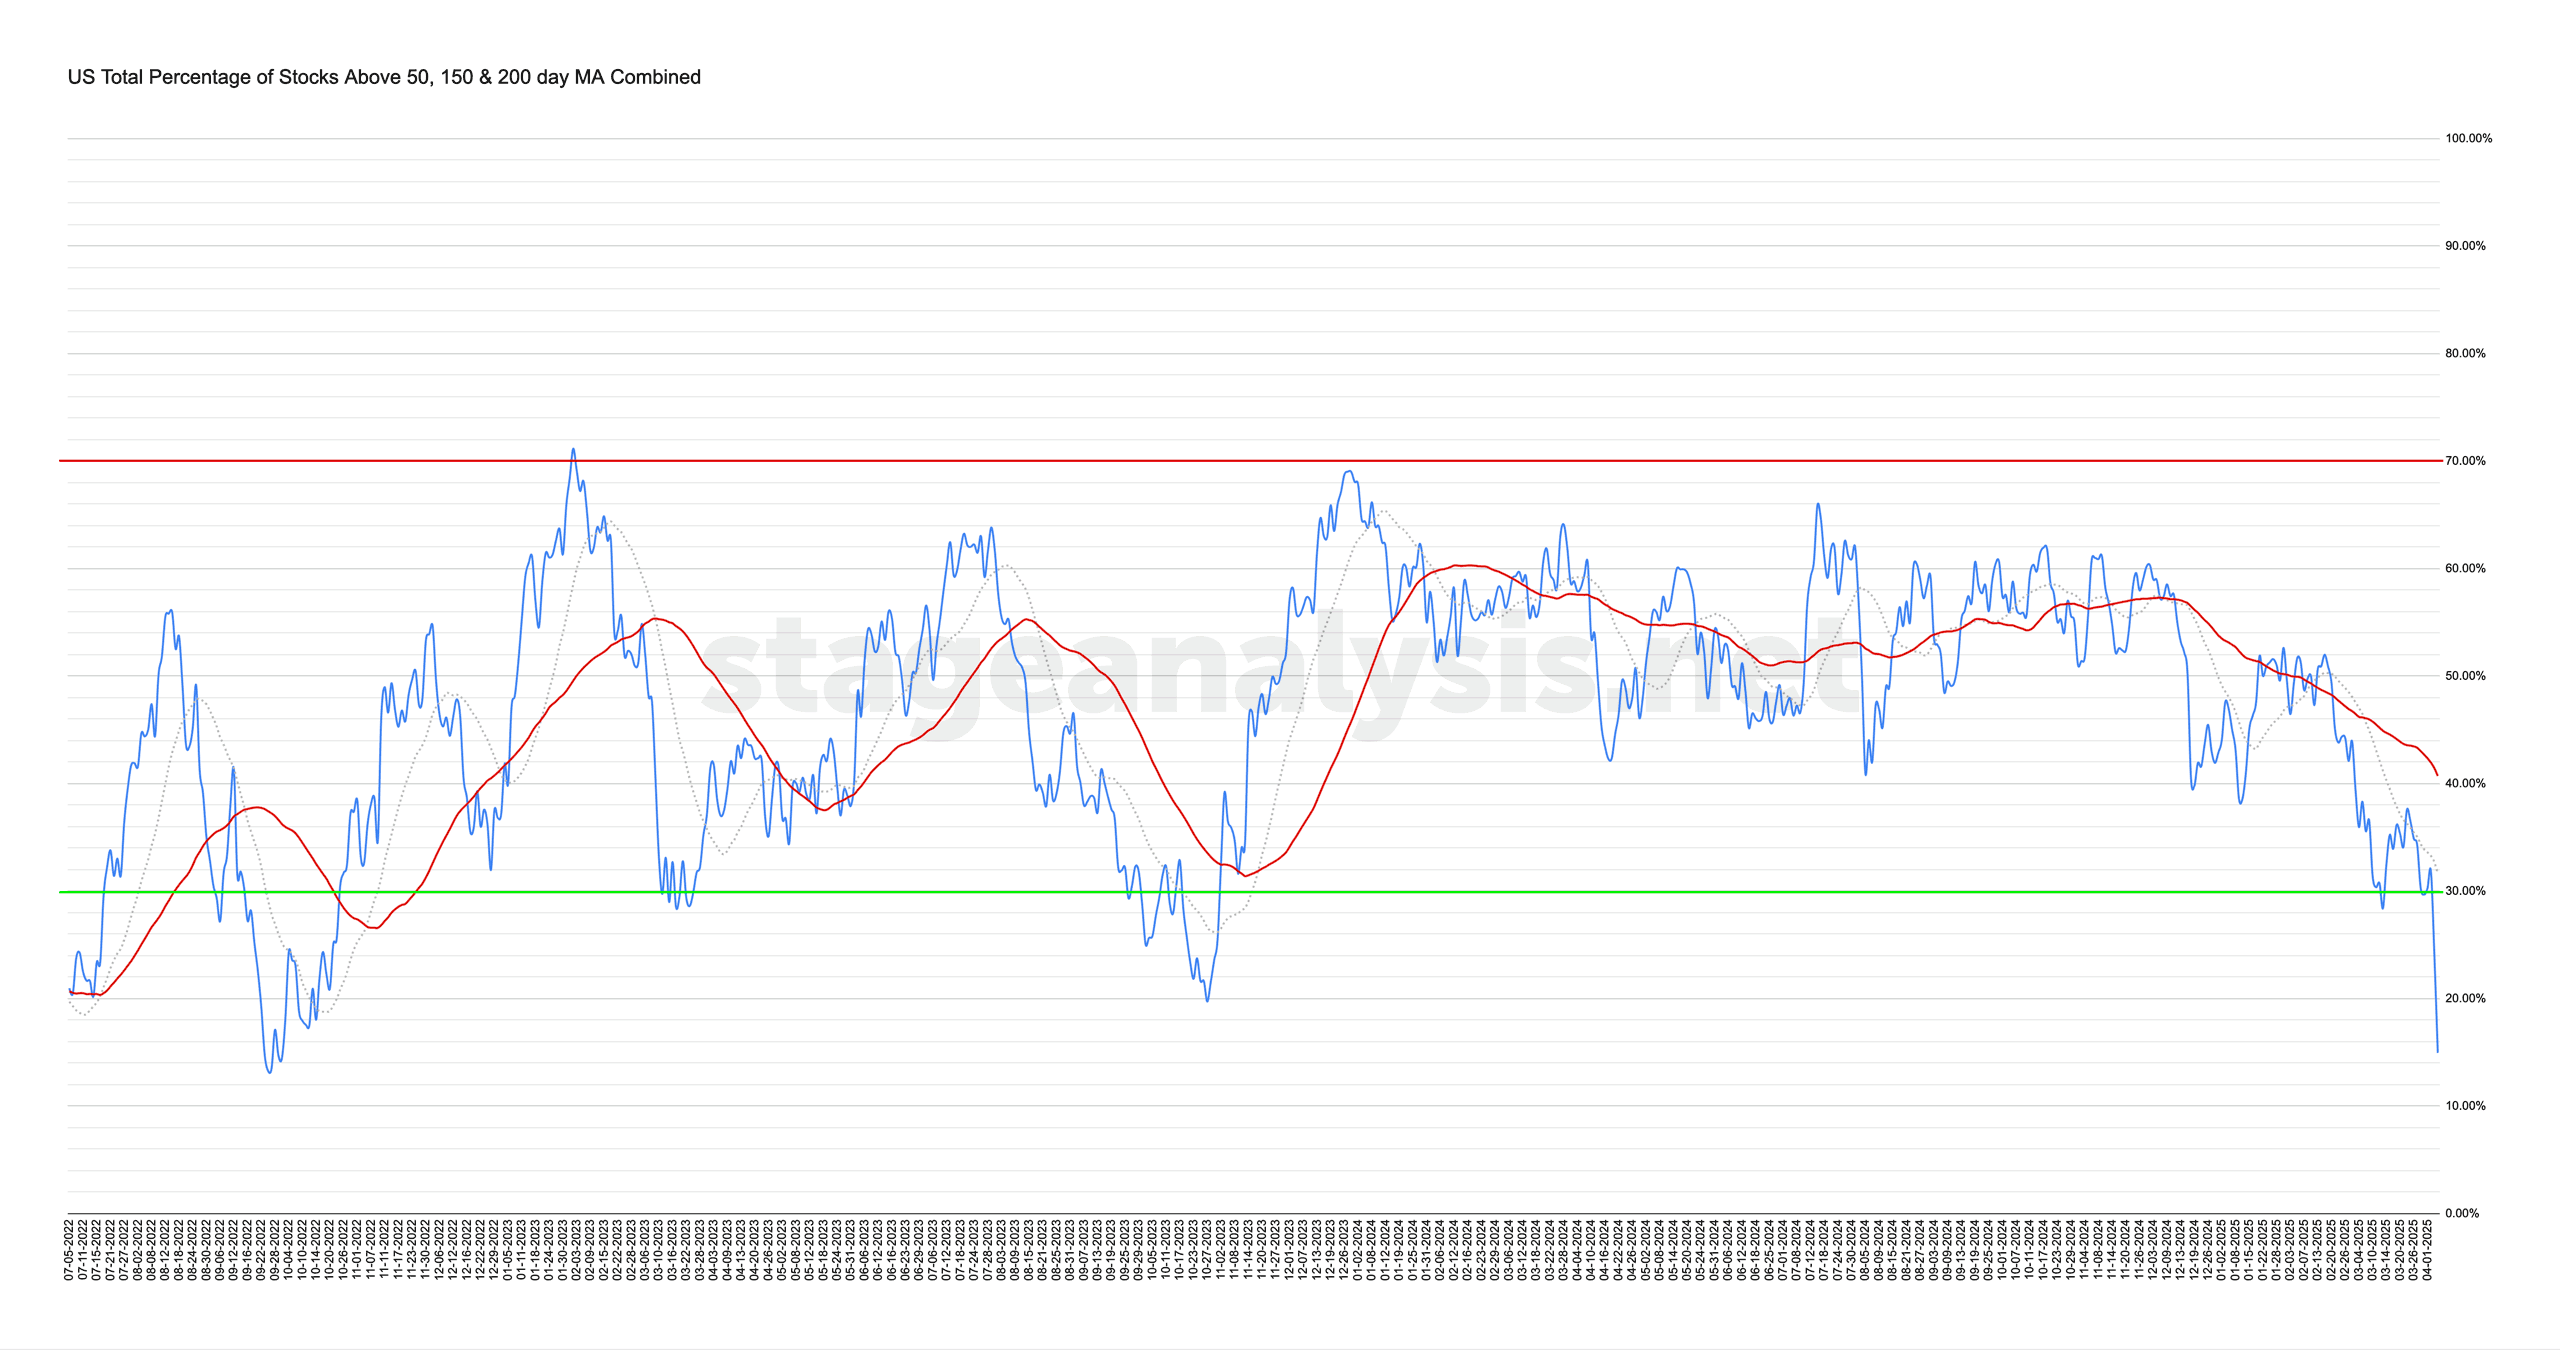
Market Breadth: Percentage of Stocks Above their 50 Day, 150 Day & 200 Day Moving Averages Combined
The US Total Percentage of Stocks above their 50 Day, 150 Day & 200 Day Moving Averages (shown above) increased by +1.79% this week. Therefore, the overall combined average is at 16.82% in the US market (NYSE and Nasdaq markets combined) above their short, medium and long term moving averages.
Read More
11 April, 2025
US Stocks Watchlist – 10 April 2025
There were 17 stocks highlighted from the US stocks watchlist scans today...
Read More
06 April, 2025
Stage Analysis Members Video – 6 April 2025 (26 mins)
The Stage Analysis members weekend video reviewing the major US indexes and mega cap stocks as well the usual regular features to help to determine the Weight of Evidence.
Read More
04 April, 2025
Market Breadth: Percentage of Stocks Above their 50 Day, 150 Day & 200 Day Moving Averages Combined
The US Total Percentage of Stocks above their 50 Day, 150 Day & 200 Day Moving Averages (shown above) decreased by -15.30% this week. Therefore, the overall combined average is at 15.02% in the US market (NYSE and Nasdaq markets combined) above their short, medium and long term moving averages.
Read More
01 April, 2025
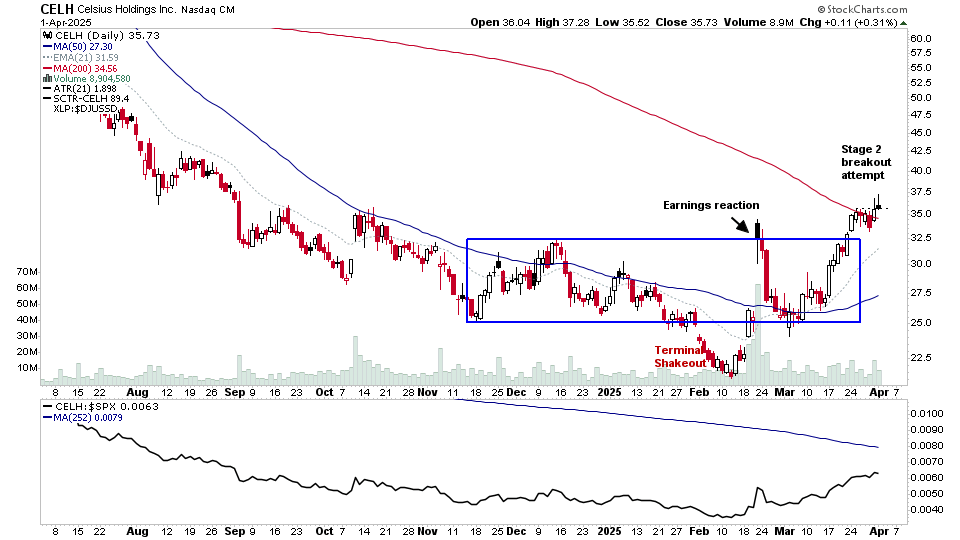
US Stocks Watchlist – 1 April 2025
There were 12 stocks highlighted from the US stocks watchlist scans today...
Read More
30 March, 2025
Stage Analysis Members Video – 30 March 2025 (43mins)
The Stage Analysis members weekend video this week reviews the Stages of the major mega cap stocks and some of the leaders of the current cycle – PLTR, APP, CVNA etc, as well the usual regular features to help to determine the Weight of Evidence.
Read More
28 March, 2025
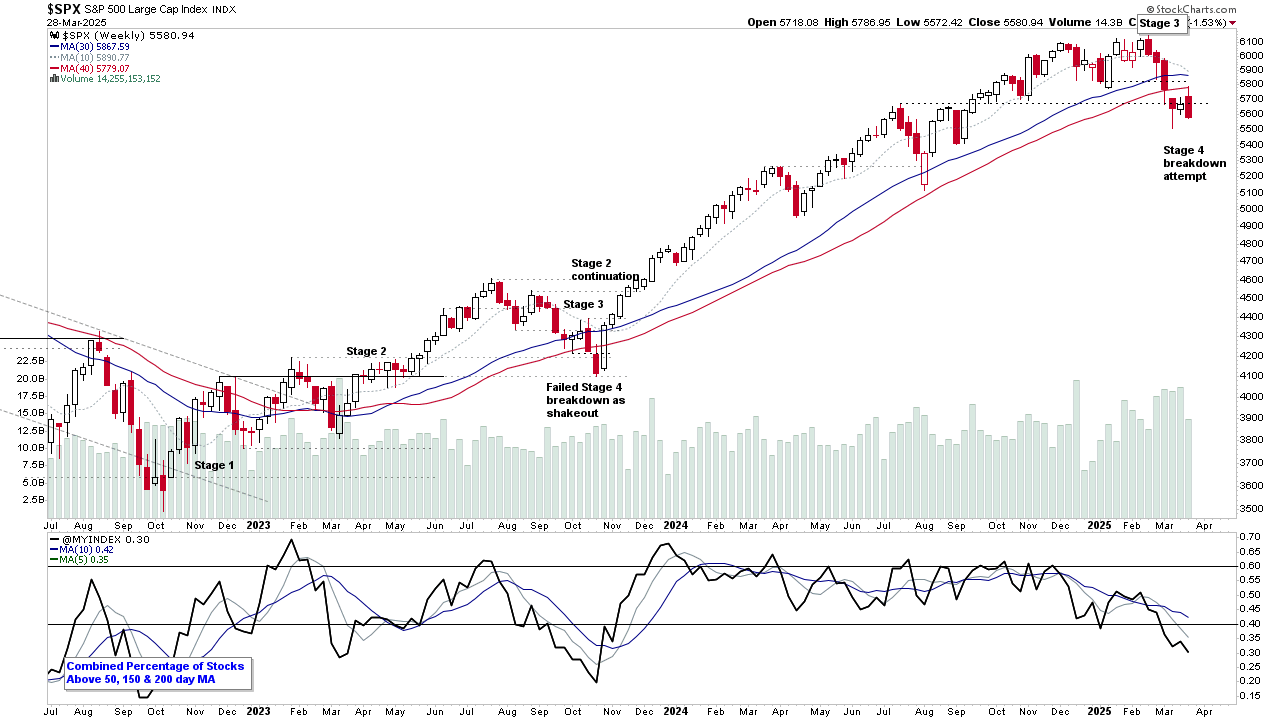
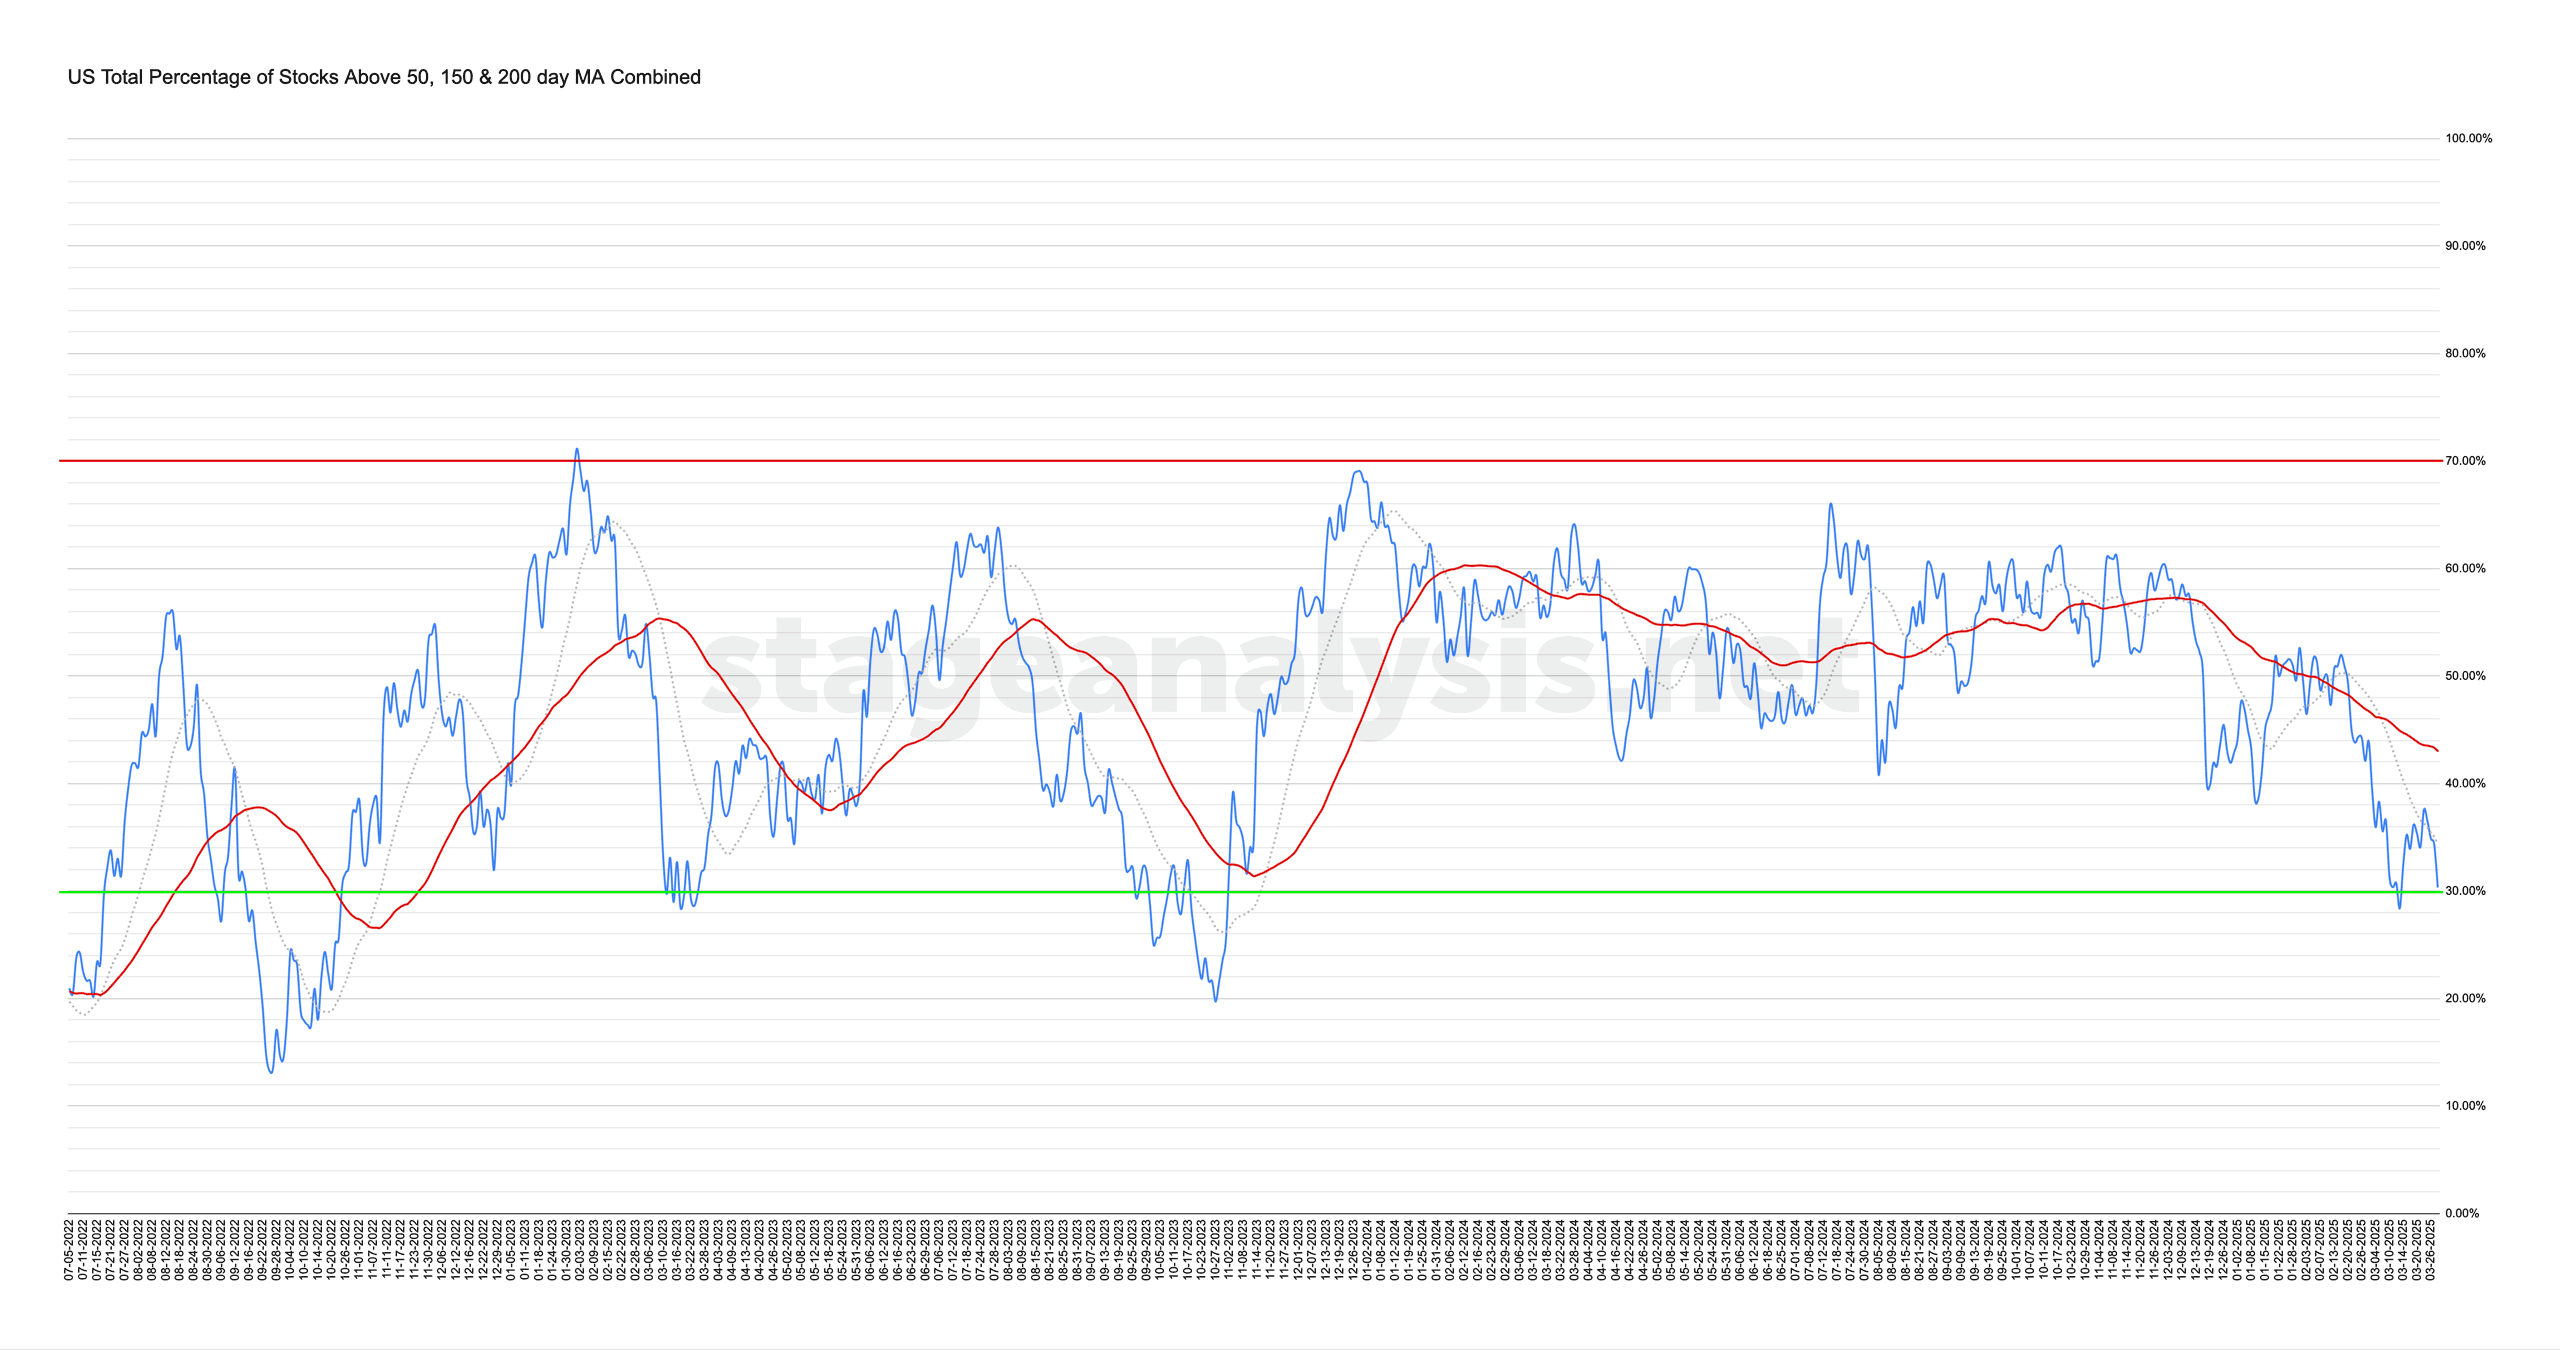
Market Breadth: Percentage of Stocks Above their 50 Day, 150 Day & 200 Day Moving Averages Combined
The US Total Percentage of Stocks above their 50 Day, 150 Day & 200 Day Moving Averages (shown above) decreased by -3.77% this week. Therefore, the overall combined average is at 30.32% in the US market (NYSE and Nasdaq markets combined) above their short, medium and long term moving averages.
Read More
22 March, 2025
Stage Analysis Members Video – 22 March 2025 (1hr)
The Stage Analysis members weekend video begins with discussion of the the US Watchlist Stocks in detail on multiple timeframes, Stages Summary, Relative Strength Rankings, the Sector breadth and Sub-industries Bell Curves, the key Market Breadth Charts to determine the Weight of Evidence, Bitcoin & Ethereum and the Major US Stock Market Indexes Update.
Read More