US Stockmarket & Crypto Weekend Update including the US Stocks Watchlist - 9 January 2022
US Stocks Watchlist - 9 January 2022
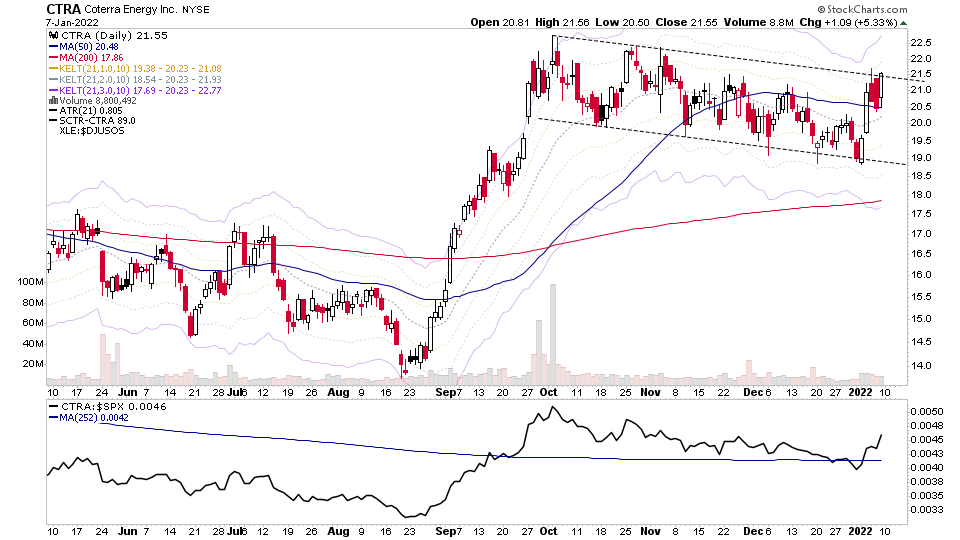
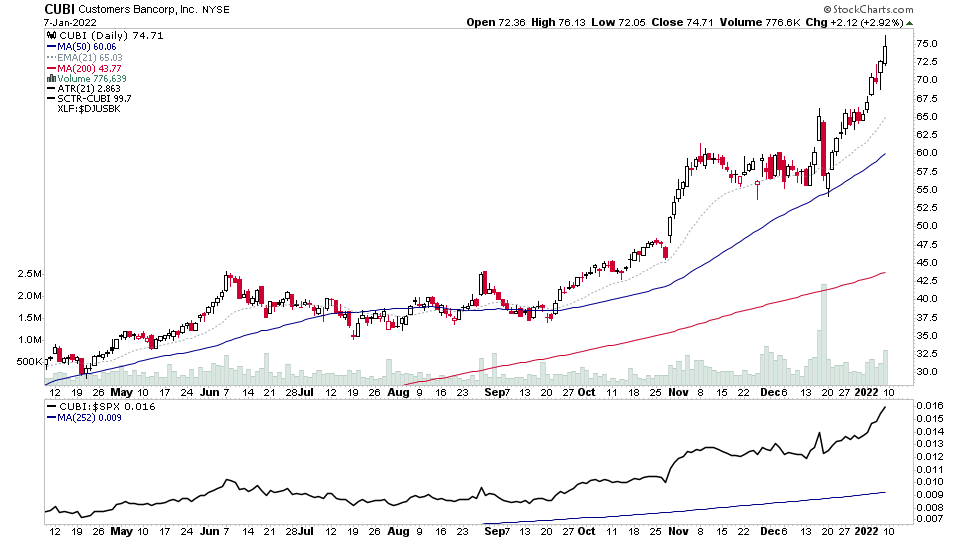
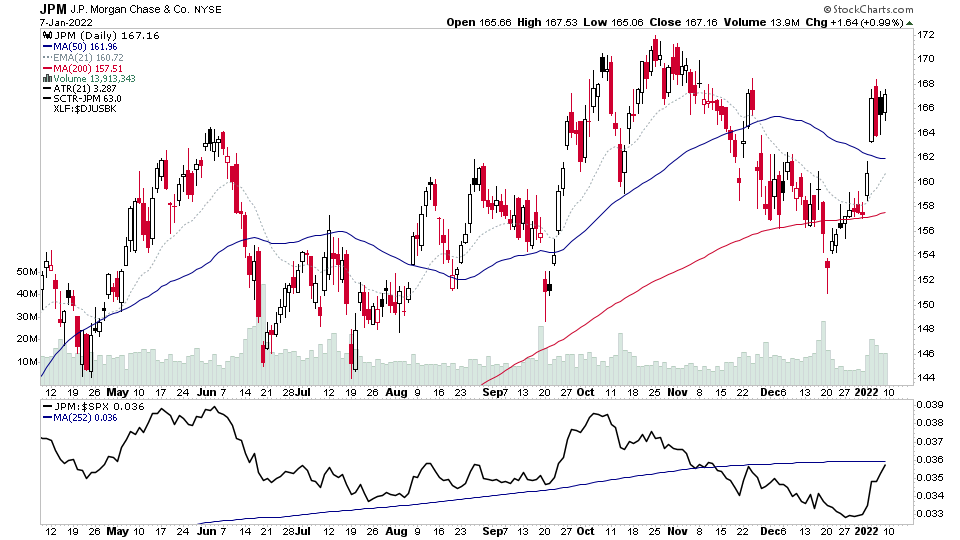
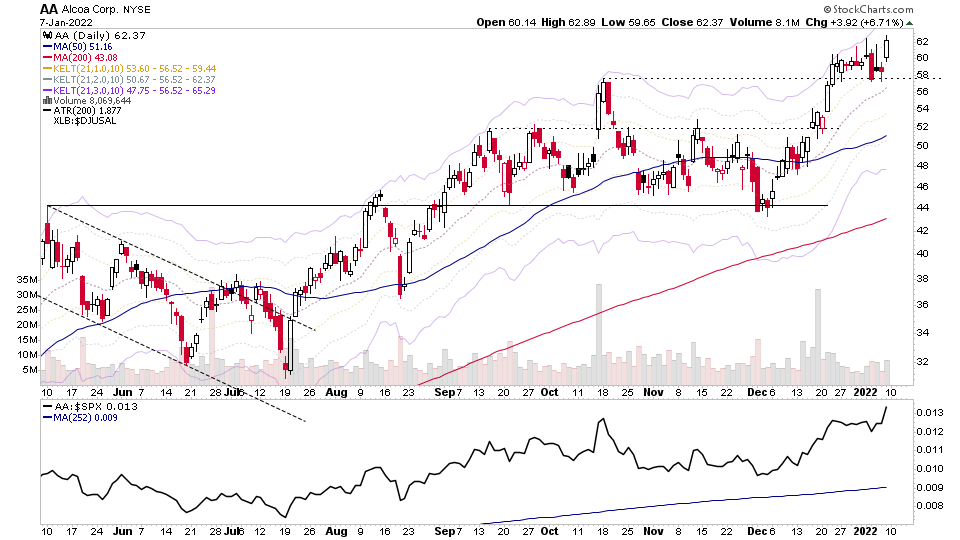
Financials and Energy stocks dominating the watchlist this week, with strong volume coming into both sectors during the week.
There were 33 stocks for the US stocks watchlist this weekend. Here's a small sample from the list:
CTRA, CUBI, JPM, AA, + 29 more...
Non-members
To see all the watchlist posts and other premium content, such as regular detailed videos and exclusive Stage Analysis tools, become a member
Join Today
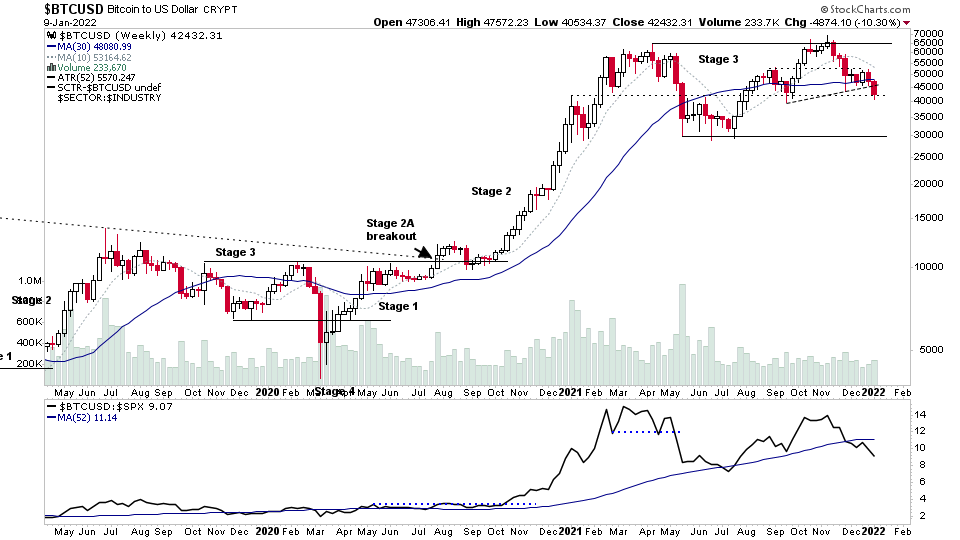
Bitcoin
Bitcoin potential for a Stage 4 breakdown attempt, which would be on a break of the September low.
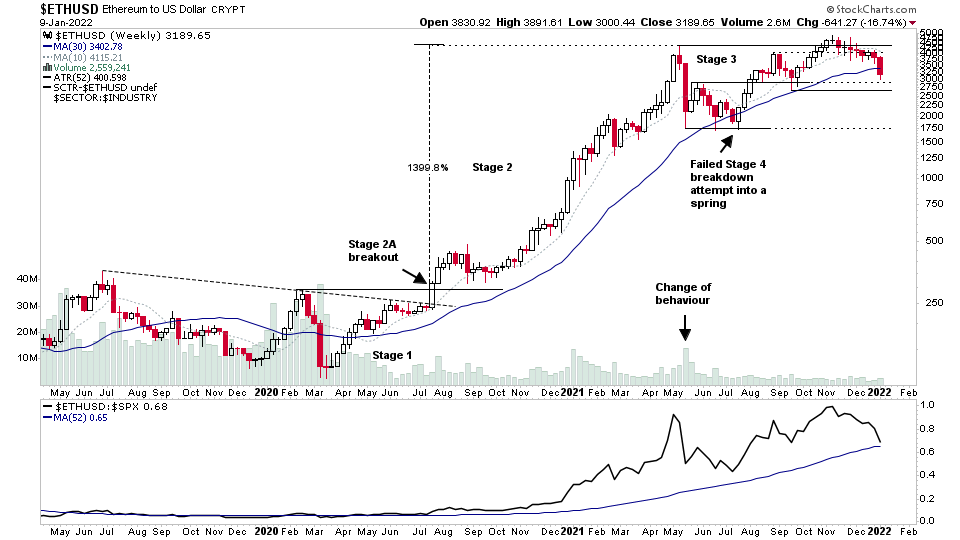
Ethereum
Ethereum complex Stage 3 pattern with failed Stage 2 continuation breakout to new highs that turned into an upthrust. Moving below the 30 week MA and approaching support zone.
Relative strength versus the stock market at weakest level compared to its own MA for more than a year.
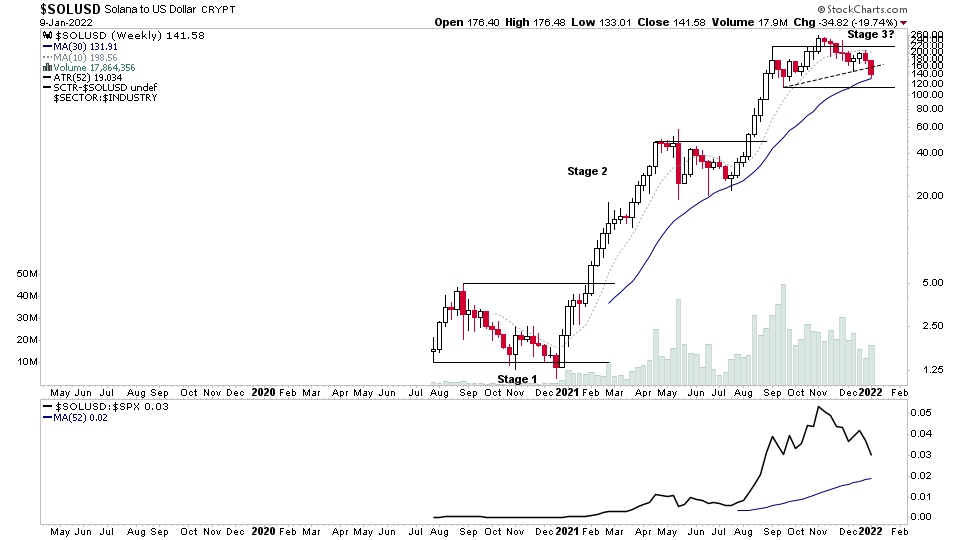
Solana
Solana potentially in Stage 3 with a 17 week head and shoulders pattern developing within the range.
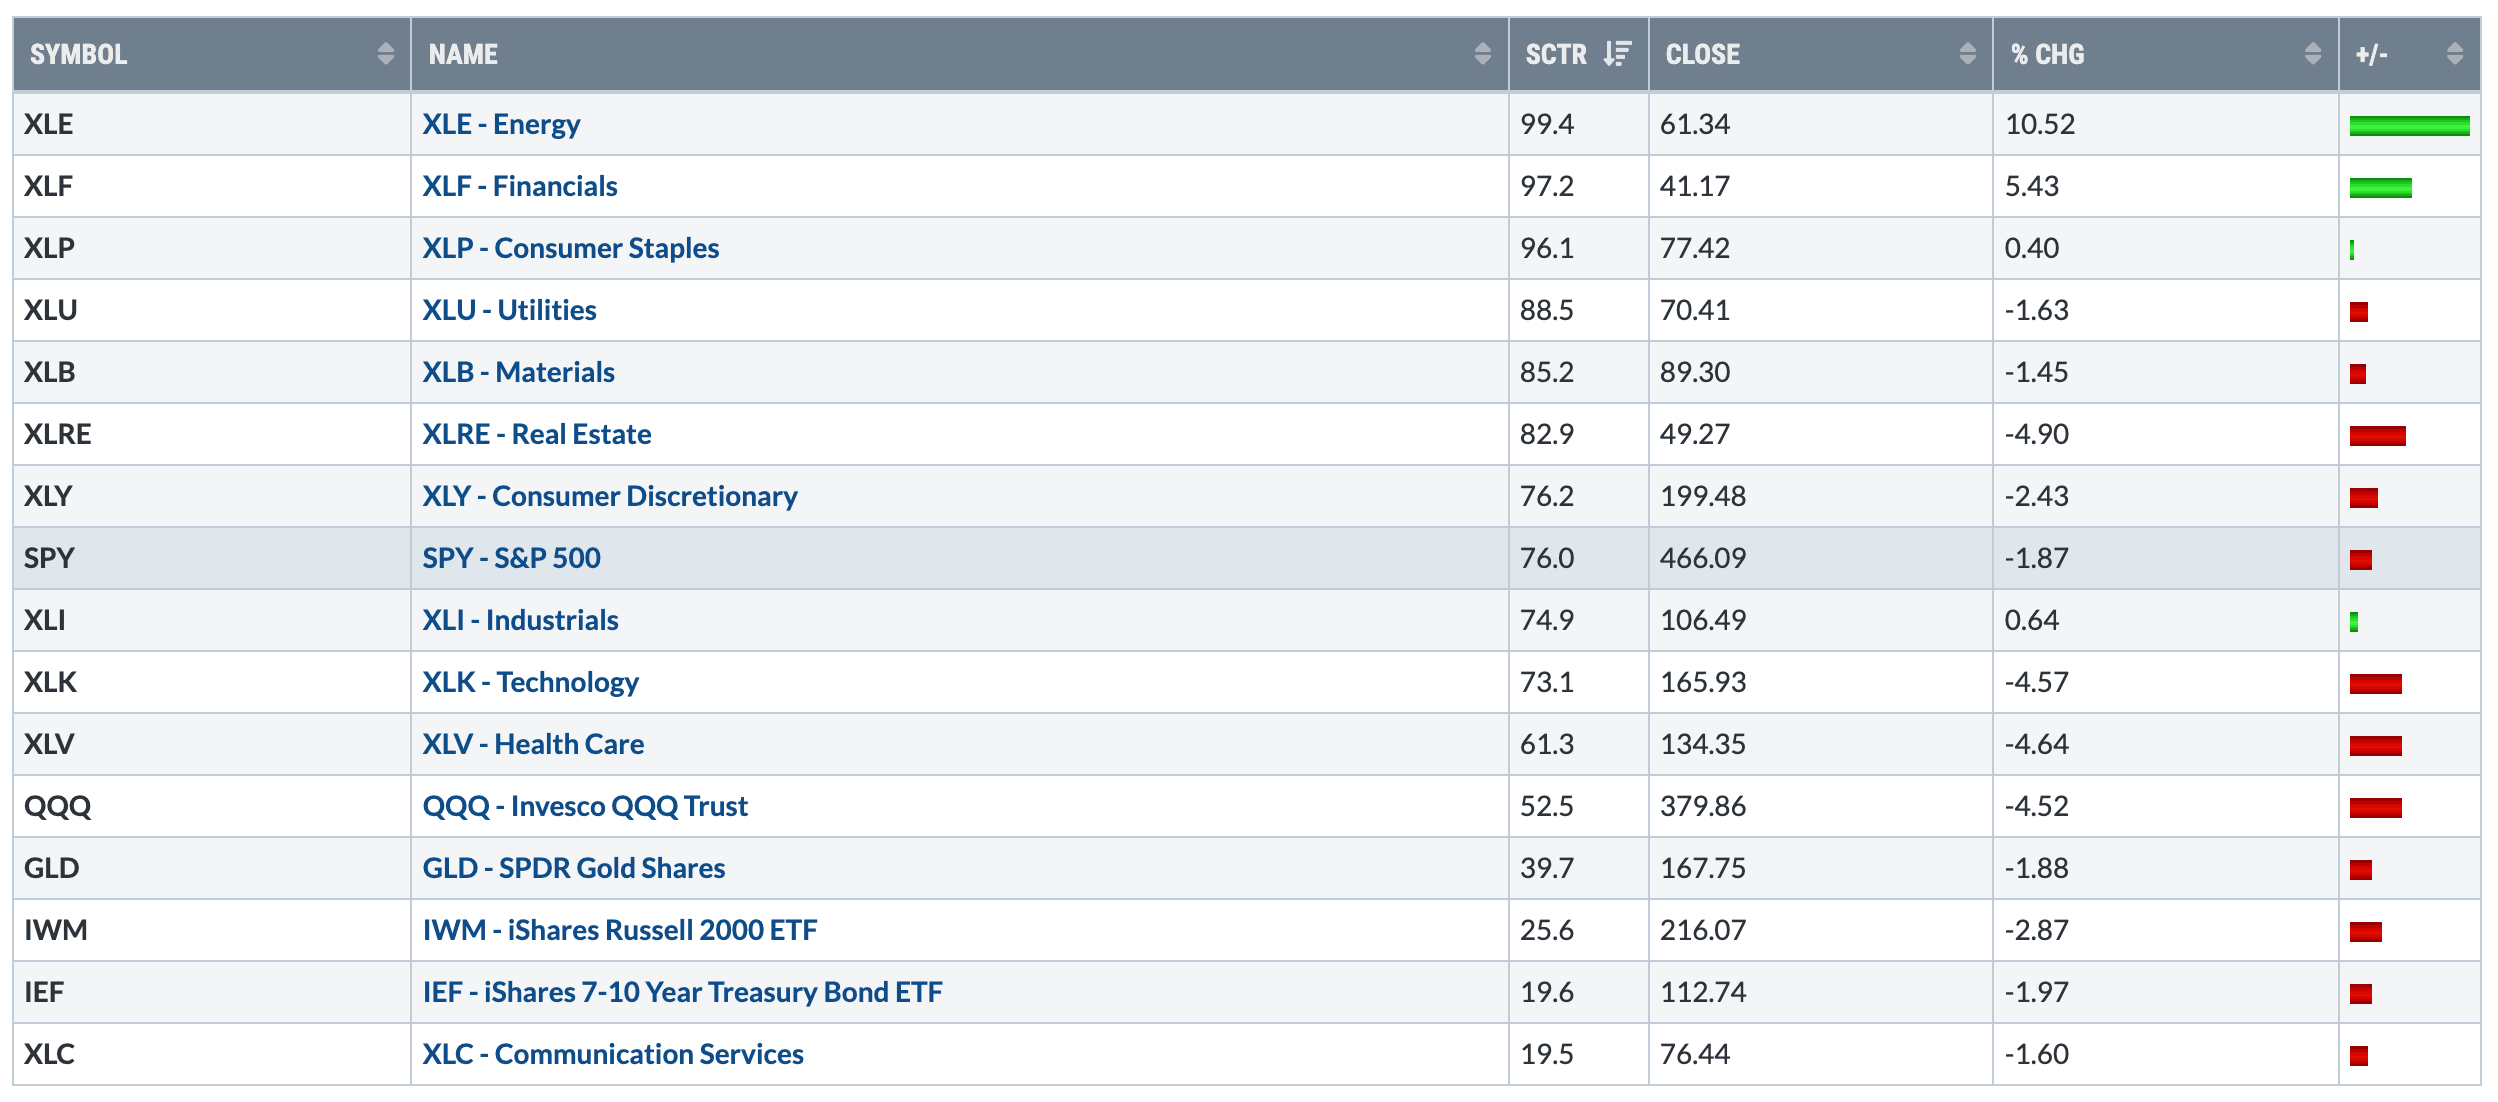
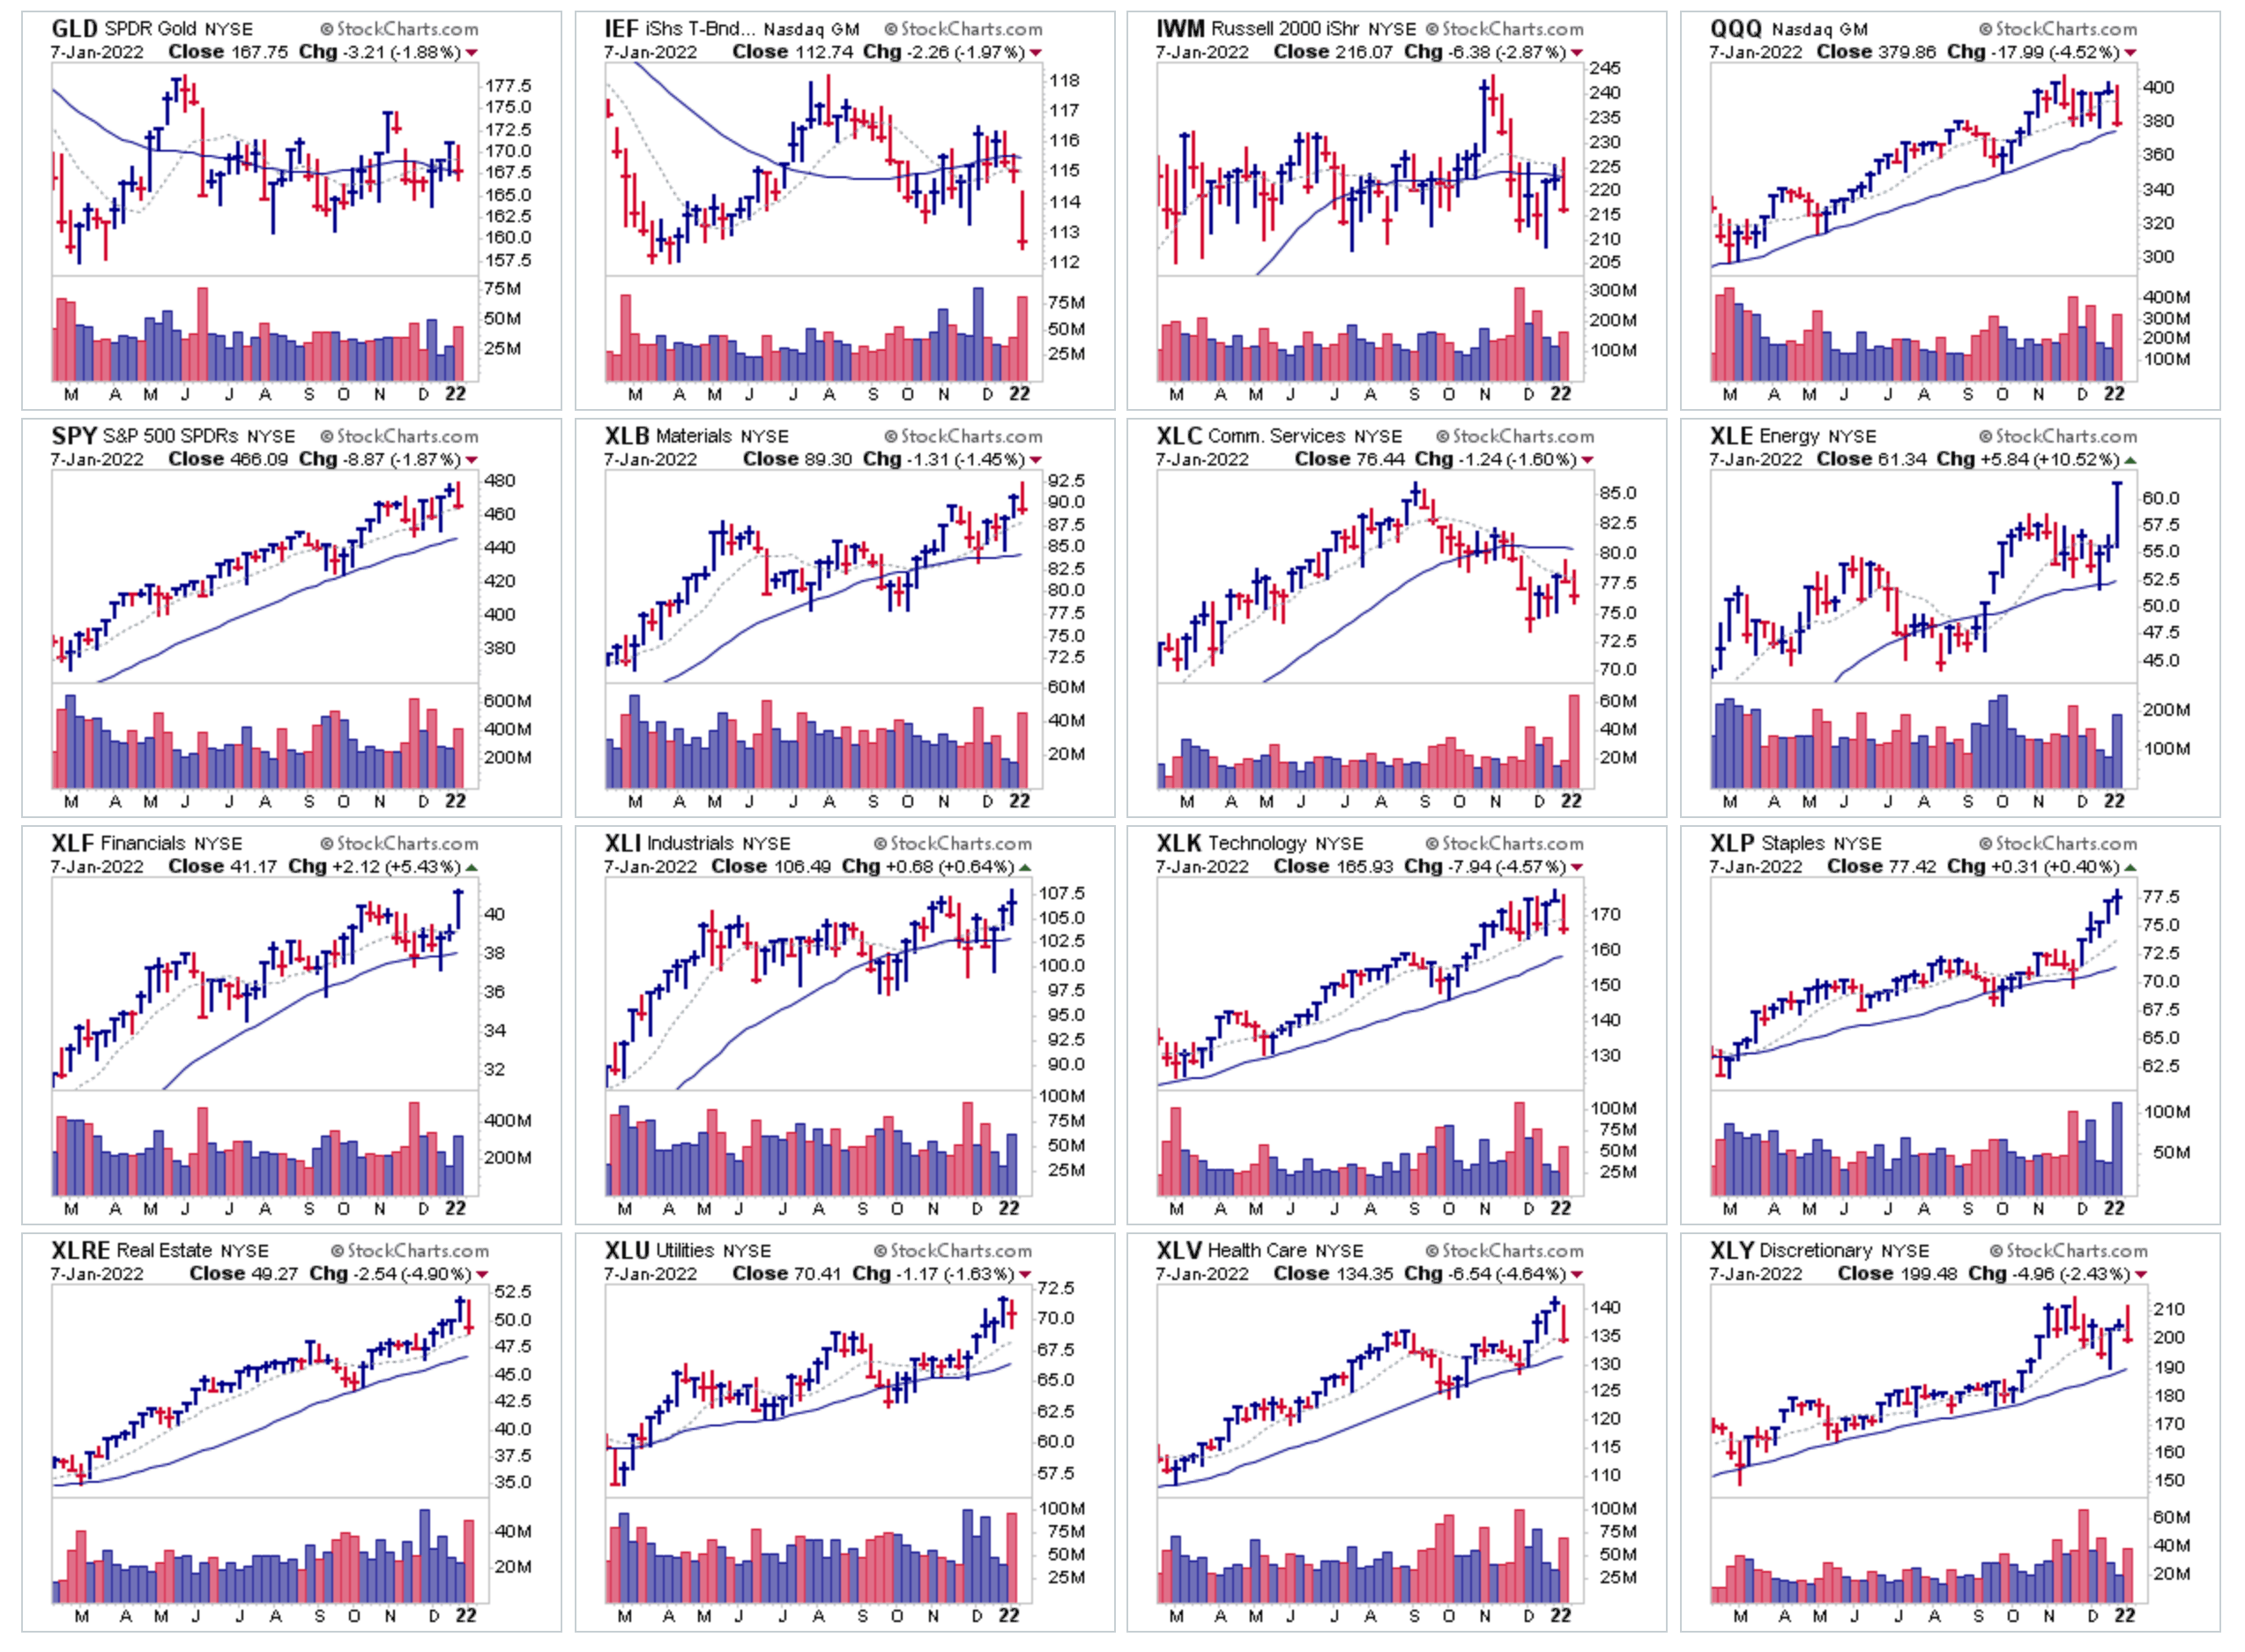
US Sectors & Major Index ETFs Relative Strength Table using the Stockcharts SCTR score
New Stage 2 continuation breakouts in Energy $XLE & Financials $XLF this week which move them to the top of the relative strength table.
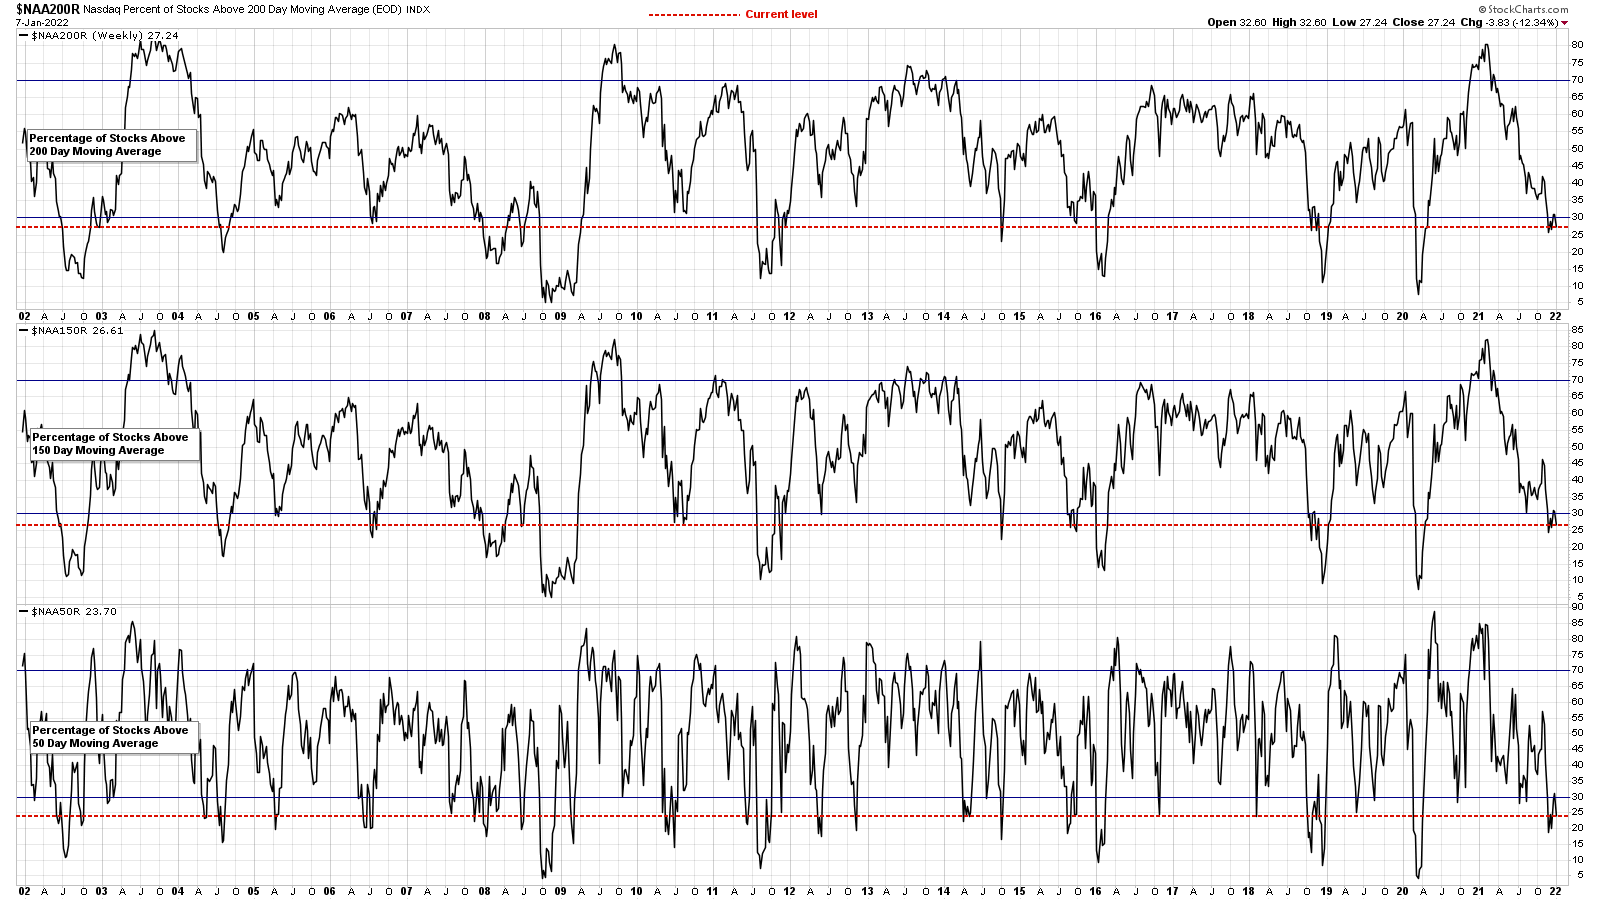
20 Year chart of the Nasdaq Percentage of Stocks Above Their 50, 150 and 200 Day MAs
In the lower zone on the short, medium and long term measures. So the Nasdaq Composite is in Stage 4 by this measure even though the index chart is still in Stage 3.
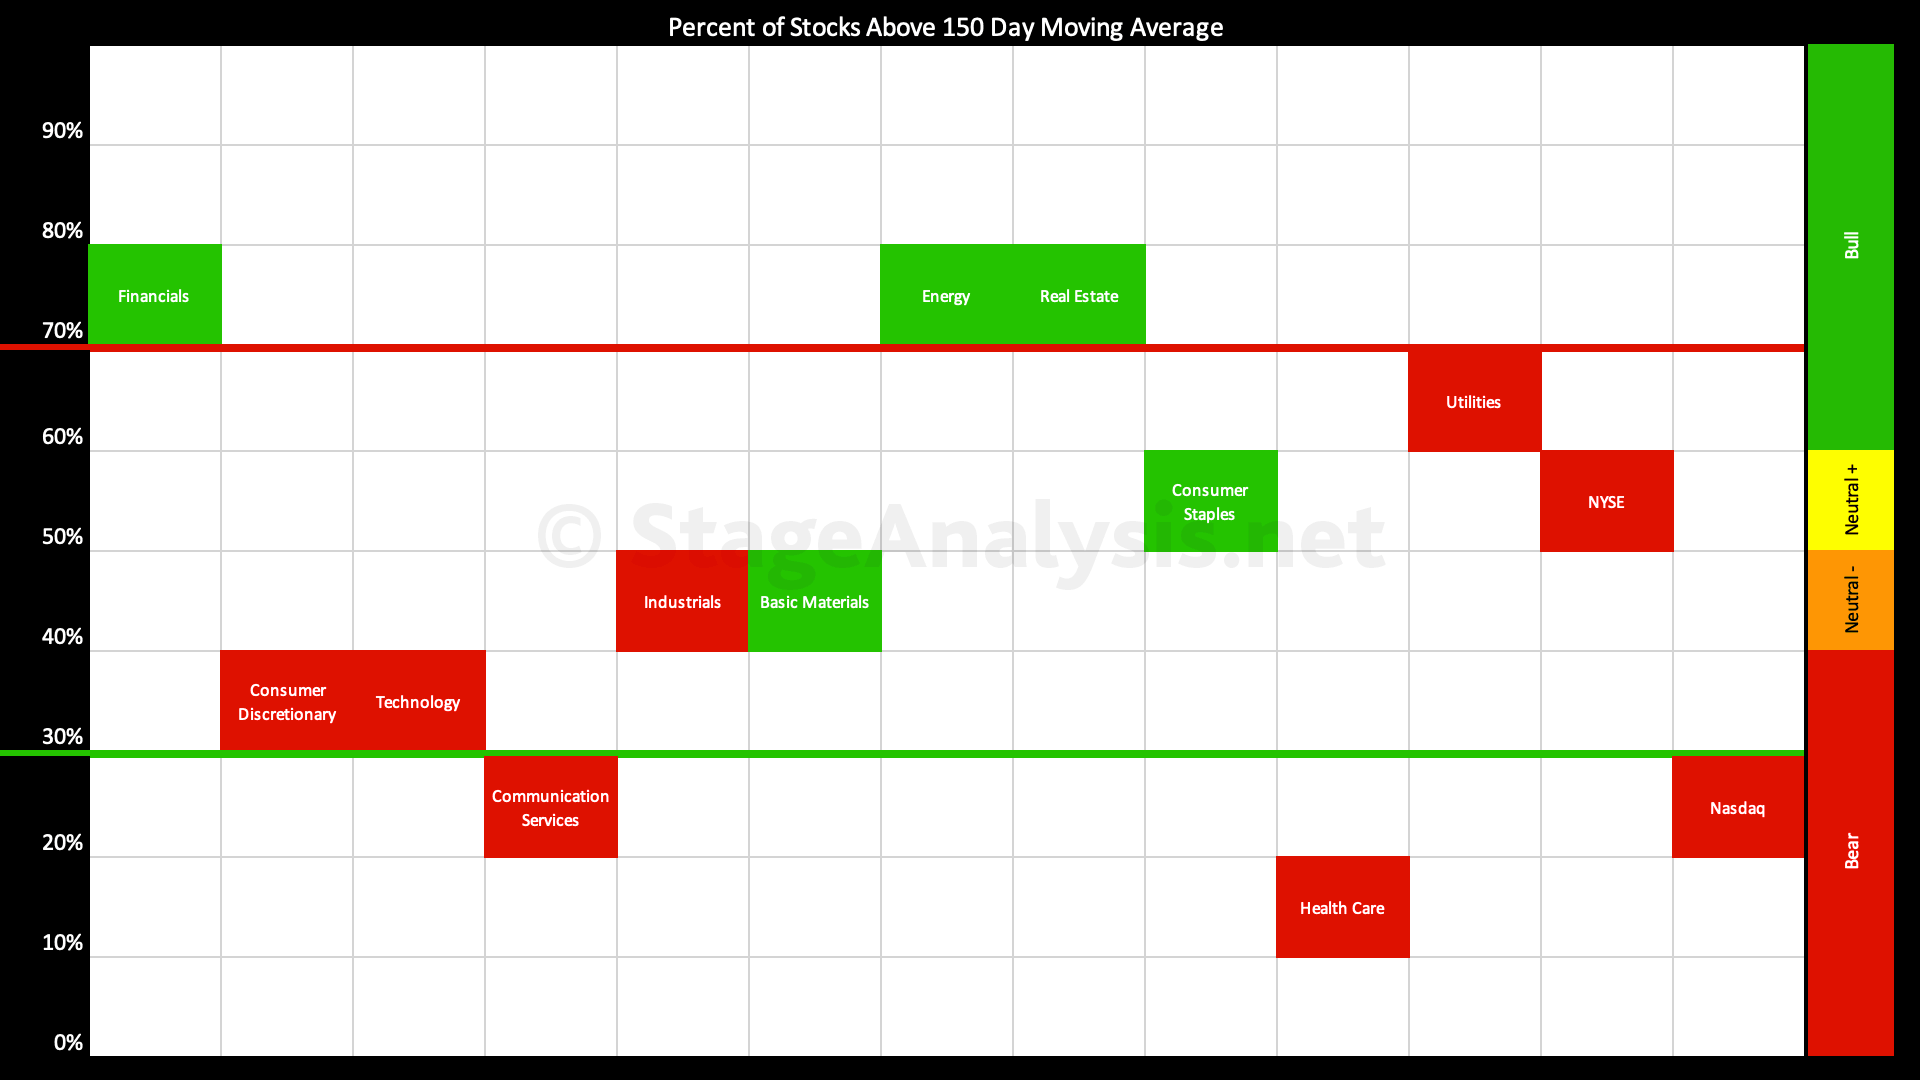
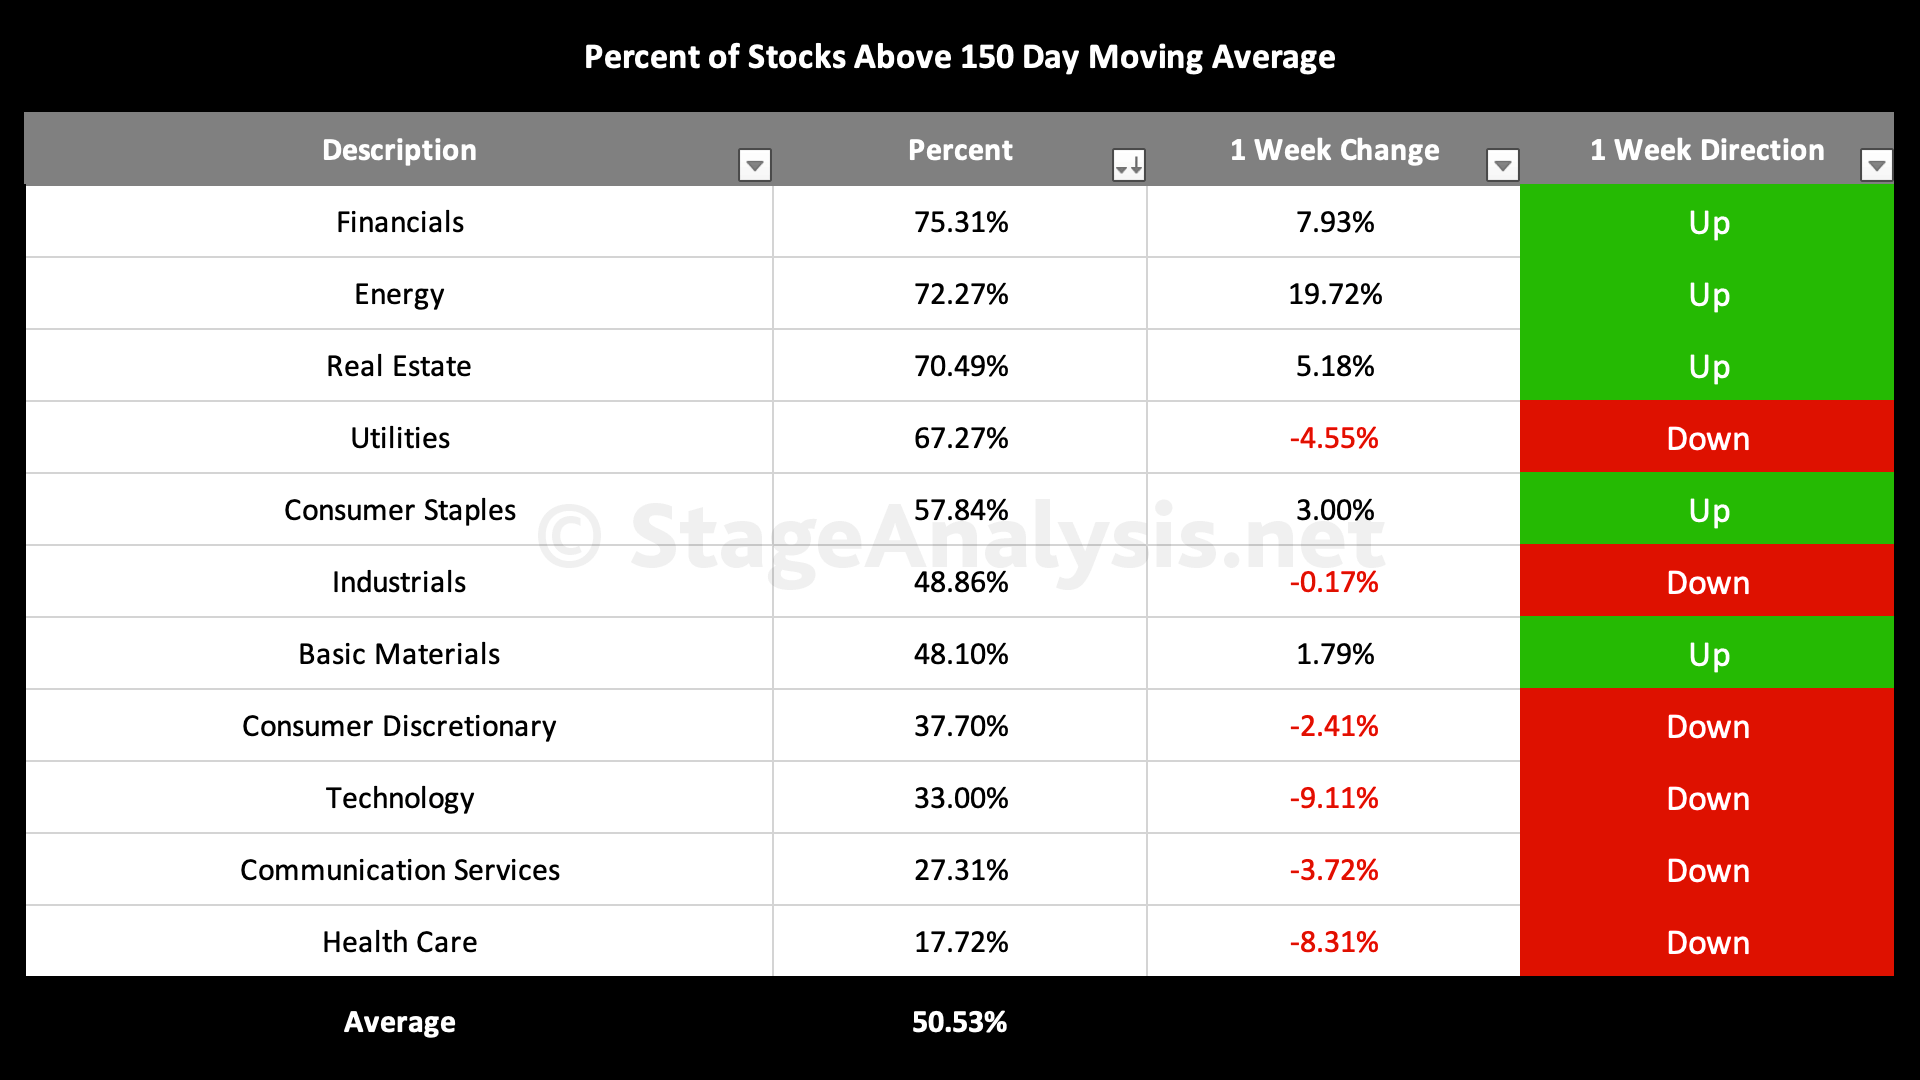
US Sectors - Percentage of Stocks Above their 150 Day (30 Week) Moving Average
Average: 50.53% (+0.85% 1wk)
- 4 sectors are in the Stage 2 zone (Financials, Energy, Real Estate, Utilities)
- 3 sectors are in Stage 1 / 3 zone (Consumer Staples, Industrials, Basic Materials)
- 4 sectors are in Stage 4 zone (Consumer Discretionary, Technology, Communication Services, Health Care)
Financials & Energy moved to the top of the table this week & are in the Stage 2 zone. Whereas Heath Care & Technology had the biggest drops and are in lower Stage 4 zone.
So a very mixed market with defensive sectors leading & overall average at 50.53% in Stage 3 or 1 zone.
(Data from the whole US market)
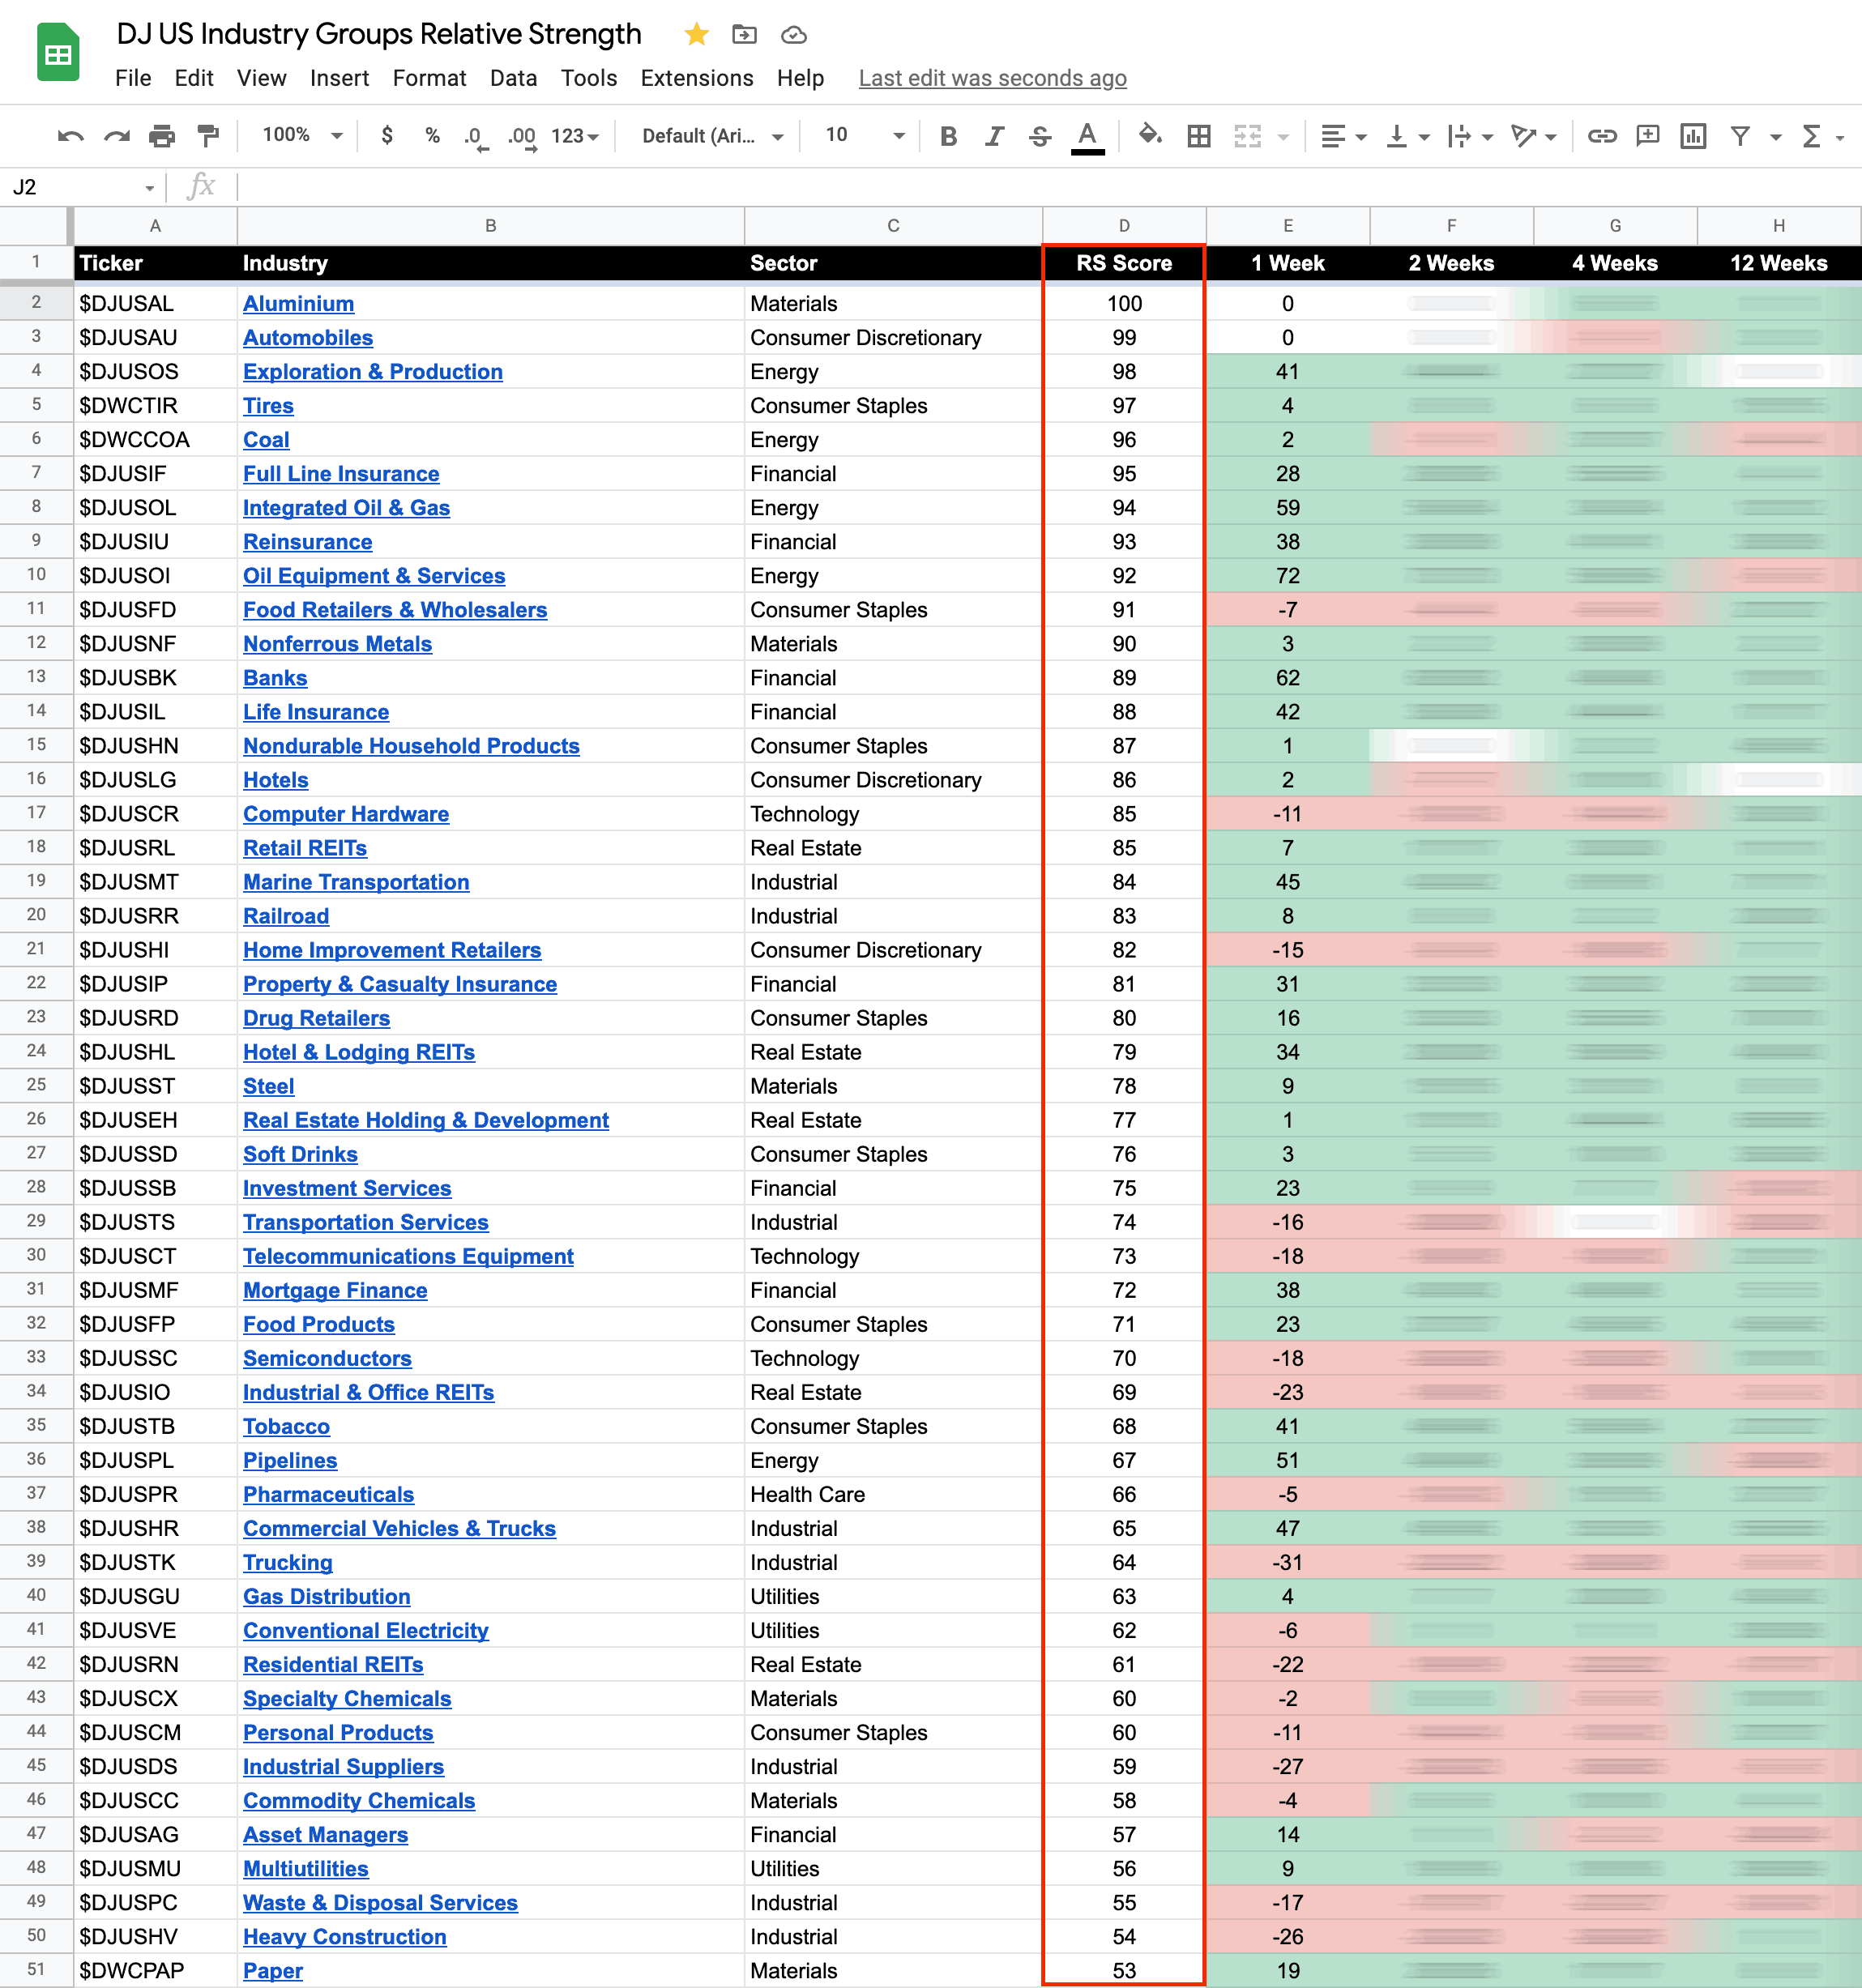
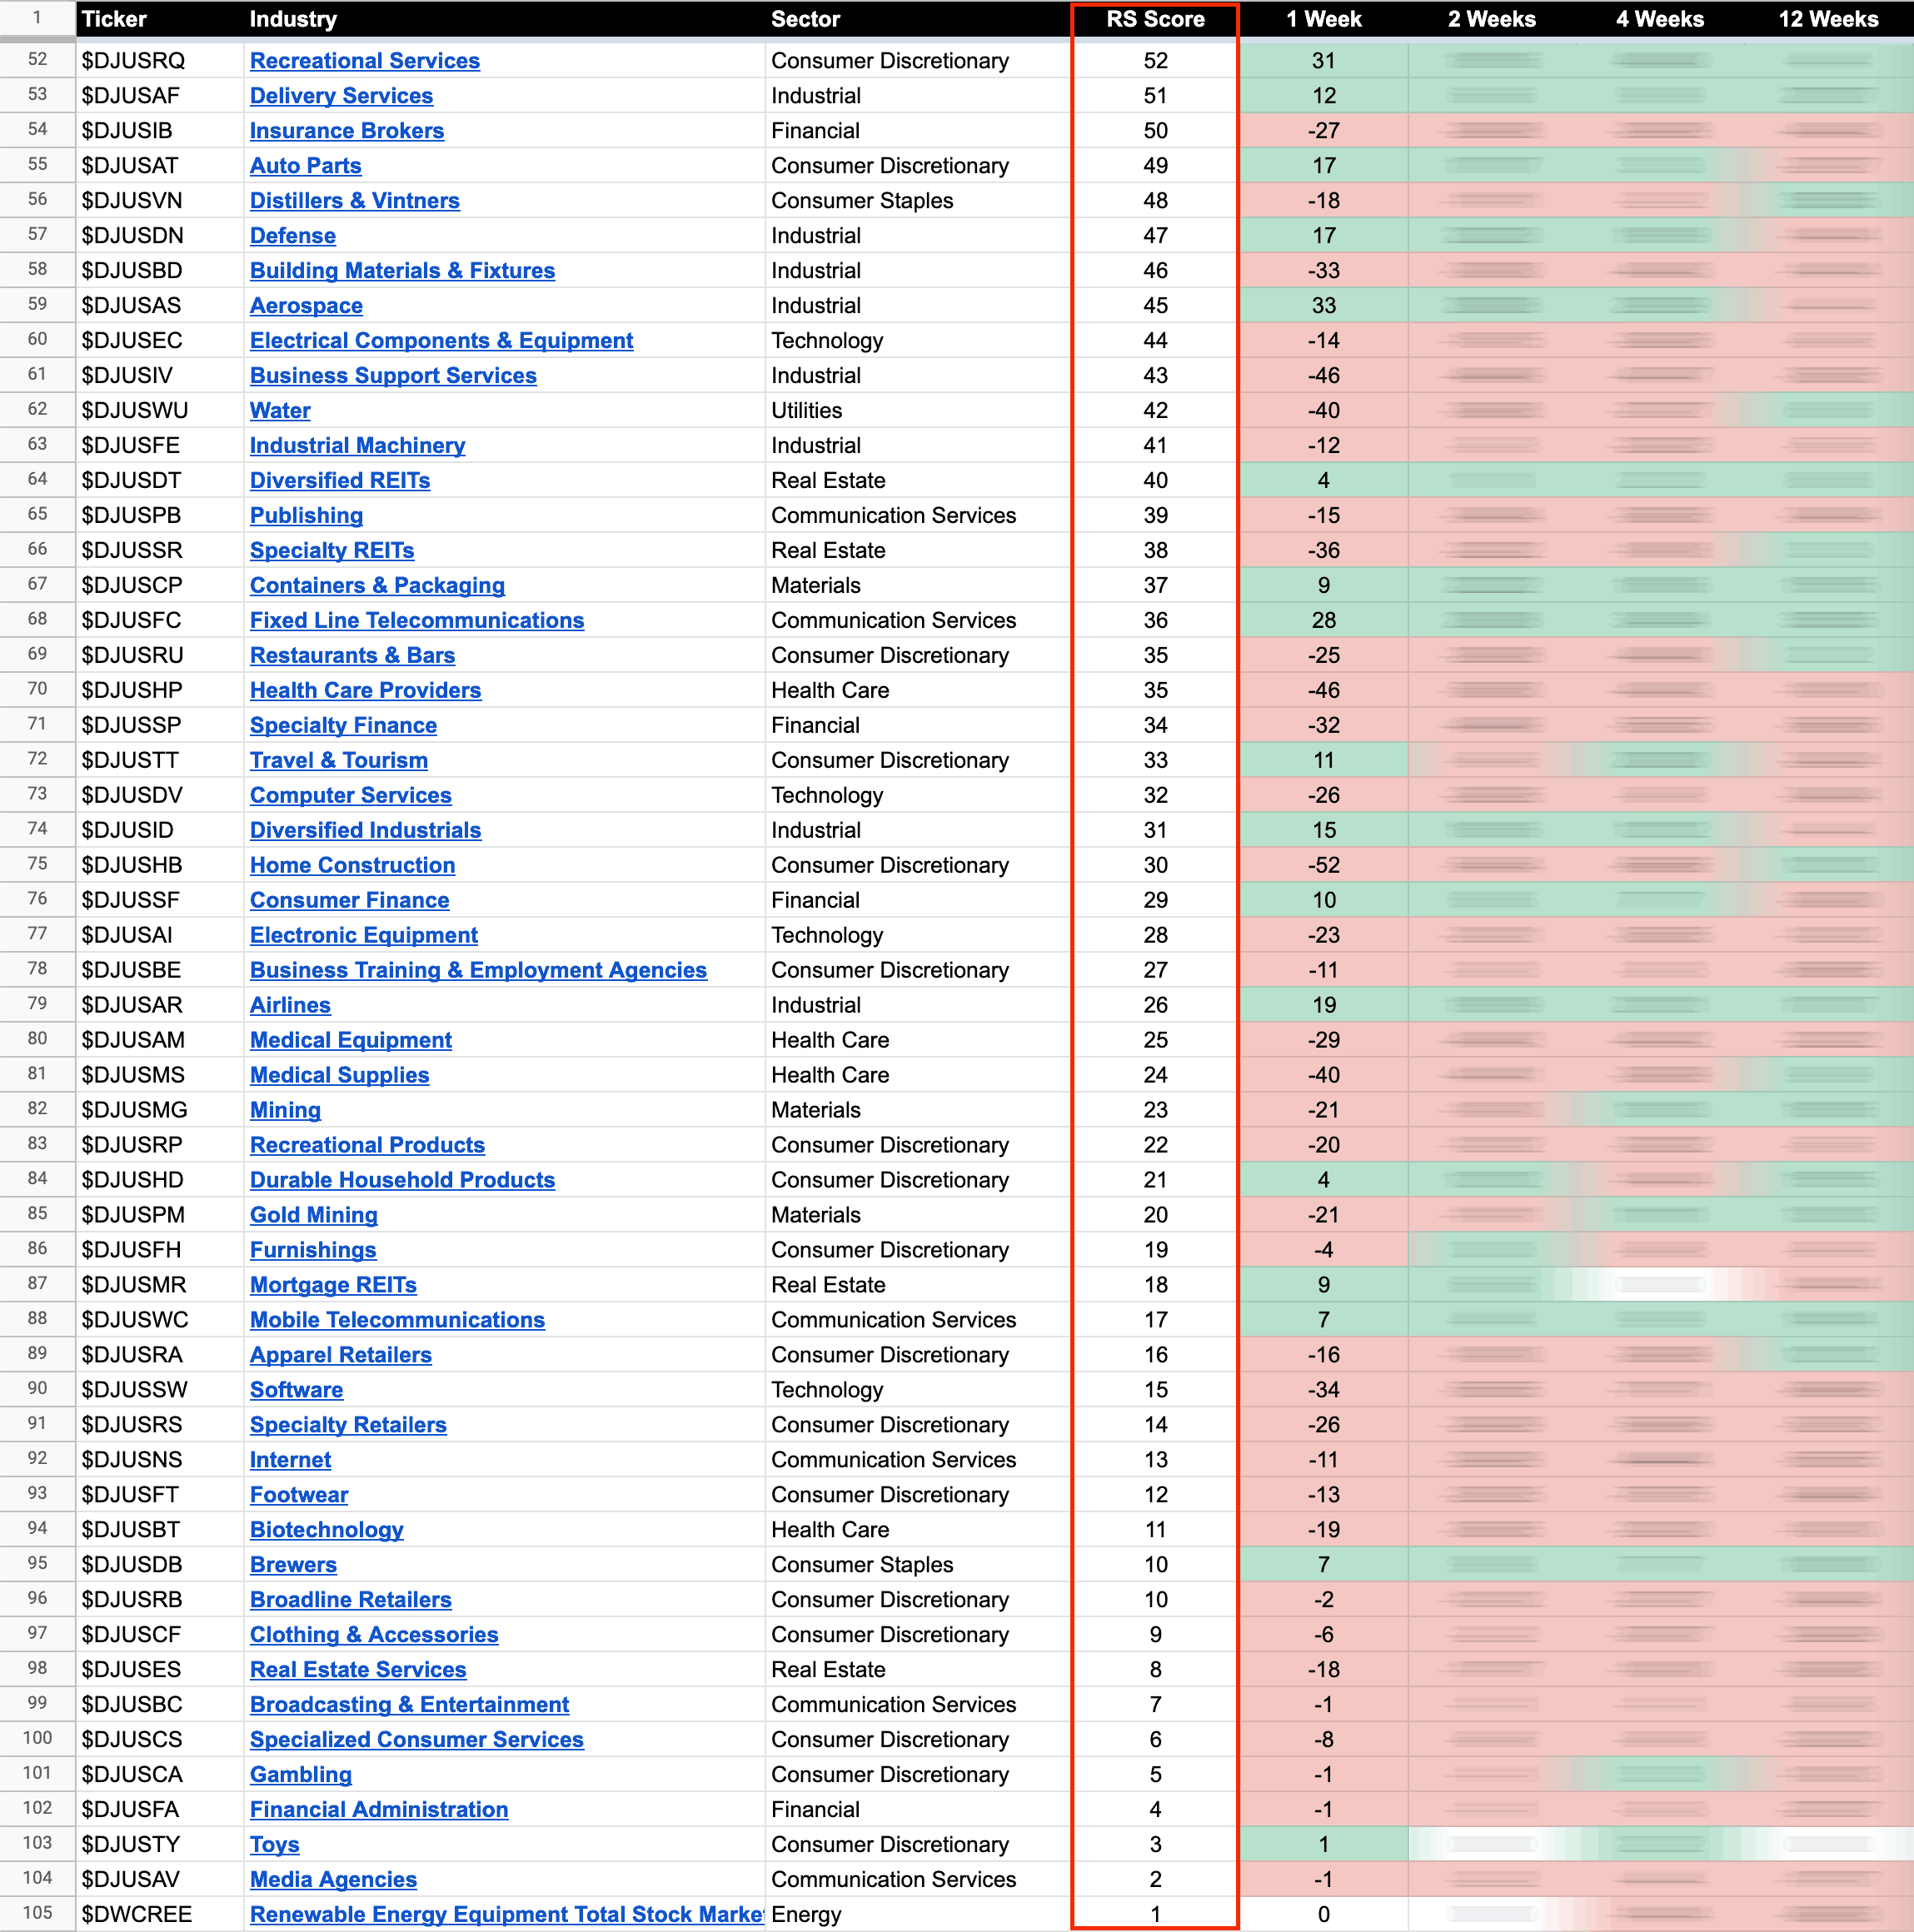
104 Dow Jones Industry Groups sorted by Relative Strength using stockcharts SCTR score
The purpose of the RS tables is to track the short, medium and long term RS changes of the individual groups to find the new leadership earlier than the crowd.
100 is strongest, 0 is weakest
You can find out which stocks are in each industry group by going to https://stockcharts.com/freecharts/indus....html#&t=T and clicking on the name of the group
Become a Stage Analysis Member:
To see more like this and other premium content, such as the regular US Stocks watchlist, detailed videos and intraday posts, become a Stage Analysis member.
Join Today
Disclaimer: For educational purpose only. Not investment advice. Seek professional advice from a financial advisor before making any investing decisions.

