US Stocks Industry Groups Relative Strength Rankings
The full post is available to view by members only. For immediate access:
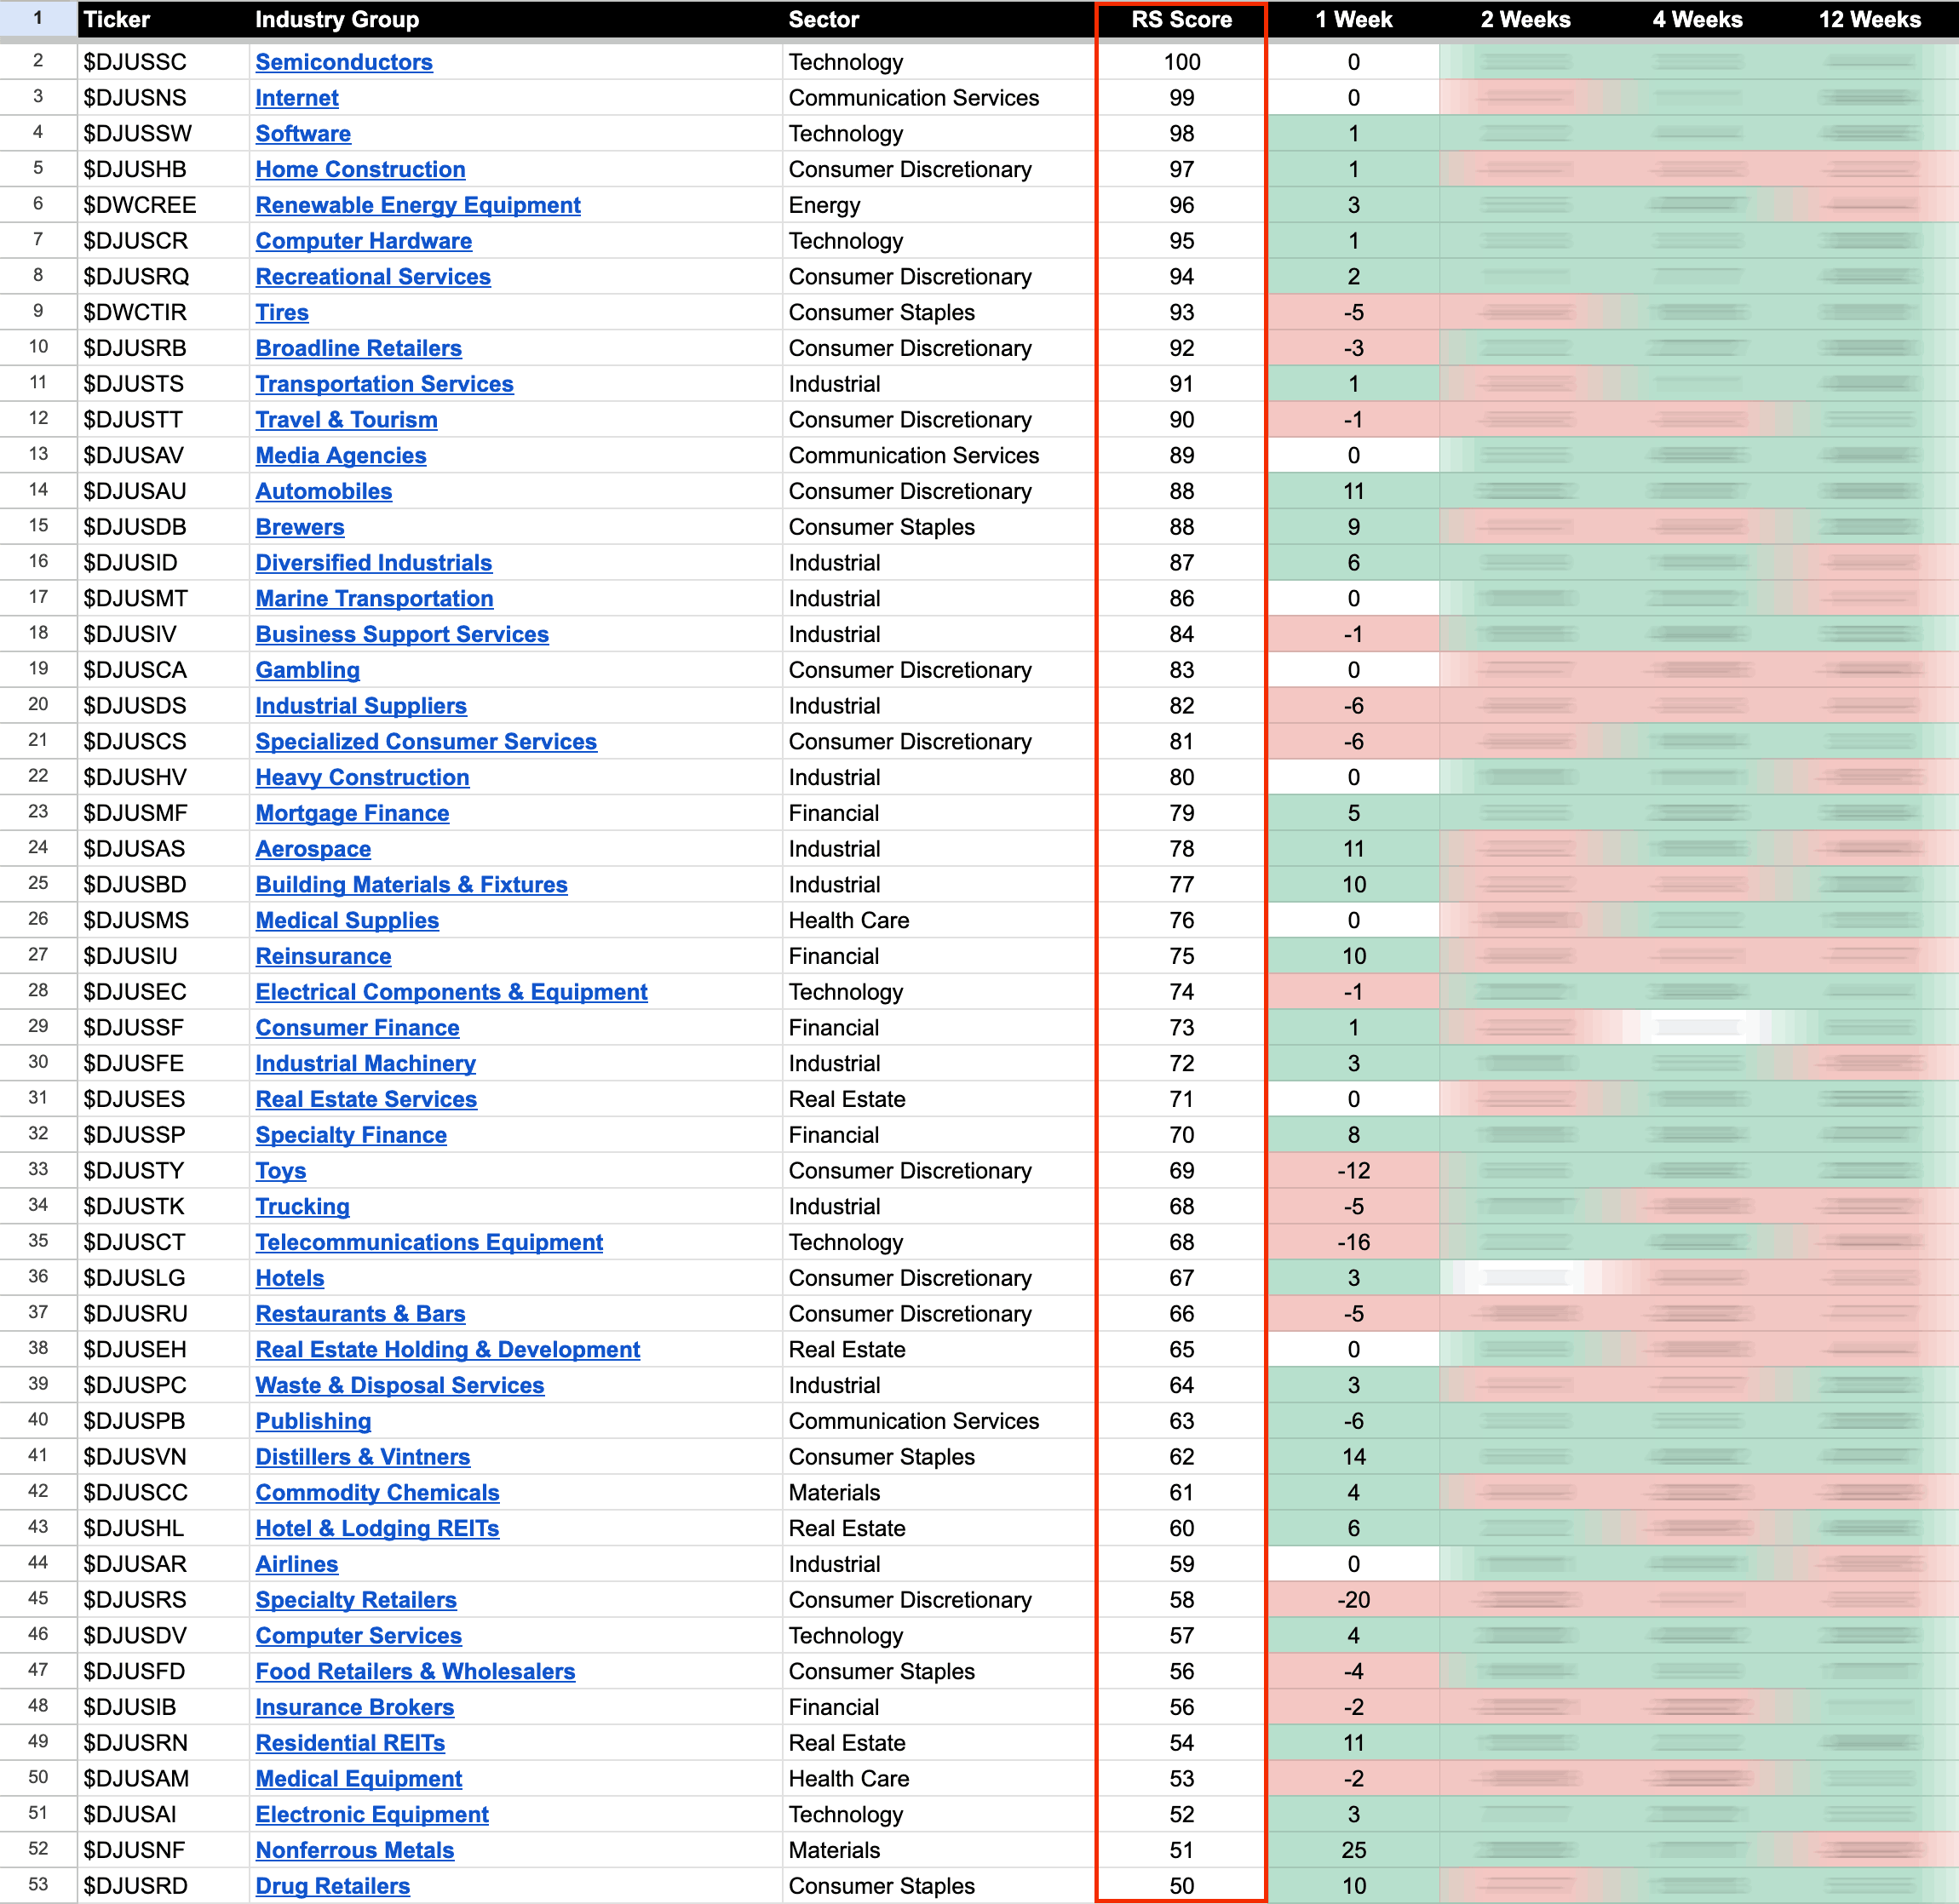
US Industry Groups by Highest RS Score
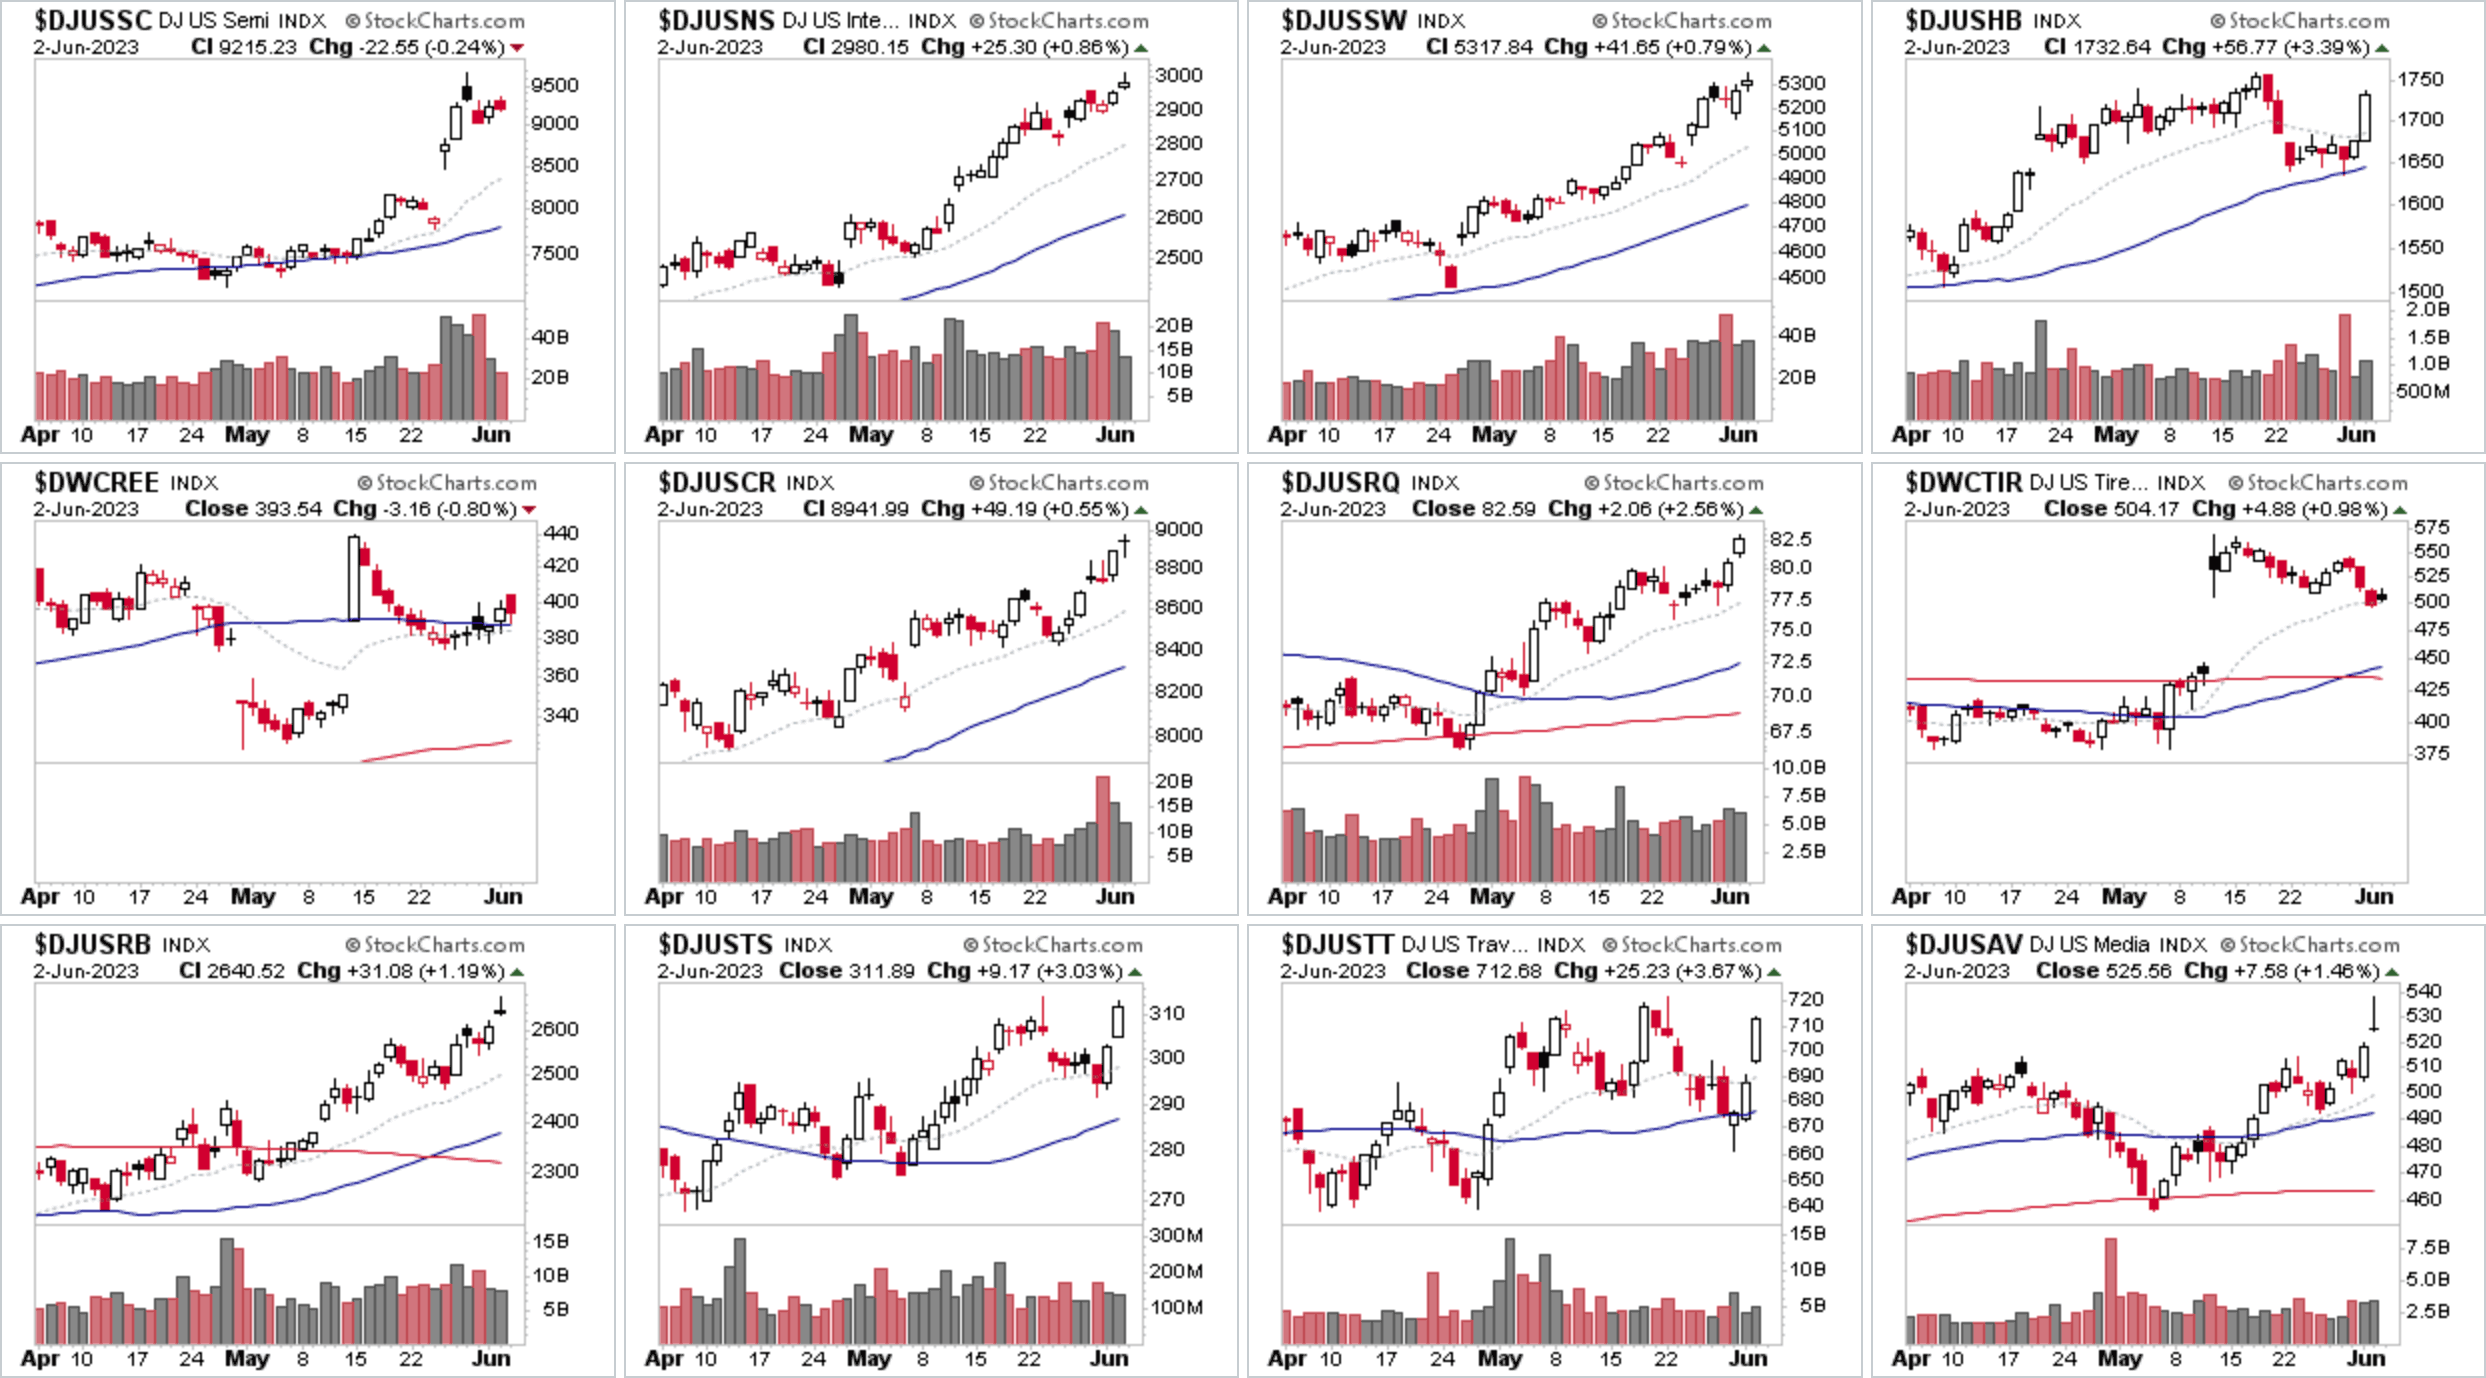
The top of the Industry Group Relative Strength Rankings remains unchanged this week with Semiconductors $DJUSSC and Internet $DJUSNS holding onto their positions with a consolidation week for both groups. Software $DJUSSW gained a further +1 RS point to move into third place overall and stocks from the group continue to consistently be a feature in the watchlist in 2023.
One of 2023's most consistent leading groups, Home Construction $DJUSHB moved up to 4th overall. Which also featured again in Thursdays watchlist and the group finished the week strong with +3% to 5% moves in the majority of the stocks in the group on Friday. Plus the short-term moving average breadth (percentage of stocks above their 21 day EMA) in the group expanded from 47% on Thursday to 81% on Friday. So more than three quarters of the home building stocks are back above their 21 day EMAs again (which is used as it's roughly one month, as there's 252 trading days in a year on average).
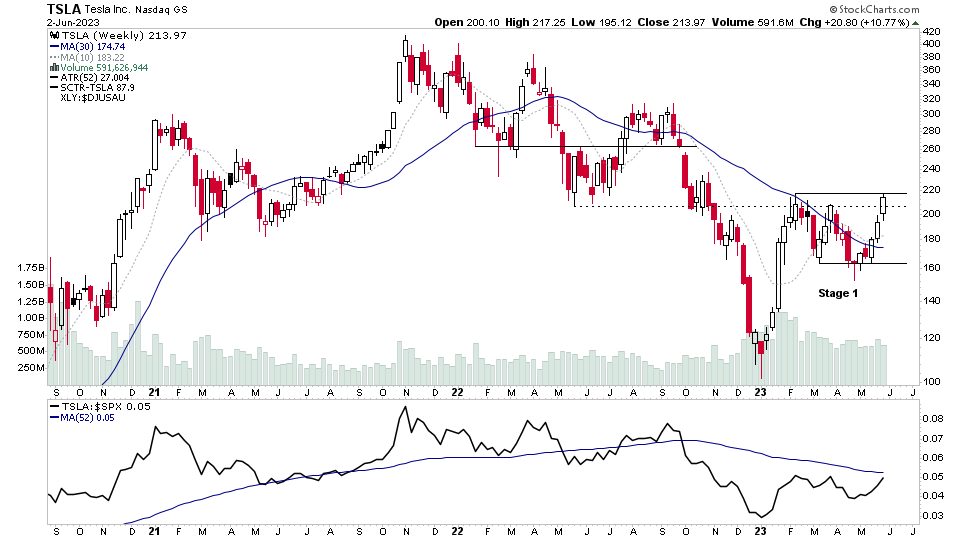
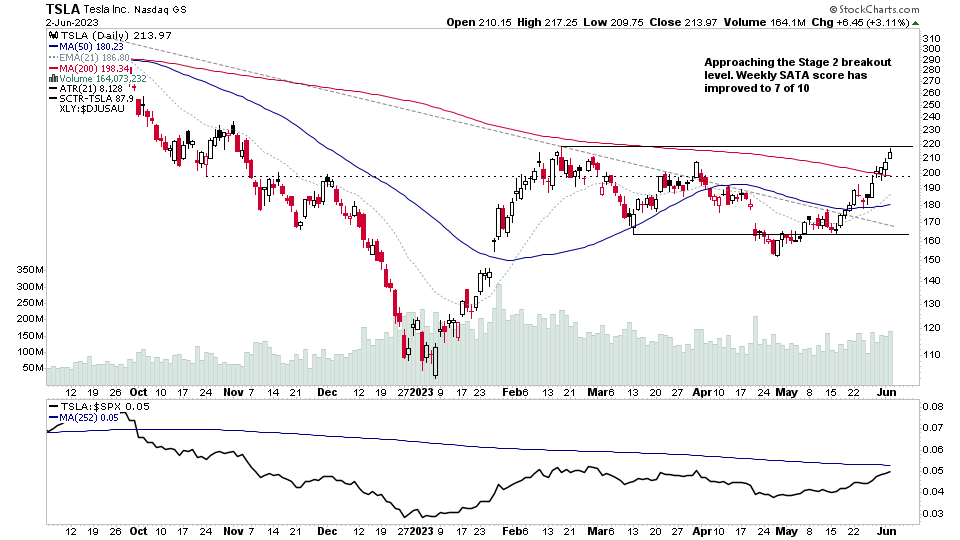
Automobiles $DJUSAU is the standout group this week however. As it's risen strongly up the RS rankings table in the recent weeks, as it was at the bottom of the rankings as recently as late April, and has now moved up to 13th position overall, driven by (excuse the pun) TSLA's advance towards the top of it's Stage 1 base structure. Which is now within reach of a potential Stage 2 breakout attempt.
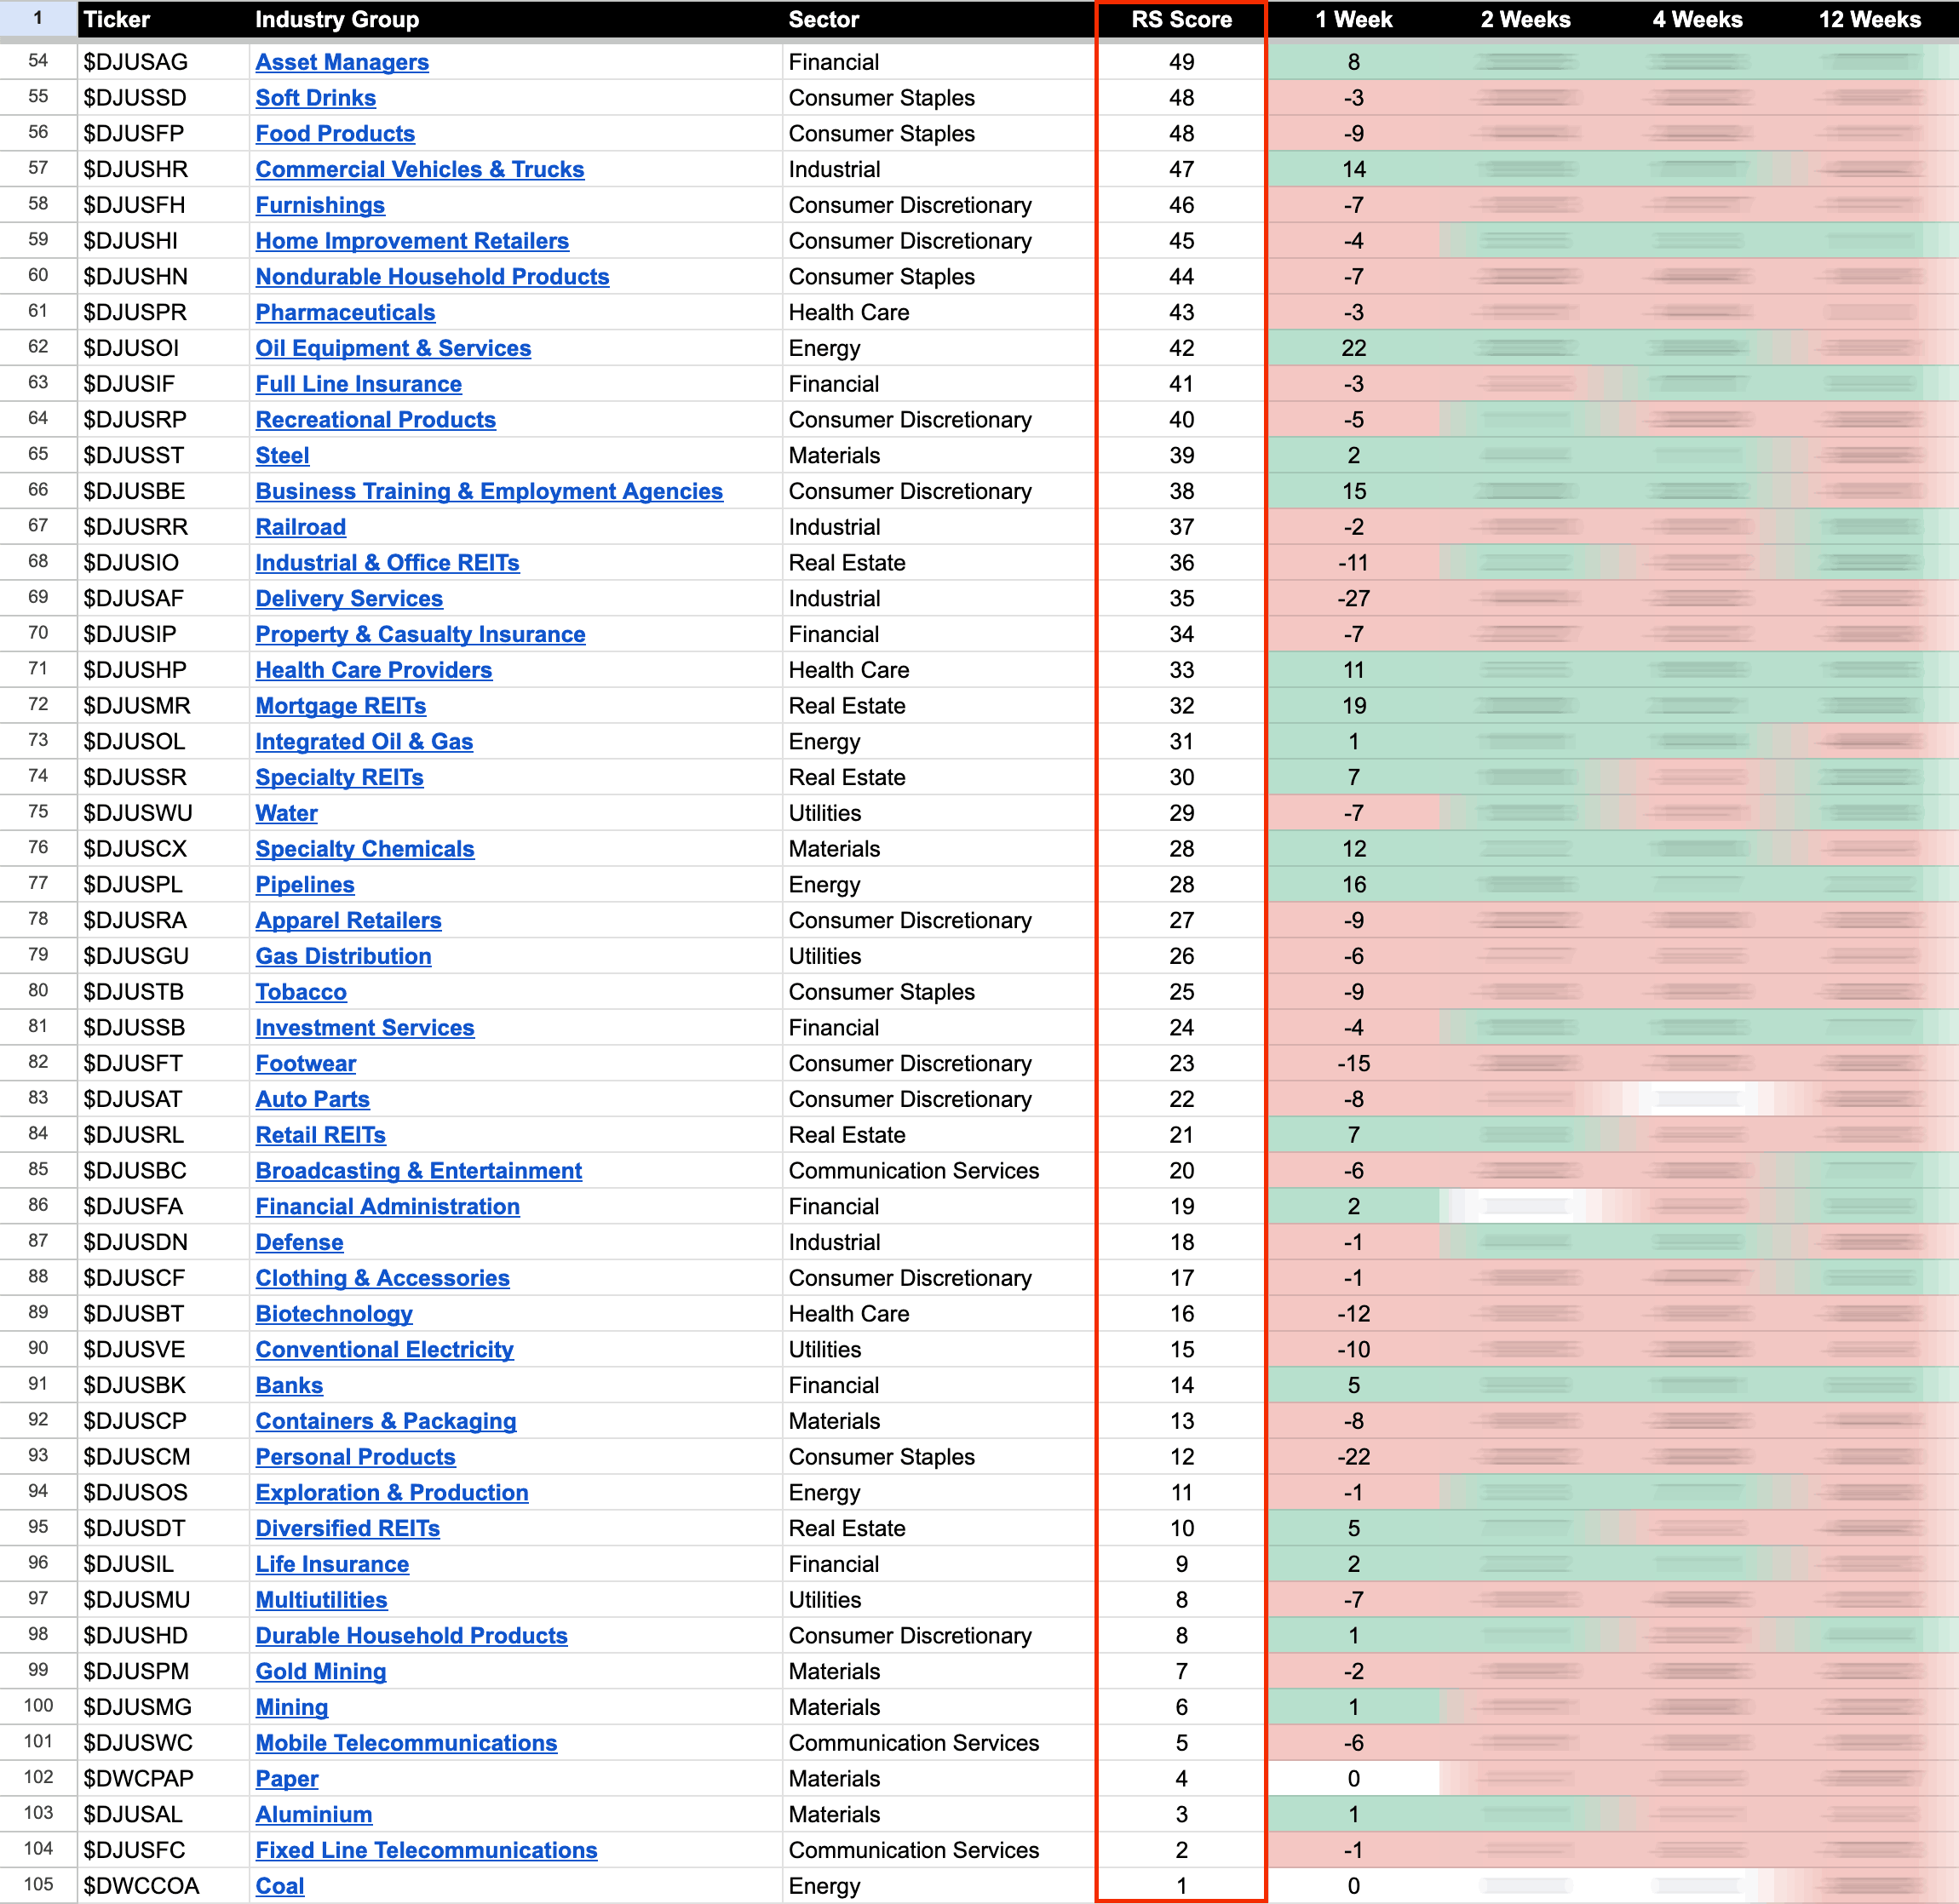
US Industry Groups by Weakest RS Score
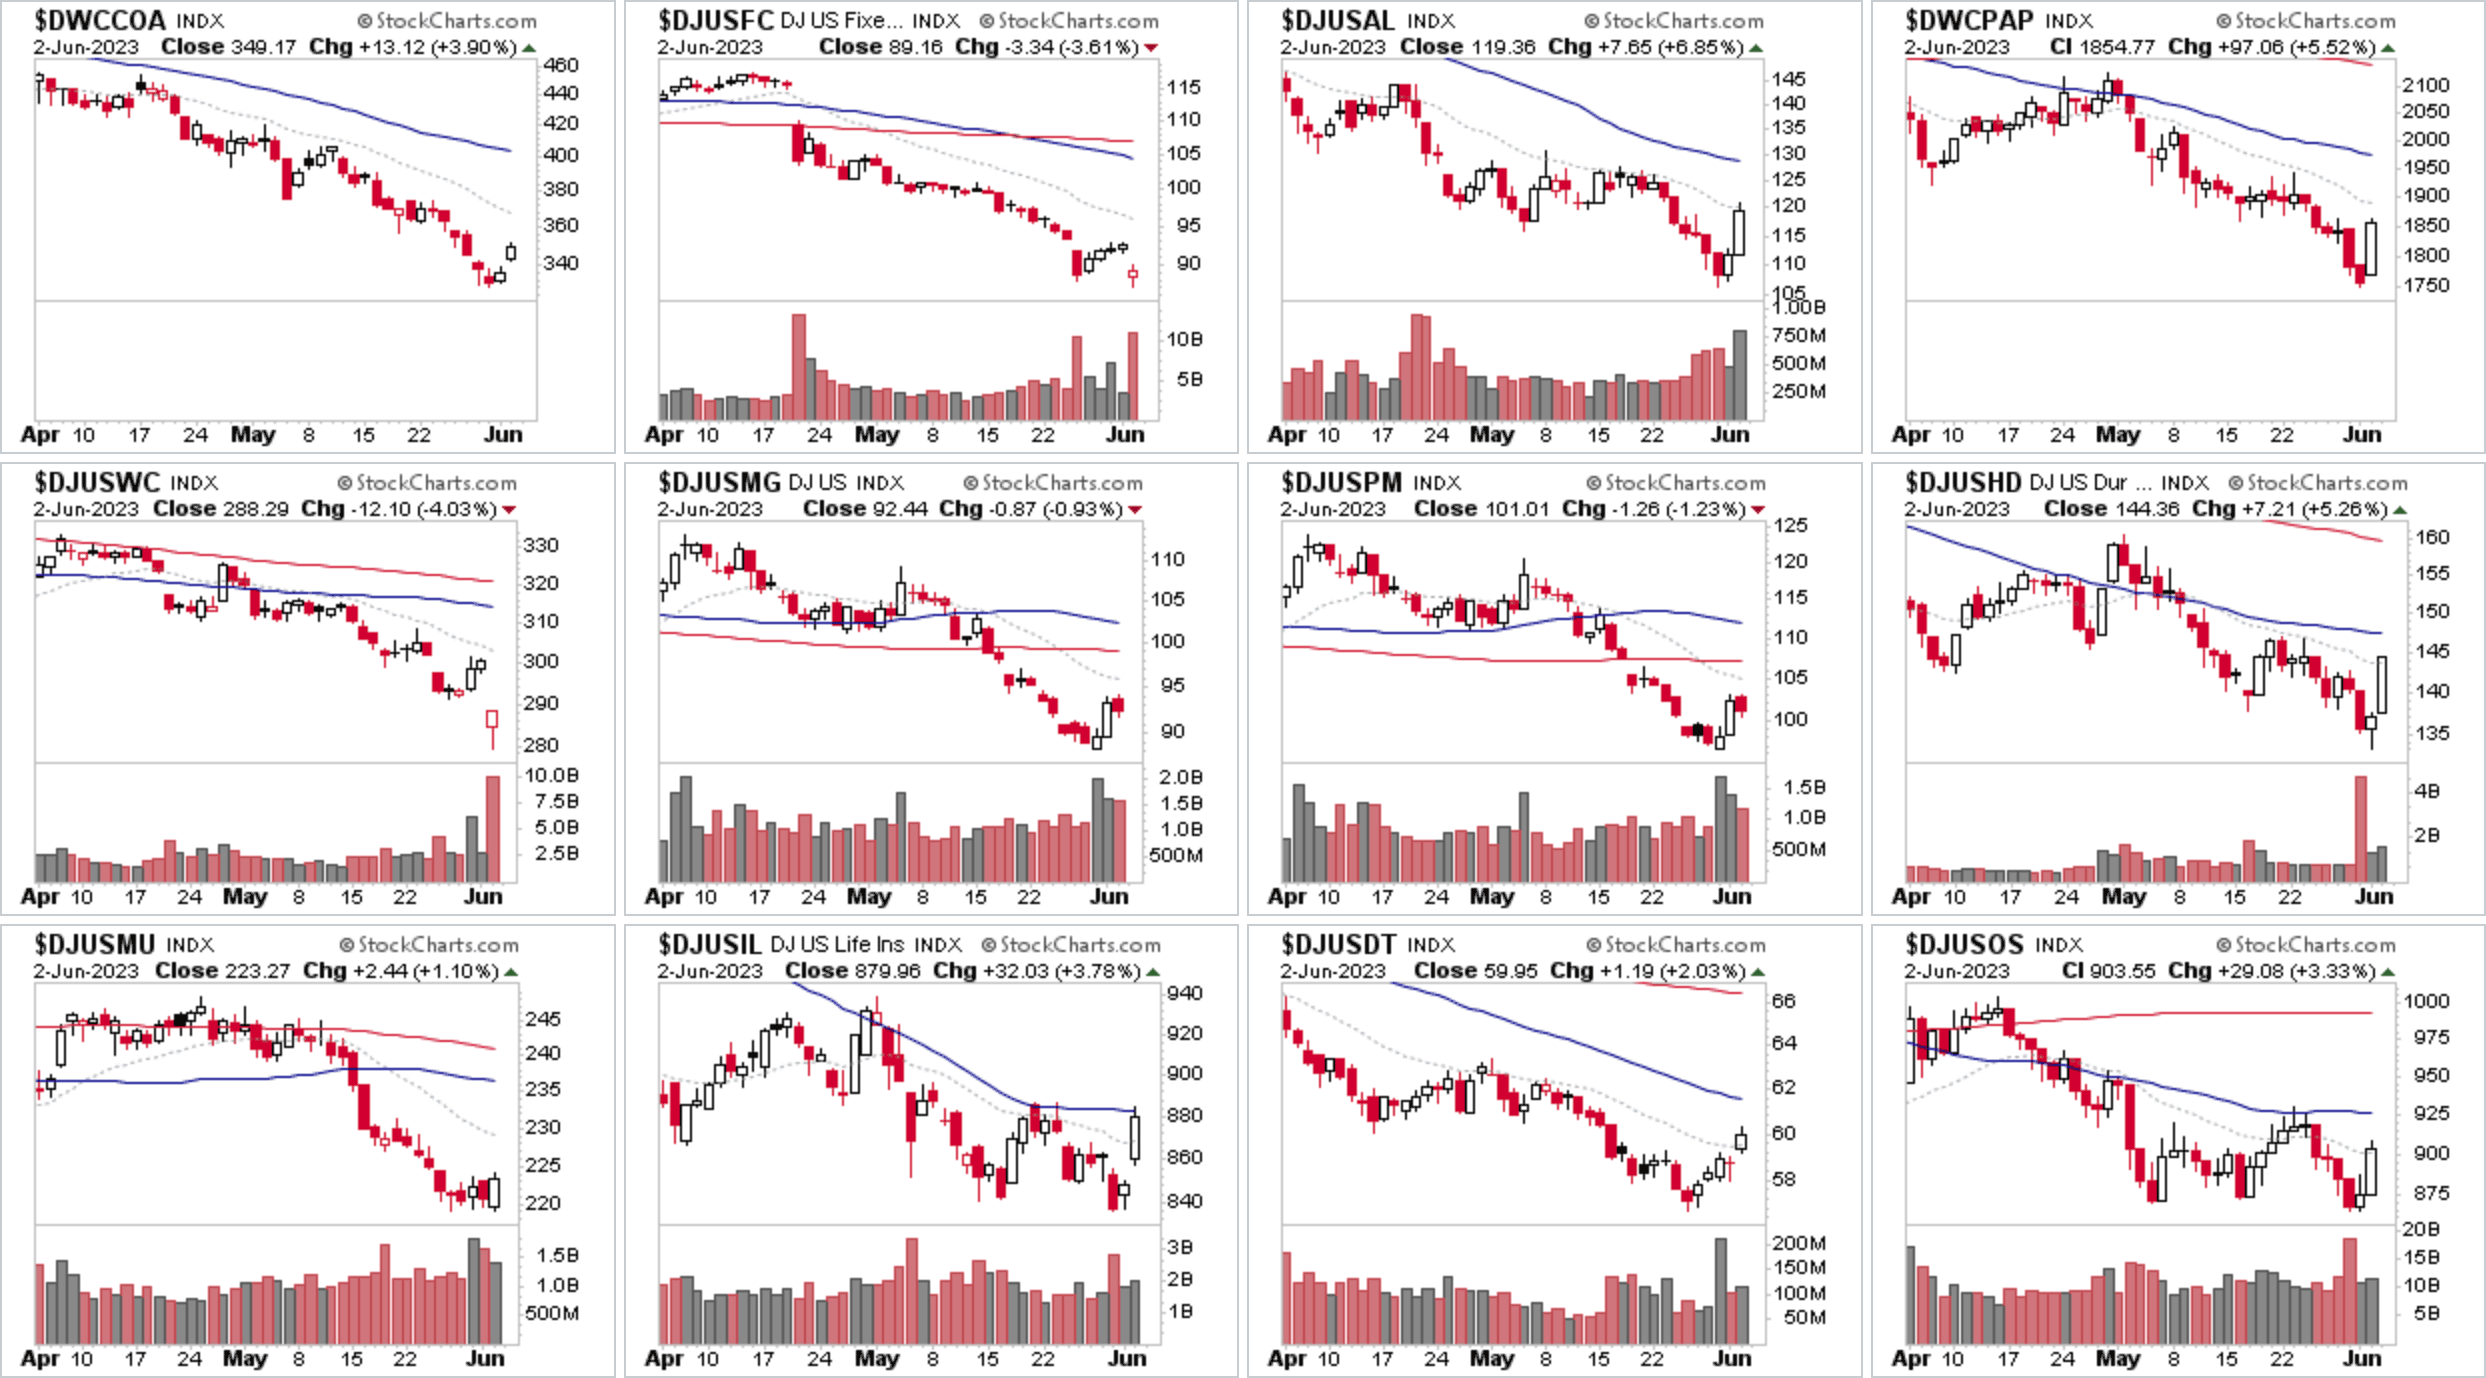
No change yet again the bottom of the RS rankings this week with Coal ($DWCCOA) making further new lows this week in its developing Stage 4 decline. However, there were notable rebounds from the lows in the weak RS stocks at the end of the week, which is a change of behaviour, and so are we seeing some rotation into the weaker groups that may lead to further short covering?
US Industry Groups sorted by Relative Strength
The purpose of the Relative Strength (RS) tables is to track the short, medium and long-term RS changes of the individual groups to find the new leadership earlier than the crowd.
RS Score of 100 is the strongest, and 0 is the weakest.
In the Stage Analysis method we are looking to focus on the strongest groups, as what is strong, tends to stay strong for a long time. But we also want to find the improving / up and coming groups that are starting to rise up strongly through the RS table from the lower zone, in order to find the future leading stocks before they break out from a Stage 1 base and move into a Stage 2 advancing phase.
Each week I go through the most interesting groups on the move in more detail during the Stage Analysis Members weekend video – as Industry Group analysis is a key part of Stan Weinstein's Stage Analysis method.
Become a Stage Analysis Member:
To see more like this and other premium content, such as the regular US Stocks watchlist, detailed videos and intraday posts, become a Stage Analysis member.
Join Today
Disclaimer: For educational purpose only. Not investment advice. Seek professional advice from a financial advisor before making any investing decisions.

