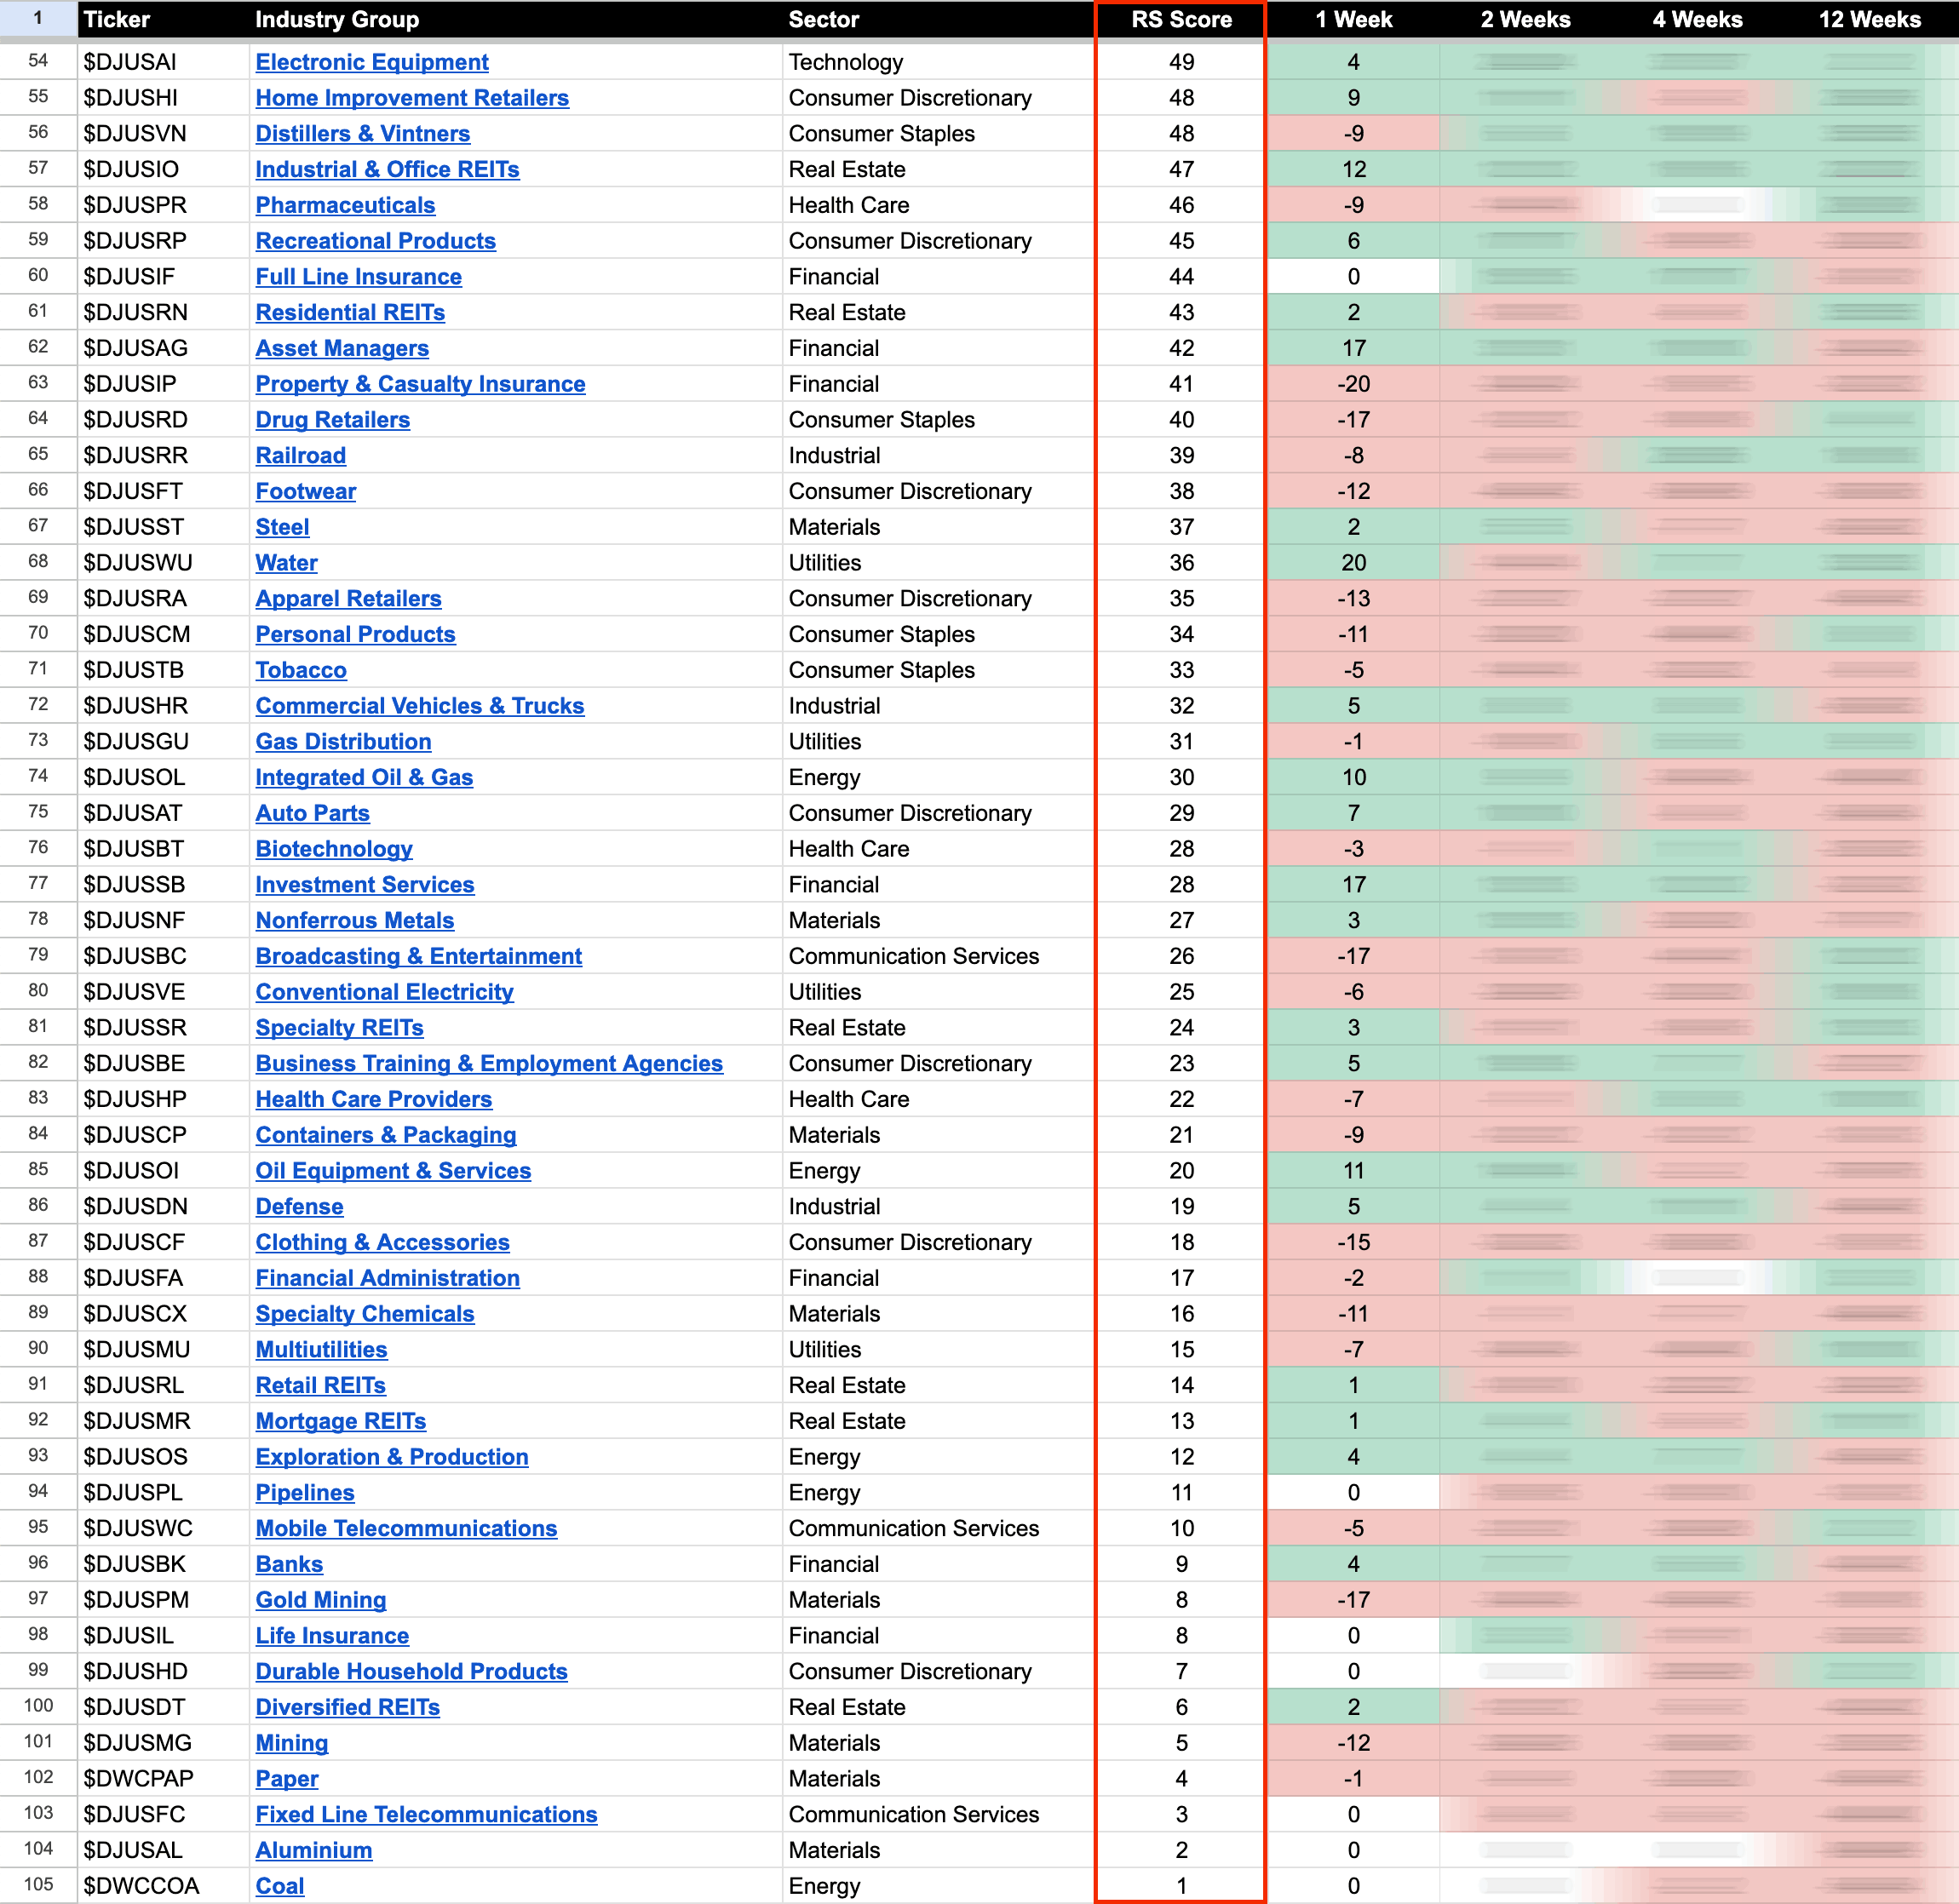
US Stocks Industry Groups Relative Strength Rankings
The full post is available to view by members only. For immediate access:
US Industry Groups by Highest RS Score
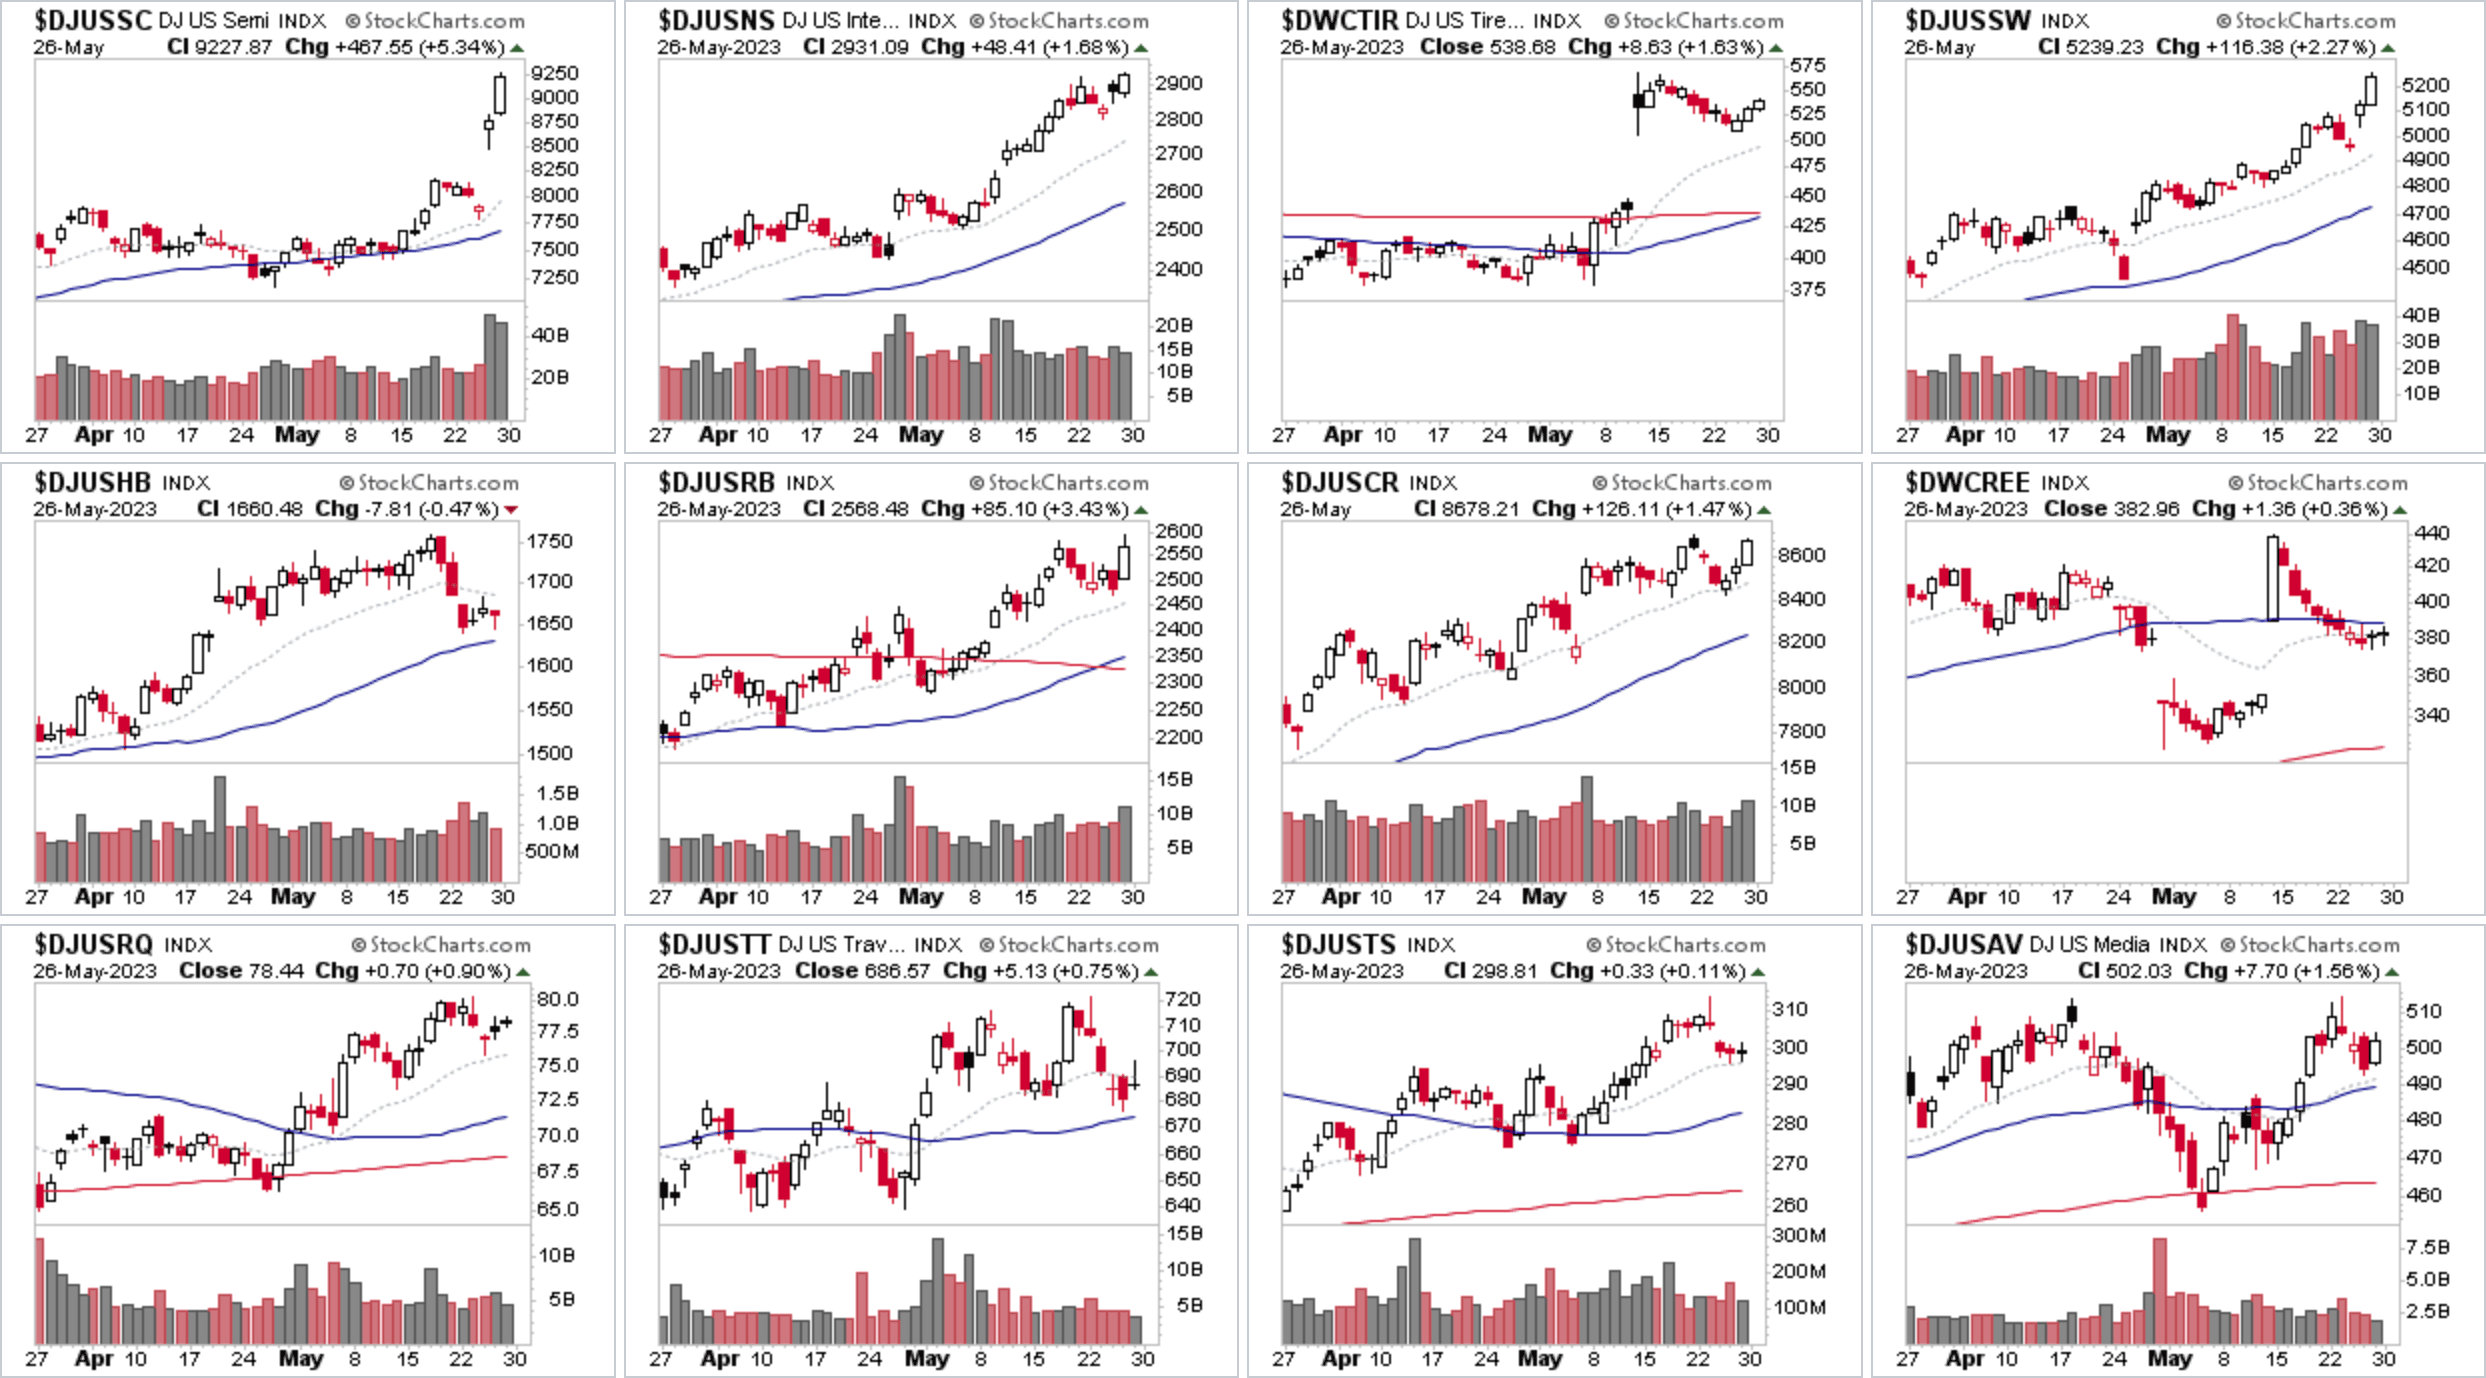
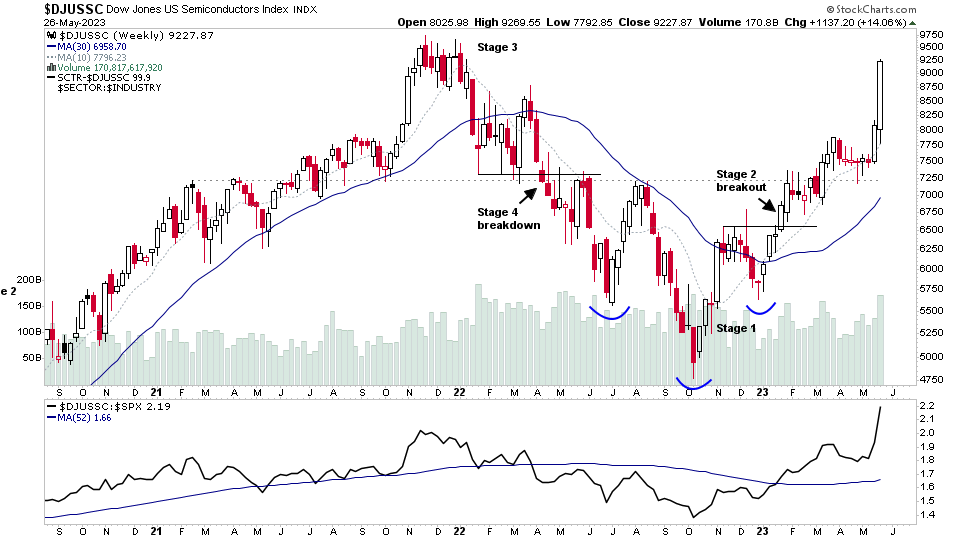
Semiconductors ($DJUSSC) continued the previous weeks strength and followed through to new 52 week highs due to NVDAs massive gap up on earnings results. Which propelled the entire group higher with huge volume coming into numerous stocks within the group, plus multiple all-time highs, and new 52 week highs. Which puts the group chart within 5.5% of it's all-time high from late 2021.
But it's also at one of the most extended points that it's been from it's normal weekly ATR range in the last 20 years, that's only been reached a few other times. So from a Stage Analysis point of view, it's likely many months from the next possible Trader method entry point now, as it would need to form a consolidation base of some kind to let the short to medium term MAs catch up, that doesn't show Stage 3 characteristics. i.e. negative change of behaviour, increased volatility on pullbacks etc.
From the investor method point of view, it's 18 weeks into its Stage 2 advance, short-term extended, and approaching a long-term technical level of resistance, and so congratulations if you've held it since the Stage 2 advance began in January, as it's been one of the best group Stage 2 advances of 2023 so far.
So in terms of the method, this is not a point to be getting FOMO, as it's a long way from any of the methods entry points – both investor and trader methods. So if you missed the move over the last 4 months+. Then it's a great one to study to learn the Forest to the Trees Approach, so that you catch the next major group theme at its Stage 2 breakout entry point, and not chasing it when it's at the top of the RS rankings and obvious to the crowd.
US Industry Groups by Weakest RS Score
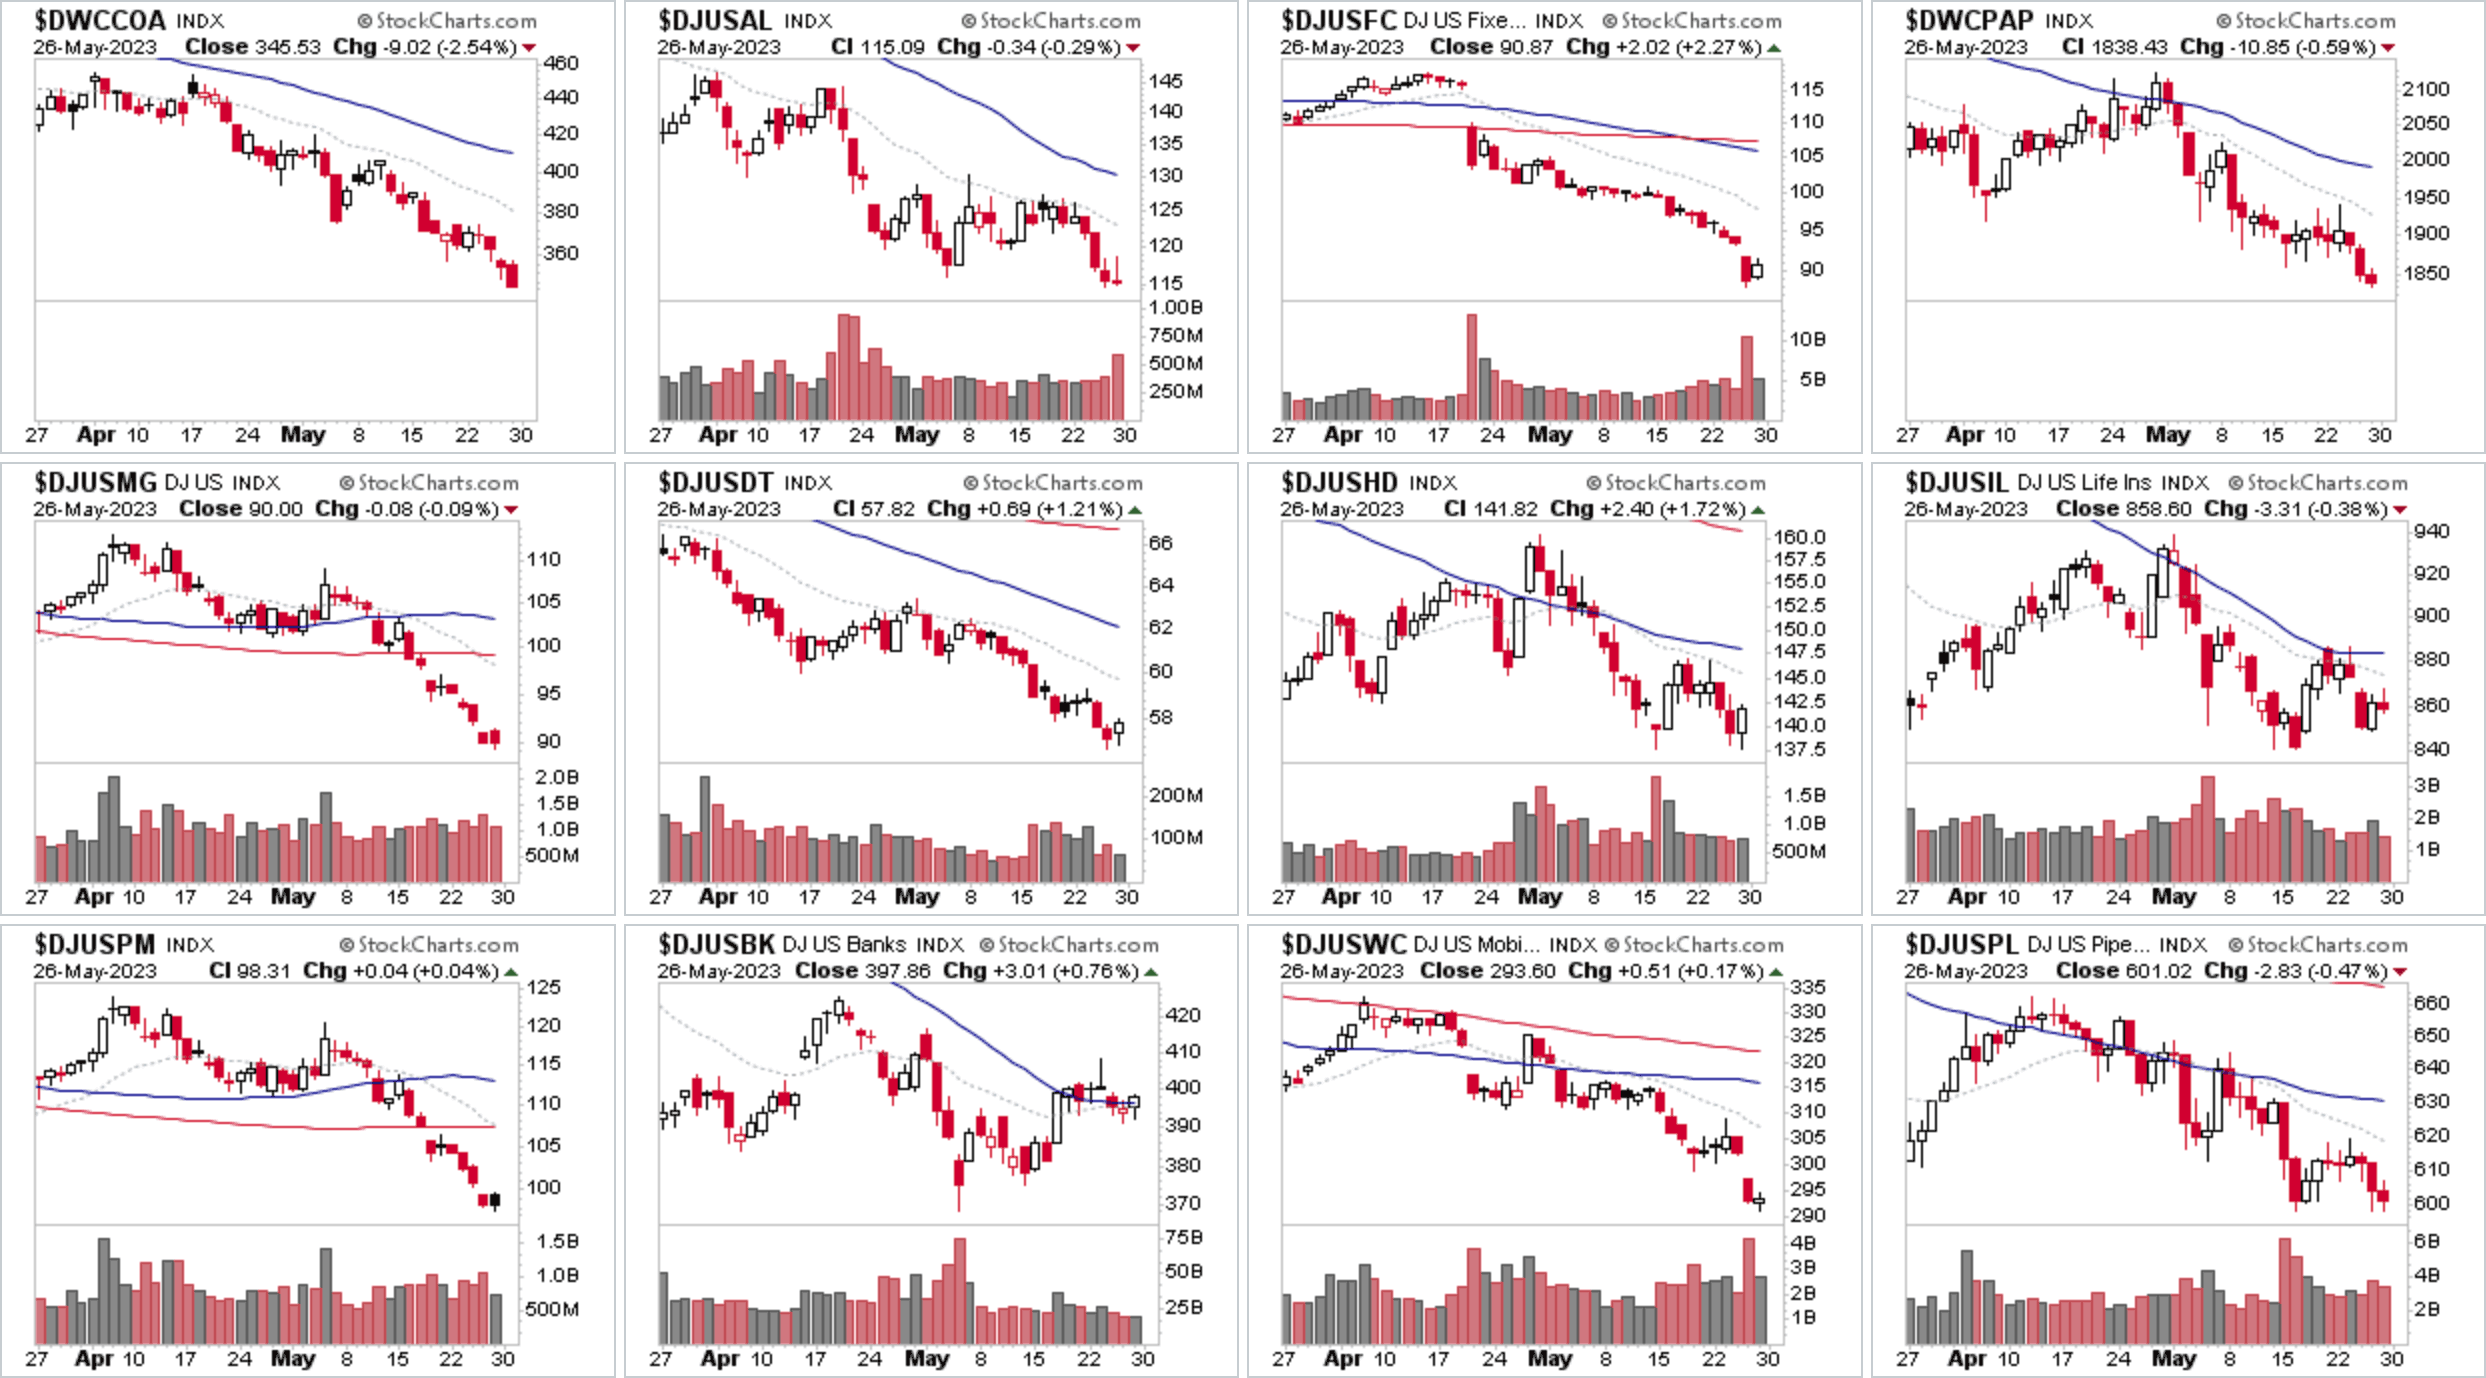
No change again the bottom of the RS rankings this week with Coal ($DWCCOA) making further new lows in its developing Stage 4 decline, with it having negative weeks in 10 of the last 12 weeks.
To learn how Stan Weinstein's Stage Analysis method was used to spot potential group weakness in the Coal group ahead of the current Stage 4 decline. See the video from late December, when it was in late Stage 3 – Group Focus: Coal Stocks in Late Stage 3 – 28 December 2022 (34mins)
US Industry Groups sorted by Relative Strength
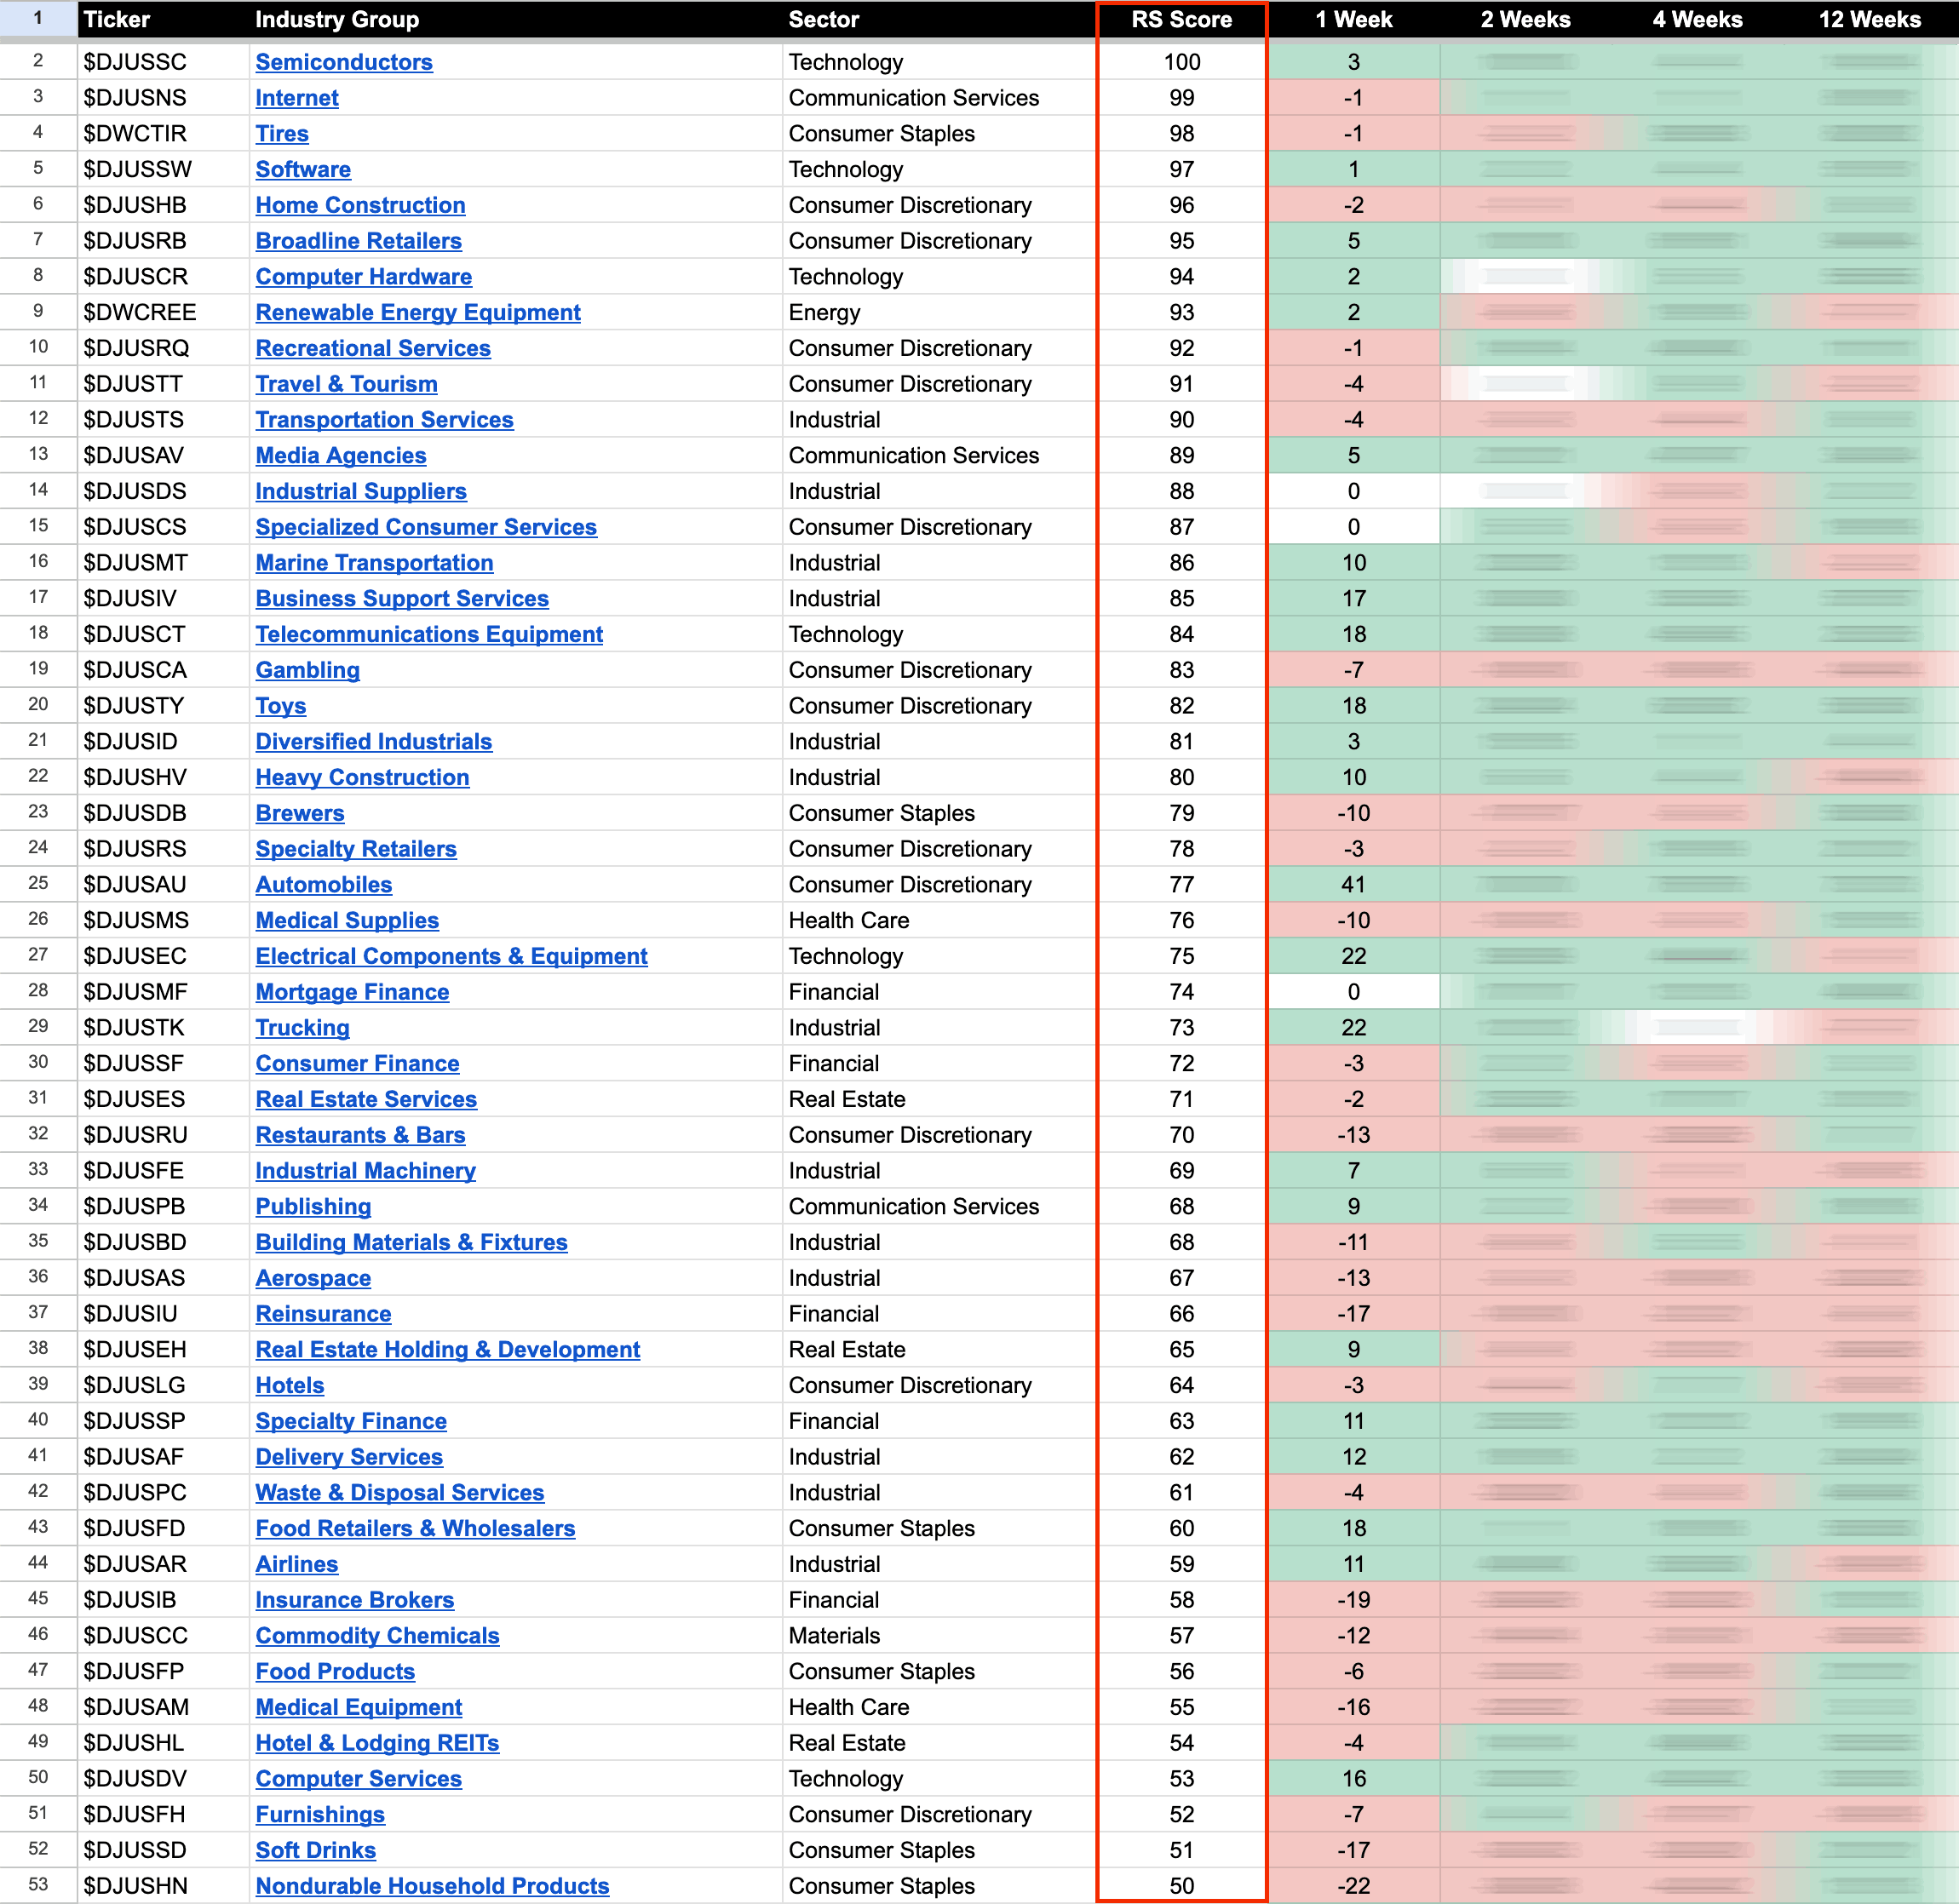
The purpose of the Relative Strength (RS) tables is to track the short, medium and long-term RS changes of the individual groups to find the new leadership earlier than the crowd.
RS Score of 100 is the strongest, and 0 is the weakest.
In the Stage Analysis method we are looking to focus on the strongest groups, as what is strong, tends to stay strong for a long time. But we also want to find the improving / up and coming groups that are starting to rise up strongly through the RS table from the lower zone, in order to find the future leading stocks before they break out from a Stage 1 base and move into a Stage 2 advancing phase.
Each week I go through the most interesting groups on the move in more detail during the Stage Analysis Members weekend video – as Industry Group analysis is a key part of Stan Weinstein's Stage Analysis method.
Become a Stage Analysis Member:
To see more like this and other premium content, such as the regular US Stocks watchlist, detailed videos and intraday posts, become a Stage Analysis member.
Join Today
Disclaimer: For educational purpose only. Not investment advice. Seek professional advice from a financial advisor before making any investing decisions.

