$OPEN Nearing the Top of the Base in Late Stage 1
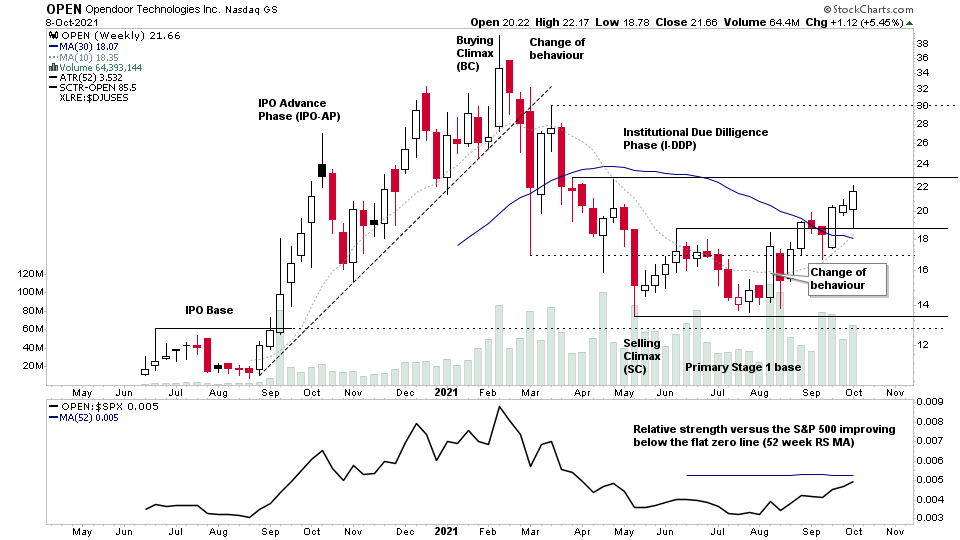
OPEN has been basing for the last seven months in what is know as the Institutional Due Diligence Phase (I-DDP) following a strong initial IPO Advance Phase (IPO-AP) from September 2020 to February 2021 of over +200%, at which point it had a change of behaviour with a sharp selloff (Shakeout / Local Selling Climax) of over -50% in three weeks.
It then trended lower for three months before having a further Selling Climax in May 2021, which formed the basis for the lower part of the primary Stage 1 base.
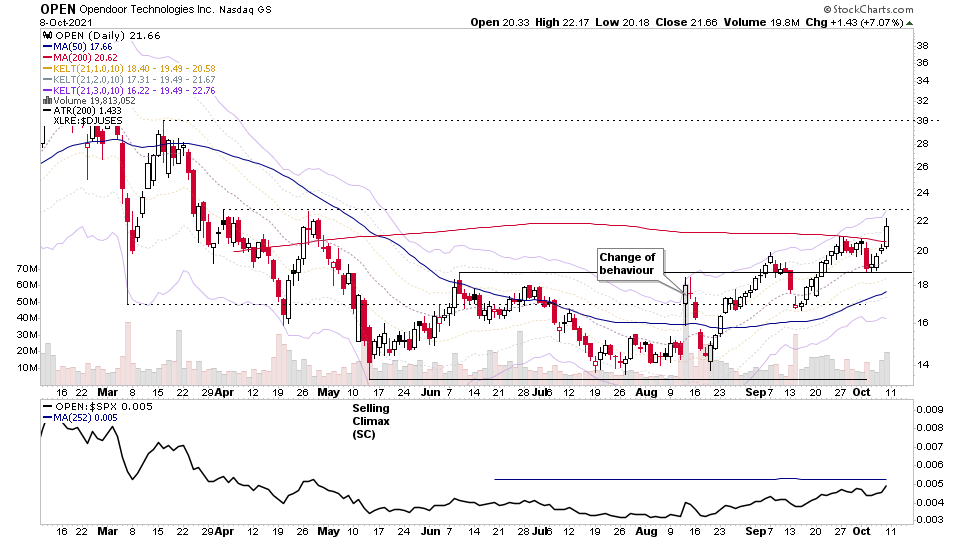
August 2021 saw a further change of behaviour with a heavy volume gap up within the Stage 1 base, which has since been followed by a series of higher lows and OPEN reclaiming the 50 day MA, and then on Friday this week, it managed to get back above the 200 day MA also. So it is potentially in Wyckoff Phase D and making a sign of strength rally out of the lower base.
Another positive is that it cleared the year to date Anchored VWAP this week which is currently at 20.20 and relative strength versus the S&P 500 is improving under a flattening Zero Line (52 week RS MA).
So I am watching for a potential Stage 2 breakout attempt in OPEN.
OPEN Stock Point & Figure Horizontal Price Target (Wyckoff method)
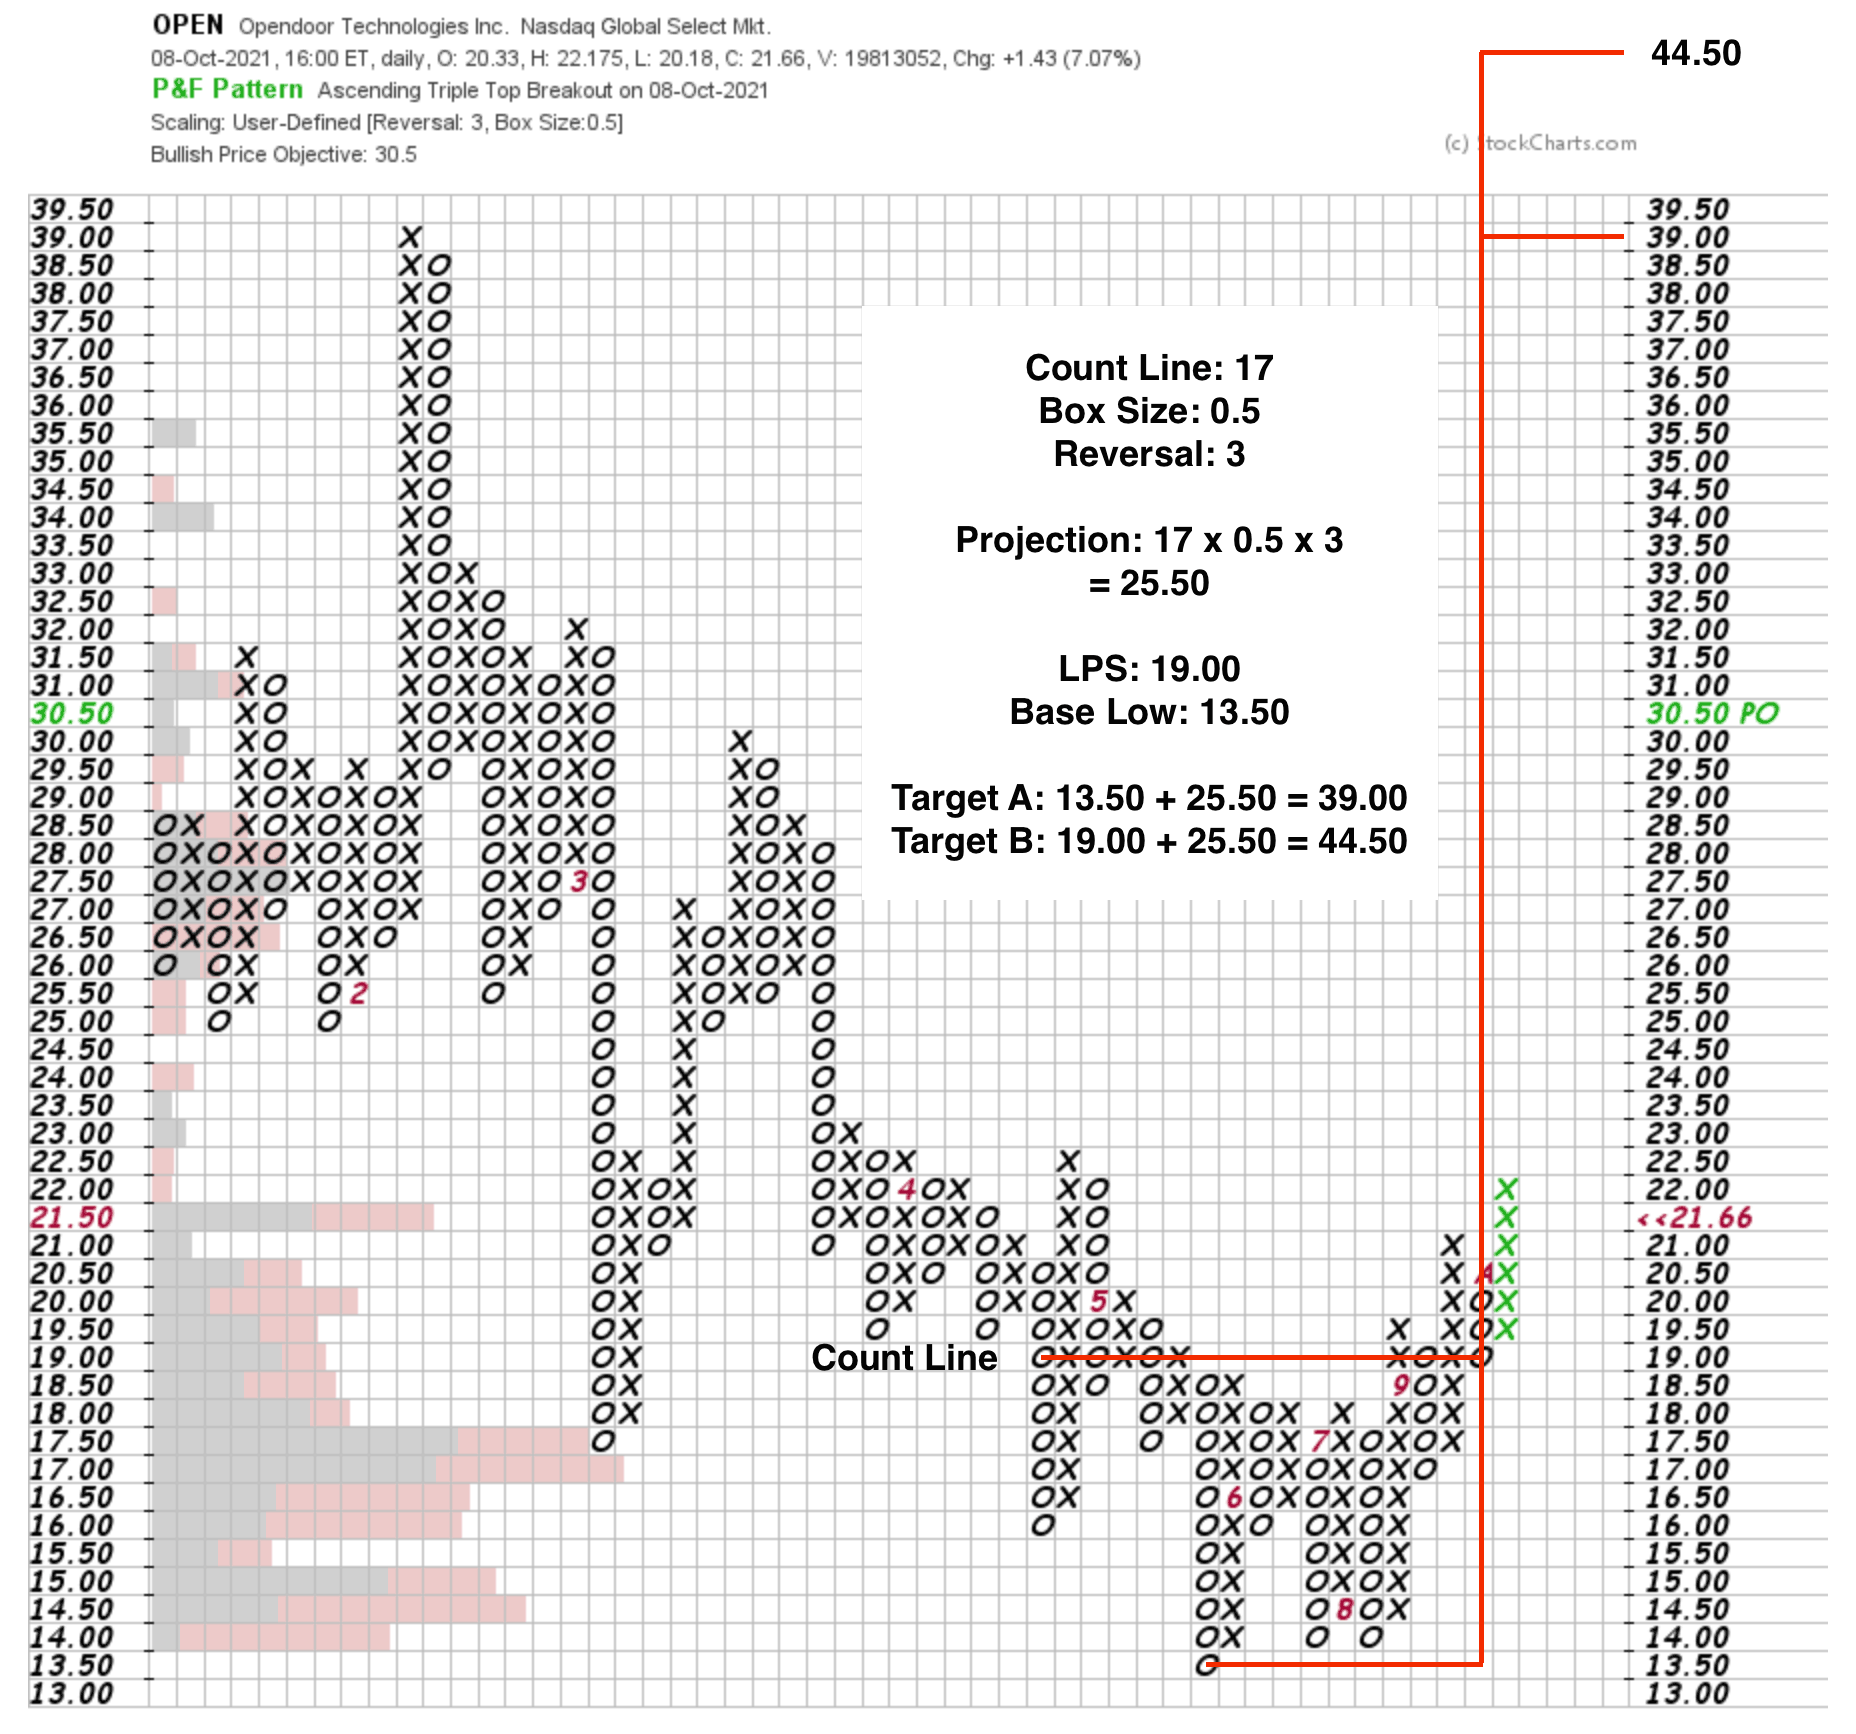
The Wyckoff method P&F horizontal count line is 17 columns with a 0.5 box size by 3 reversal chart. Which added onto the Base Low at 13.5 and the Last Point of Support (LPS) at 19, gives a target range of 39 to 44.5
Hence the potential Cause from the major base is around 80%+ from the current price level.*
Count Line: 17
Box Size: 0.5
Reversal: 3
Projection: 17 x 0.5 x 3 = 25.5
LPS: 19
Base Low: 13.5
Target A: 13.5 + 25.5 = 39
Target B: 19 + 25.5 = 44.5
*This is the more aggressive larger count, but you could also take smaller counts from the lower LPS to the Selling Climax for example for nearer term targets.
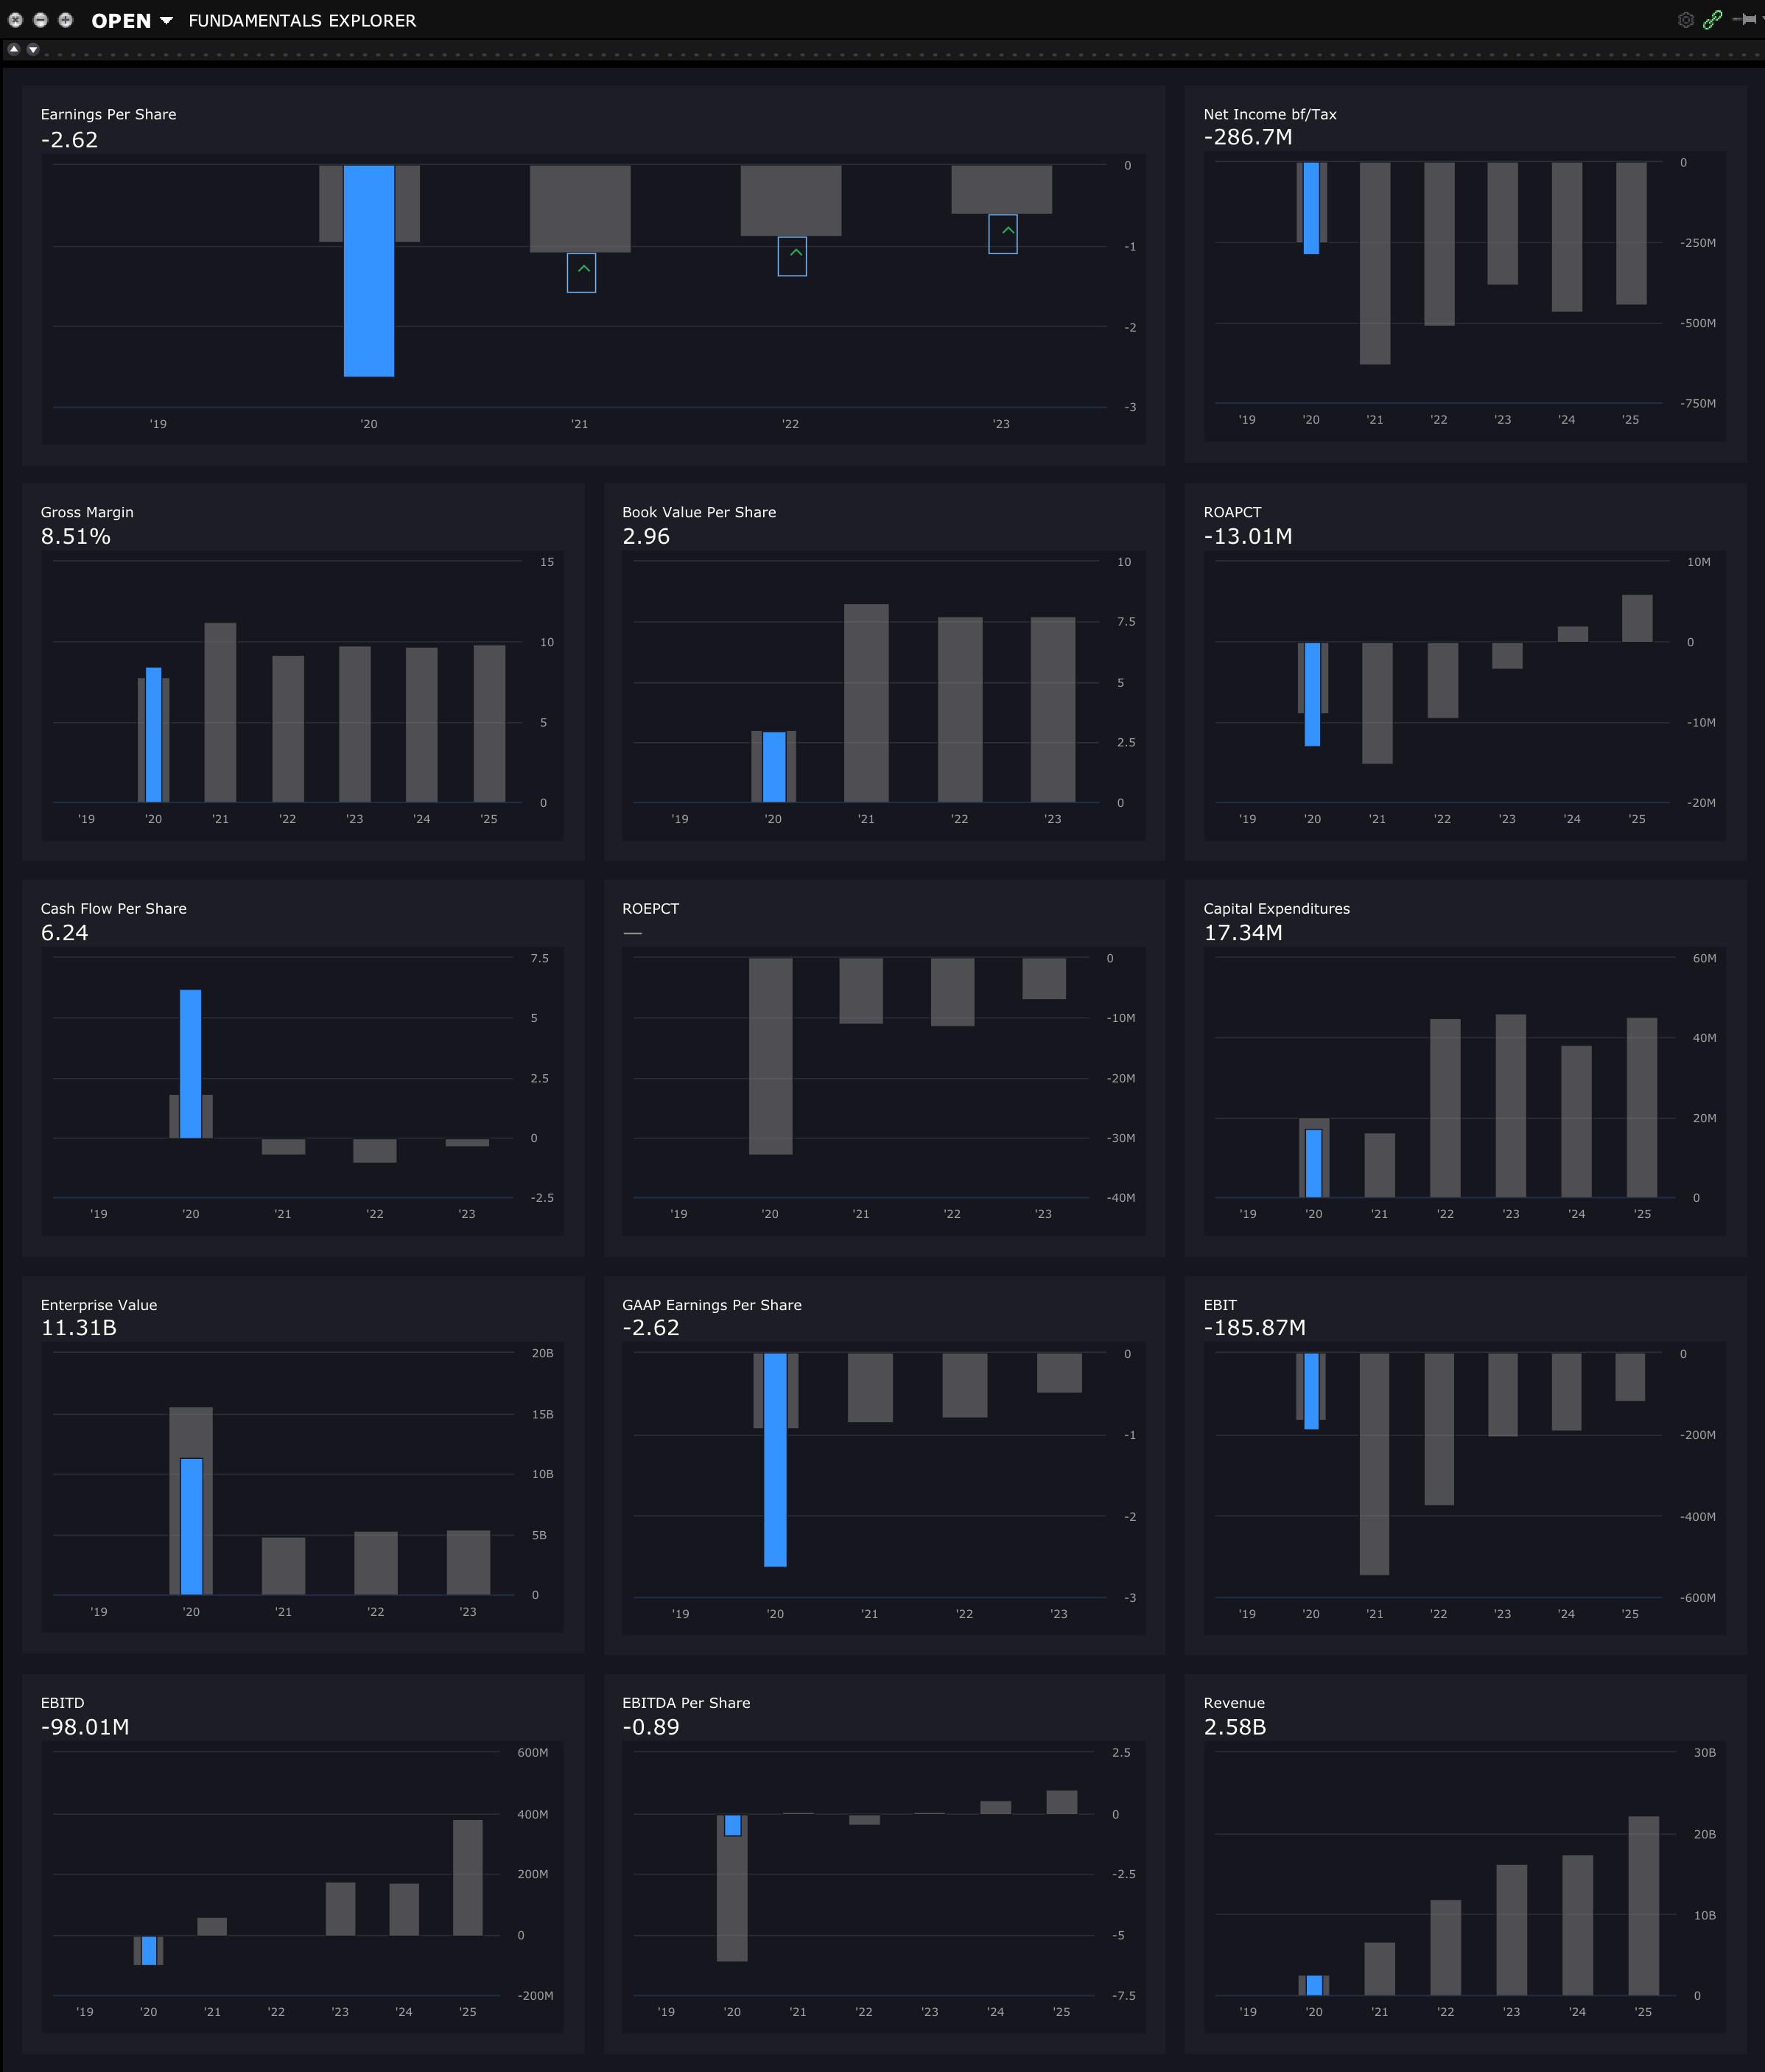
OPEN Stock Annual fundamentals + future estimates
Become a Stage Analysis Member:
To see more like this and other premium content, such as the regular US Stocks watchlist, detailed videos and intraday posts, become a Stage Analysis member.
Join Today
Disclaimer: For educational purpose only. Not investment advice. Seek professional advice from a financial advisor before making any investing decisions.


