Sector Breadth: Percentage of US Stocks Above Their 150 day (30 Week) Moving Averages
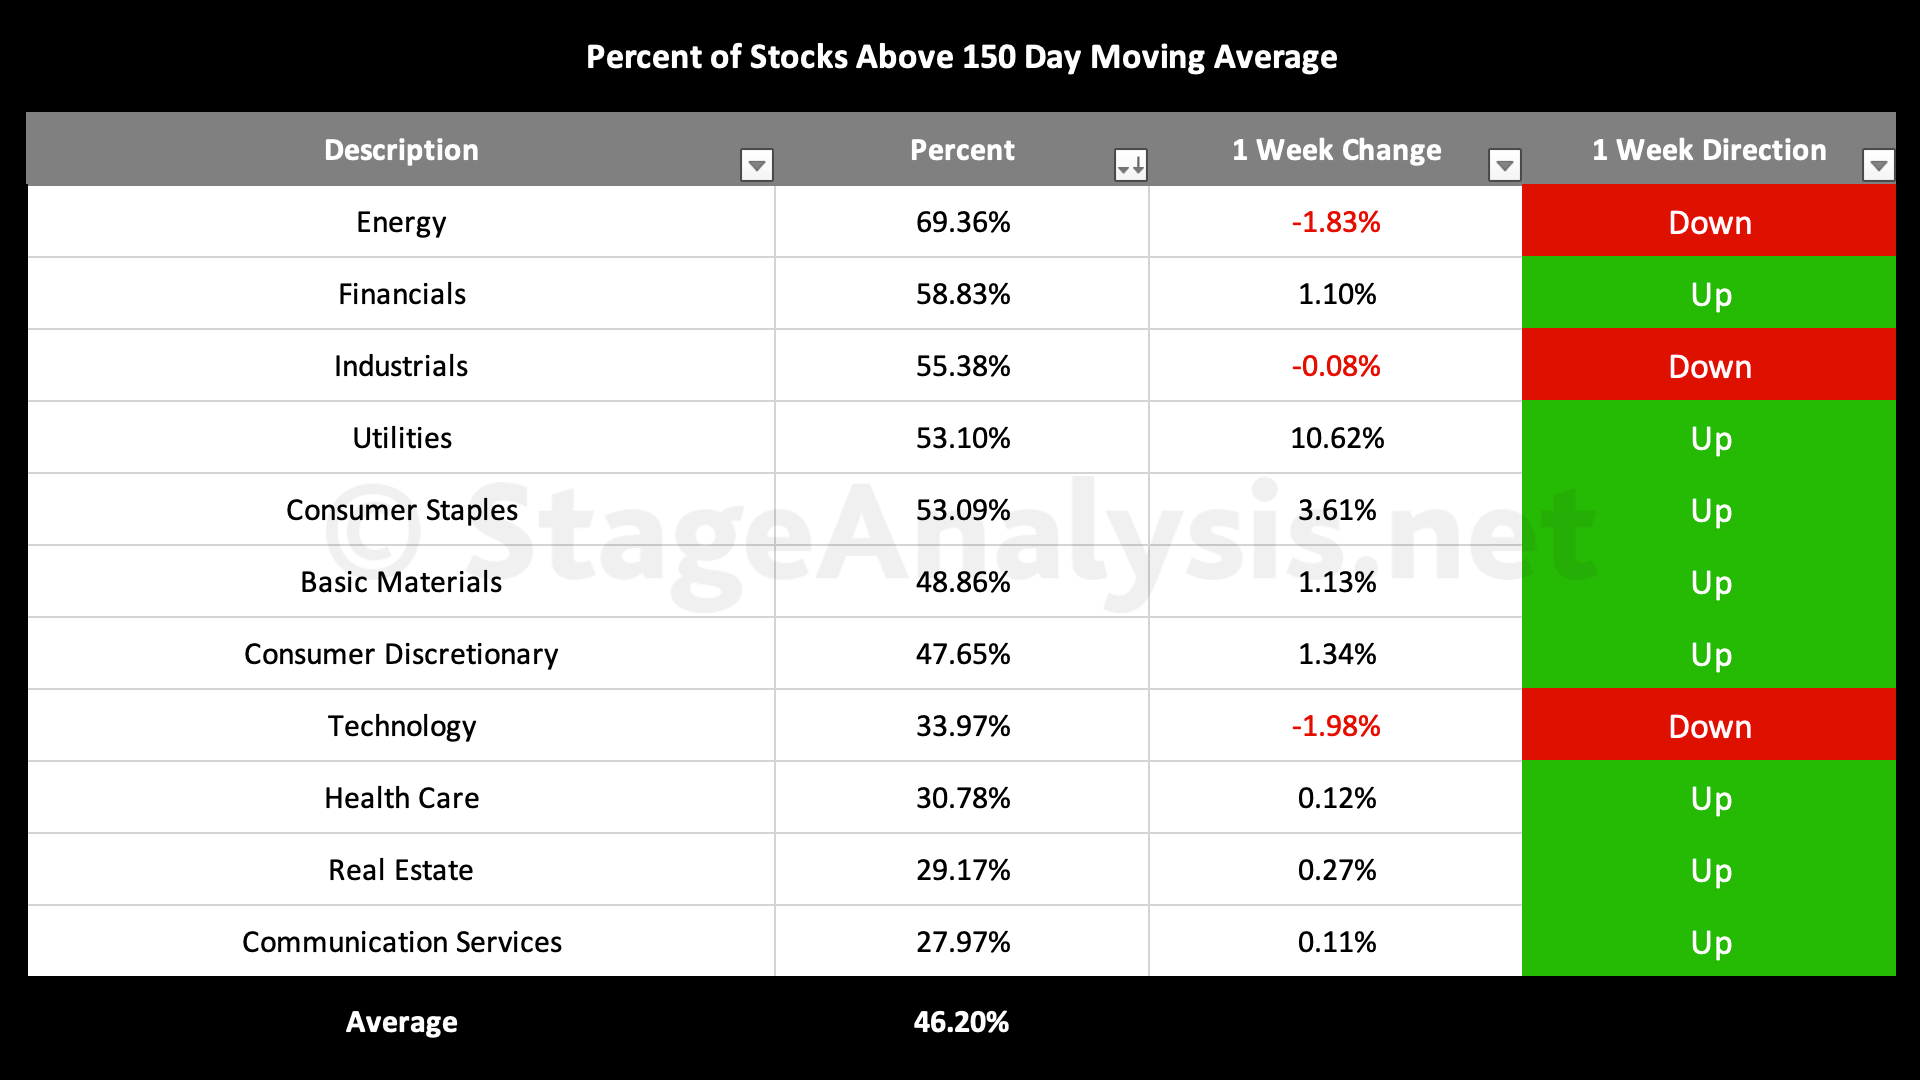
Average: 46.20% (+12.54% 2.5wks)
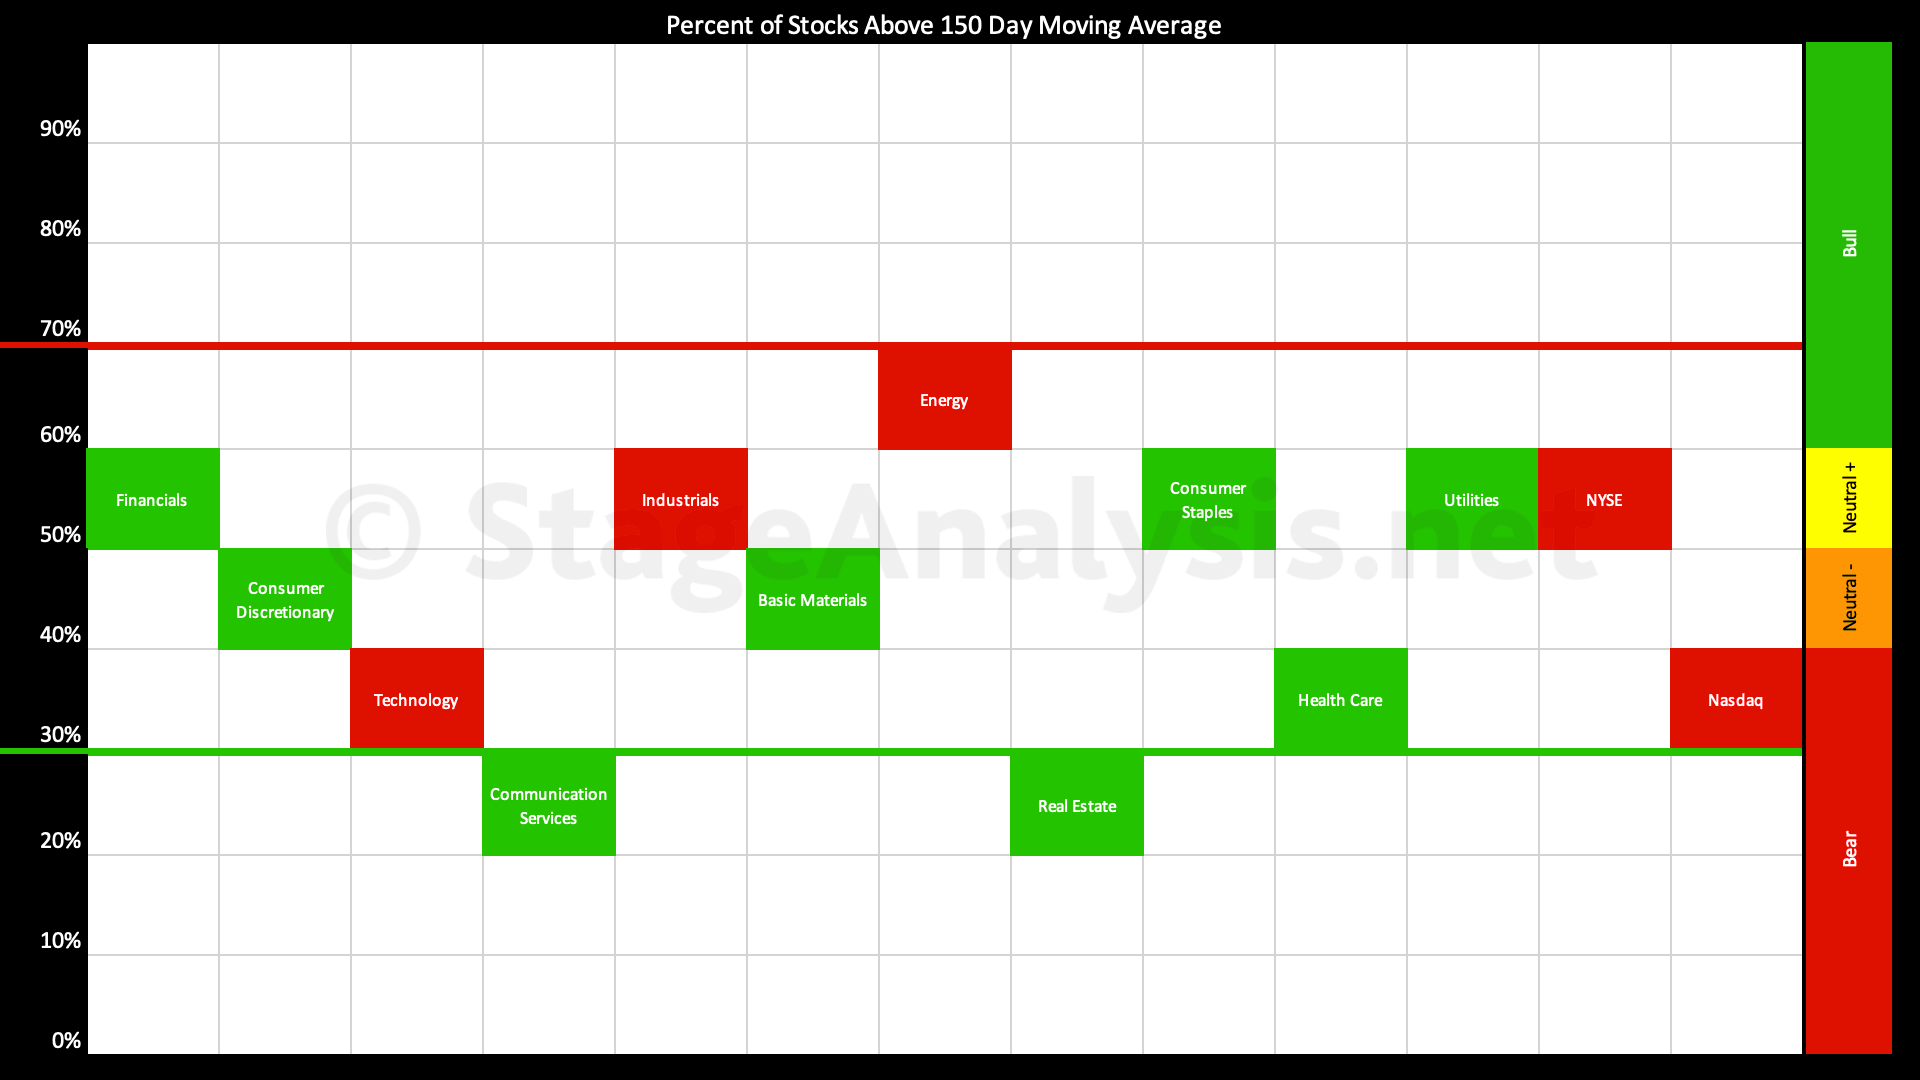
- 1 sector in the Stage 2 zone (Energy)
- 6 sectors in Stage 1 / 3 zone (Financials, Industrials, Utilities, Consumer Staples, Basic Materials, Consumer Discretionary)
- 4 sectors in Stage 4 zone (Technology, Health Care, Real Estate, Communication Services)
The Percentage of US Stocks Above Their 150 day Moving Averages in the 11 major sectors has continued to improve since my previous post on the 9th November, which was the day before the secondary Follow Through Day (FTD) in multiple of the major US stock market indexes.
The overall average stands at 46.20%, which is down slightly from Fridays close, but has still improved by +12.54% since the prior post earlier in the month, and so is currently in the Stage 1 zone (between 40% and 60%).
While there's been strong improvement in the more defensive areas of the market, it's also promising to see higher highs in the Consumer Discretionary sector breadth data, which has moved over +15% in the last few weeks into the Stage 1 zone. And Financials and Industrials have continued to improve within the Stage 1 zone, and are approaching the upper end of the range.
Overall there are four sectors in Stage 4, six sectors in Stage 1 or Stage 3, and one sector in Stage 2. Therefore the market is in the more neutral Stage 1 zone in the lower-middle of the range.
Sector Breadth Table – Ordered by Relative Strength
Sector Breadth Charts – Percentage of US Stocks Above Their 150 day (30 Week) Moving Averages (Members only)
Below is the charts for the 11 sectors that shows back to late 2018*. Which gives a very clear picture of the overall health of each sector and the market as a whole.
The full post is available to view by members only. For immediate access:
Disclaimer: For educational purpose only. Not investment advice. Seek professional advice from a financial advisor before making any investing decisions.


