US Stocks Industry Groups Relative Strength Rankings
The full post is available to view by members only. For immediate access:
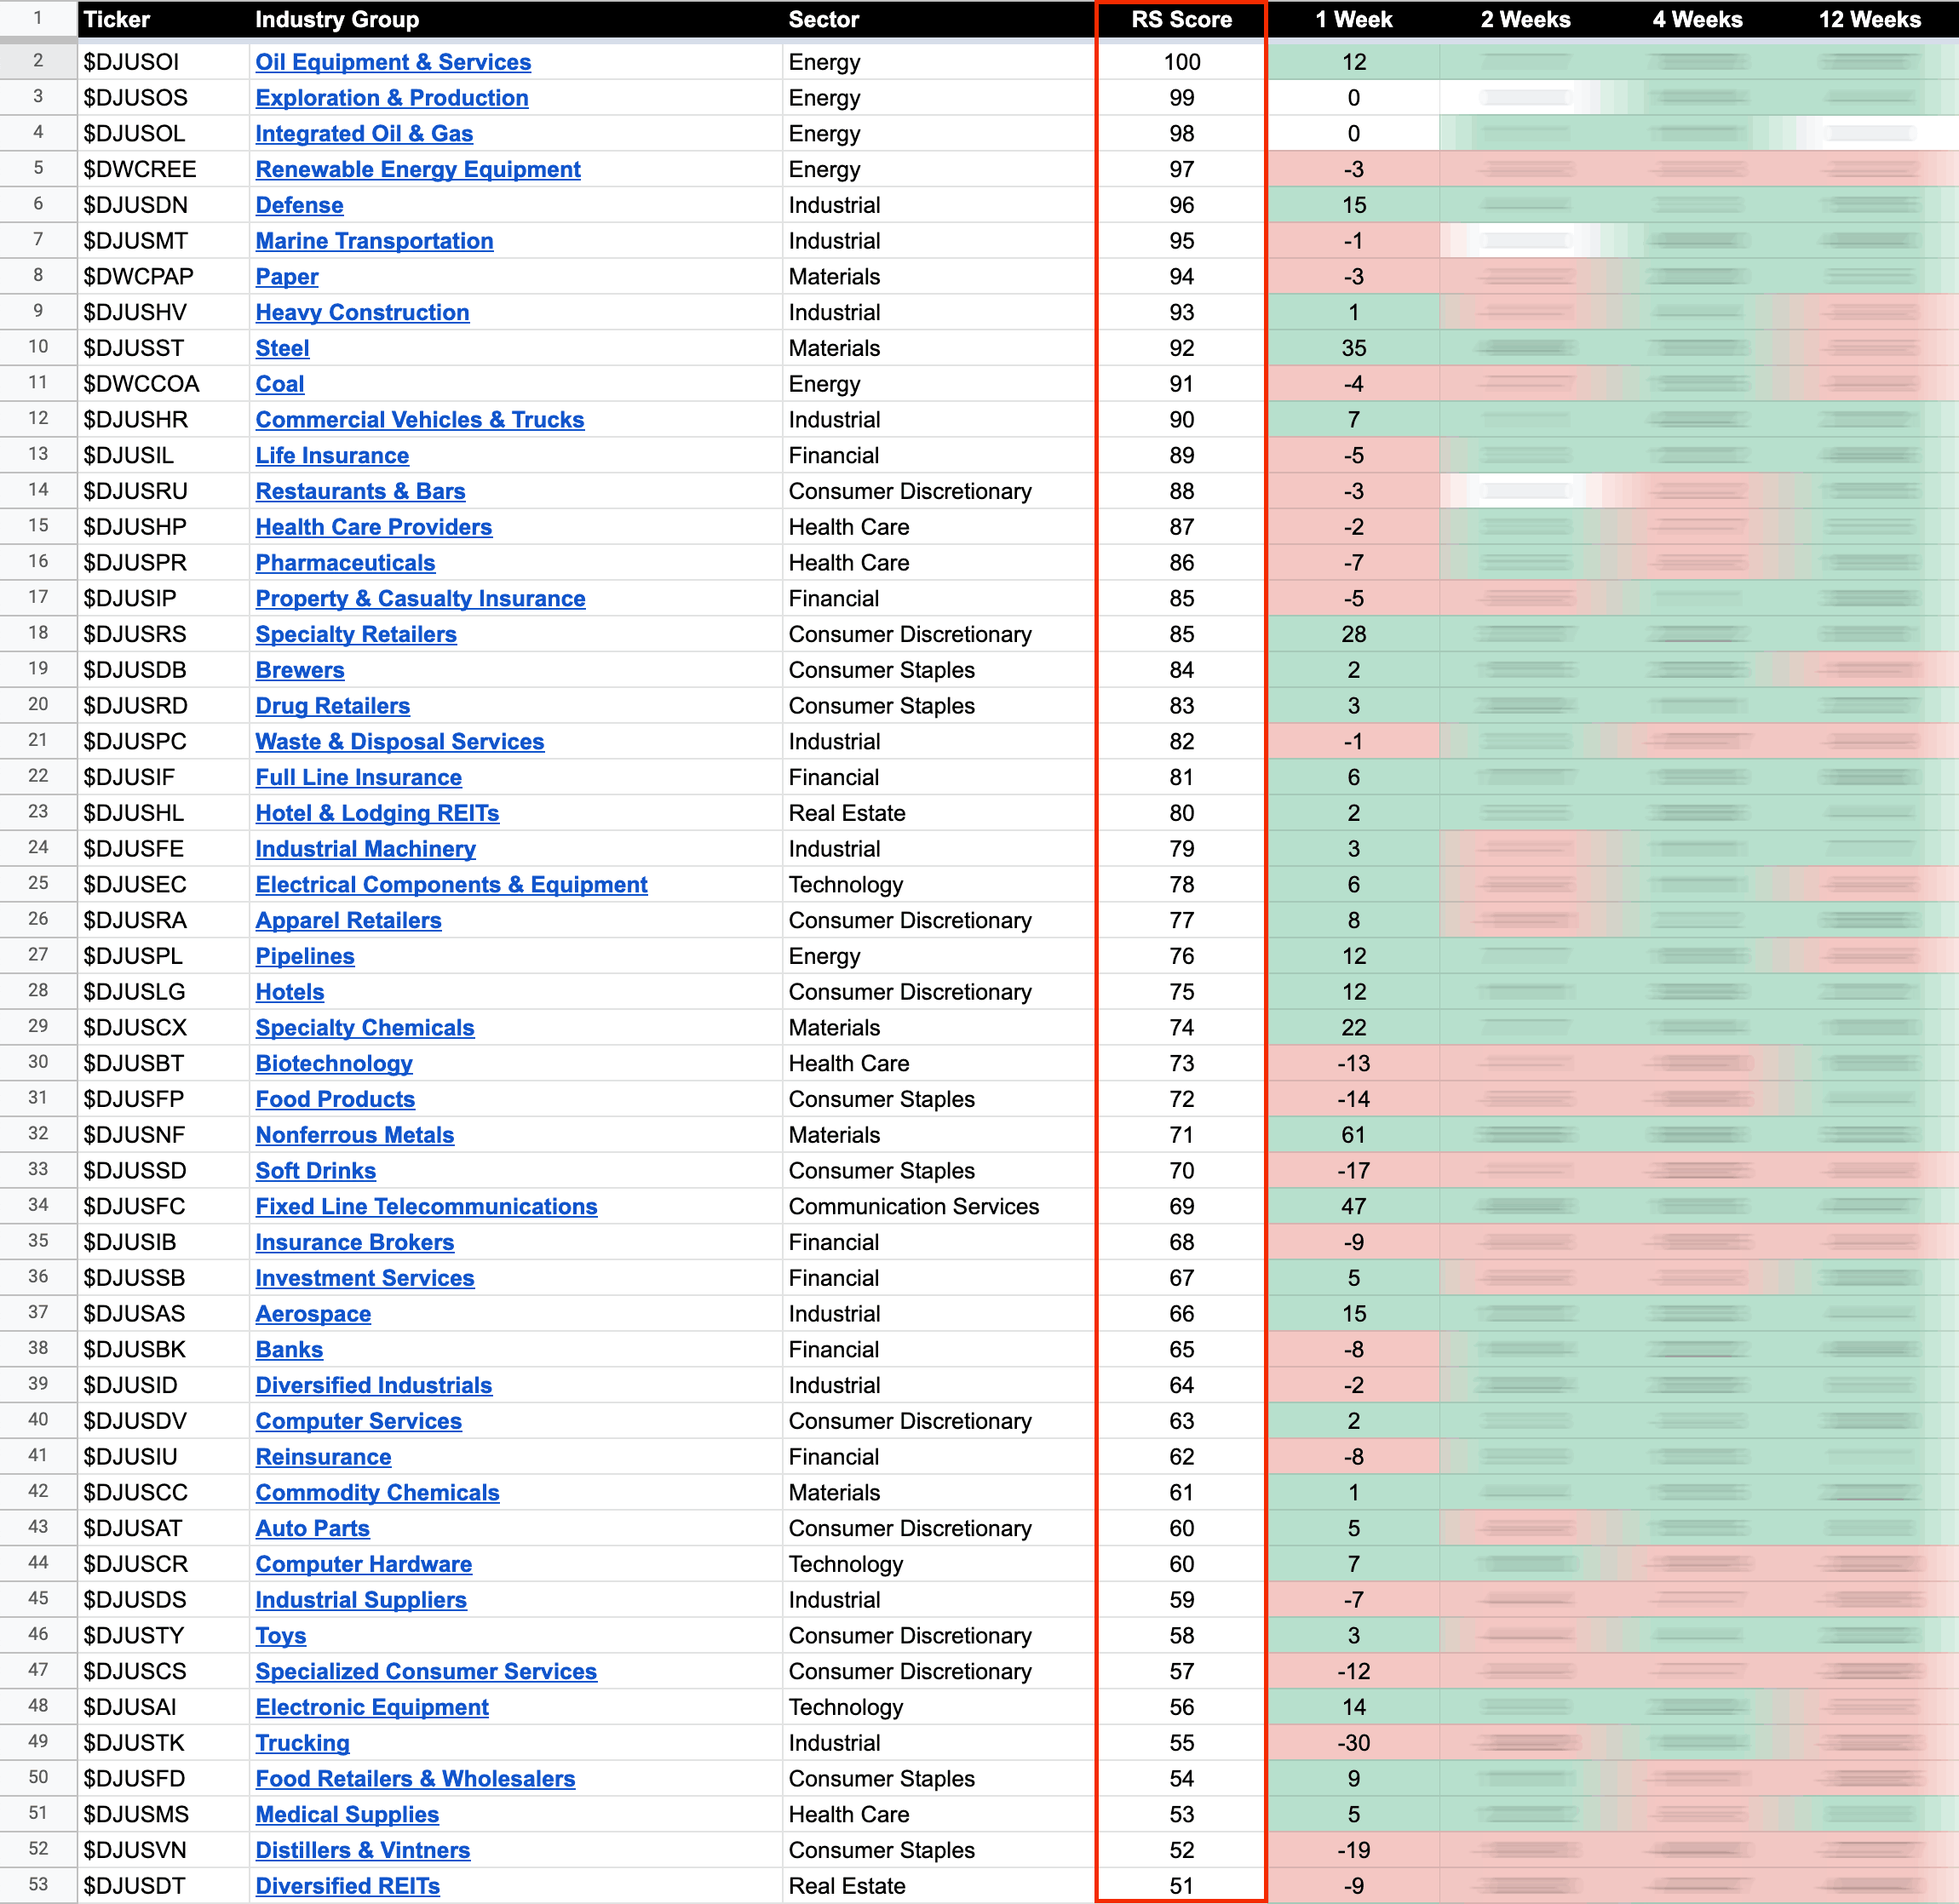
US Industry Groups by Highest RS Score
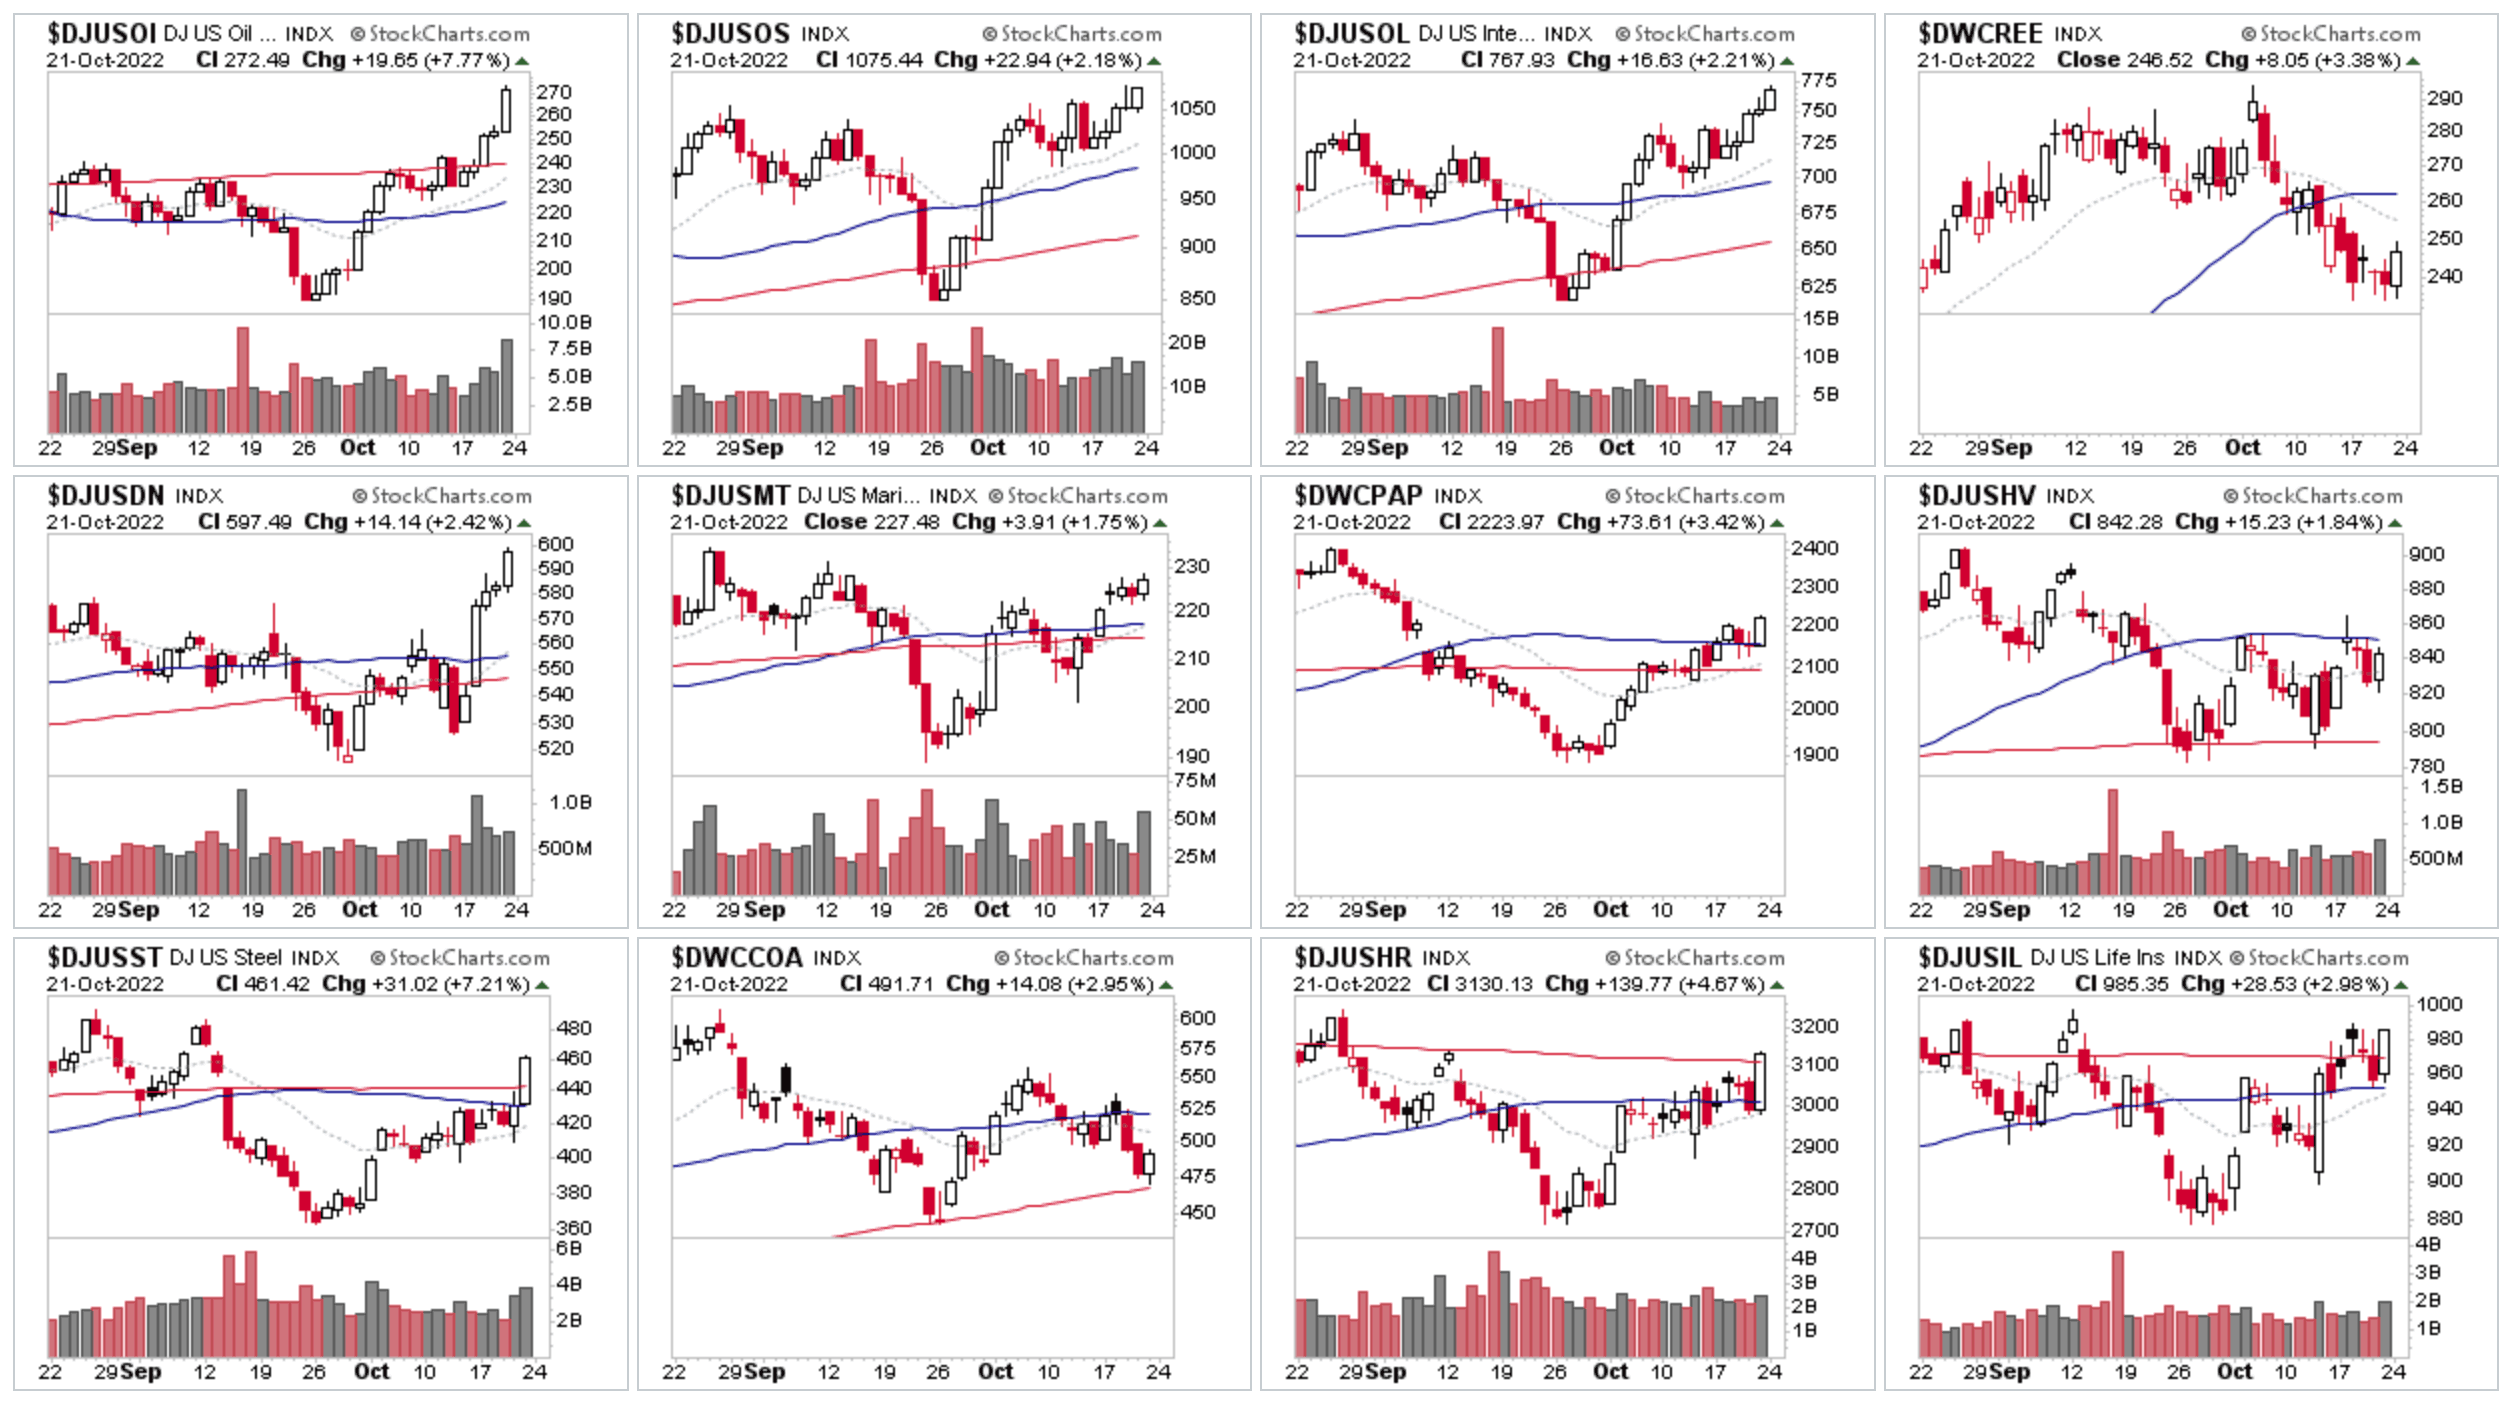
The Oil groups moved up to the top three RS positions this week, as Renewable Energy Equipment ($DWCREE) dropped to 4th, as the leading Solar stocks continued to pullback towards their recent Stage 2 breakout levels. But the leading group is now Oil Equipment & Services ($DJUSOI), which only at the end of September was attempting to make a Stage 4 breakdown. But the breakdown attempt failed and instead formed a Wyckoff Spring, and the group has since rallied over 43% in less than a month, with a large double bottom pattern on the group weekly chart and is a good example of why the Stage 4 breakdown level is considered a pivotal point, as if the breakdown attempt fails and instead forms a Spring, then the move higher can be very powerful and quickly rebound a stock or etf to new highs. But if the breakdown succeeds then the move lower can be equally swift. Hence it is an excellent potential entry point on both sides of the tape and worth studying.
There were other areas of notable relative strength this week, with Nonferrous Metals the biggest gainer (i.e. Lithium, Silver etc), as it moved up +61 RS points to 31st overall, and Steel moving +35 RS points into 9th position overall are a few examples. Plus it is good to see strong moves in multiple Technology groups and Consumer Discretionary groups as well, as they are areas that will need to strengthen in order for the market to return to a Stage 2 environment once more.
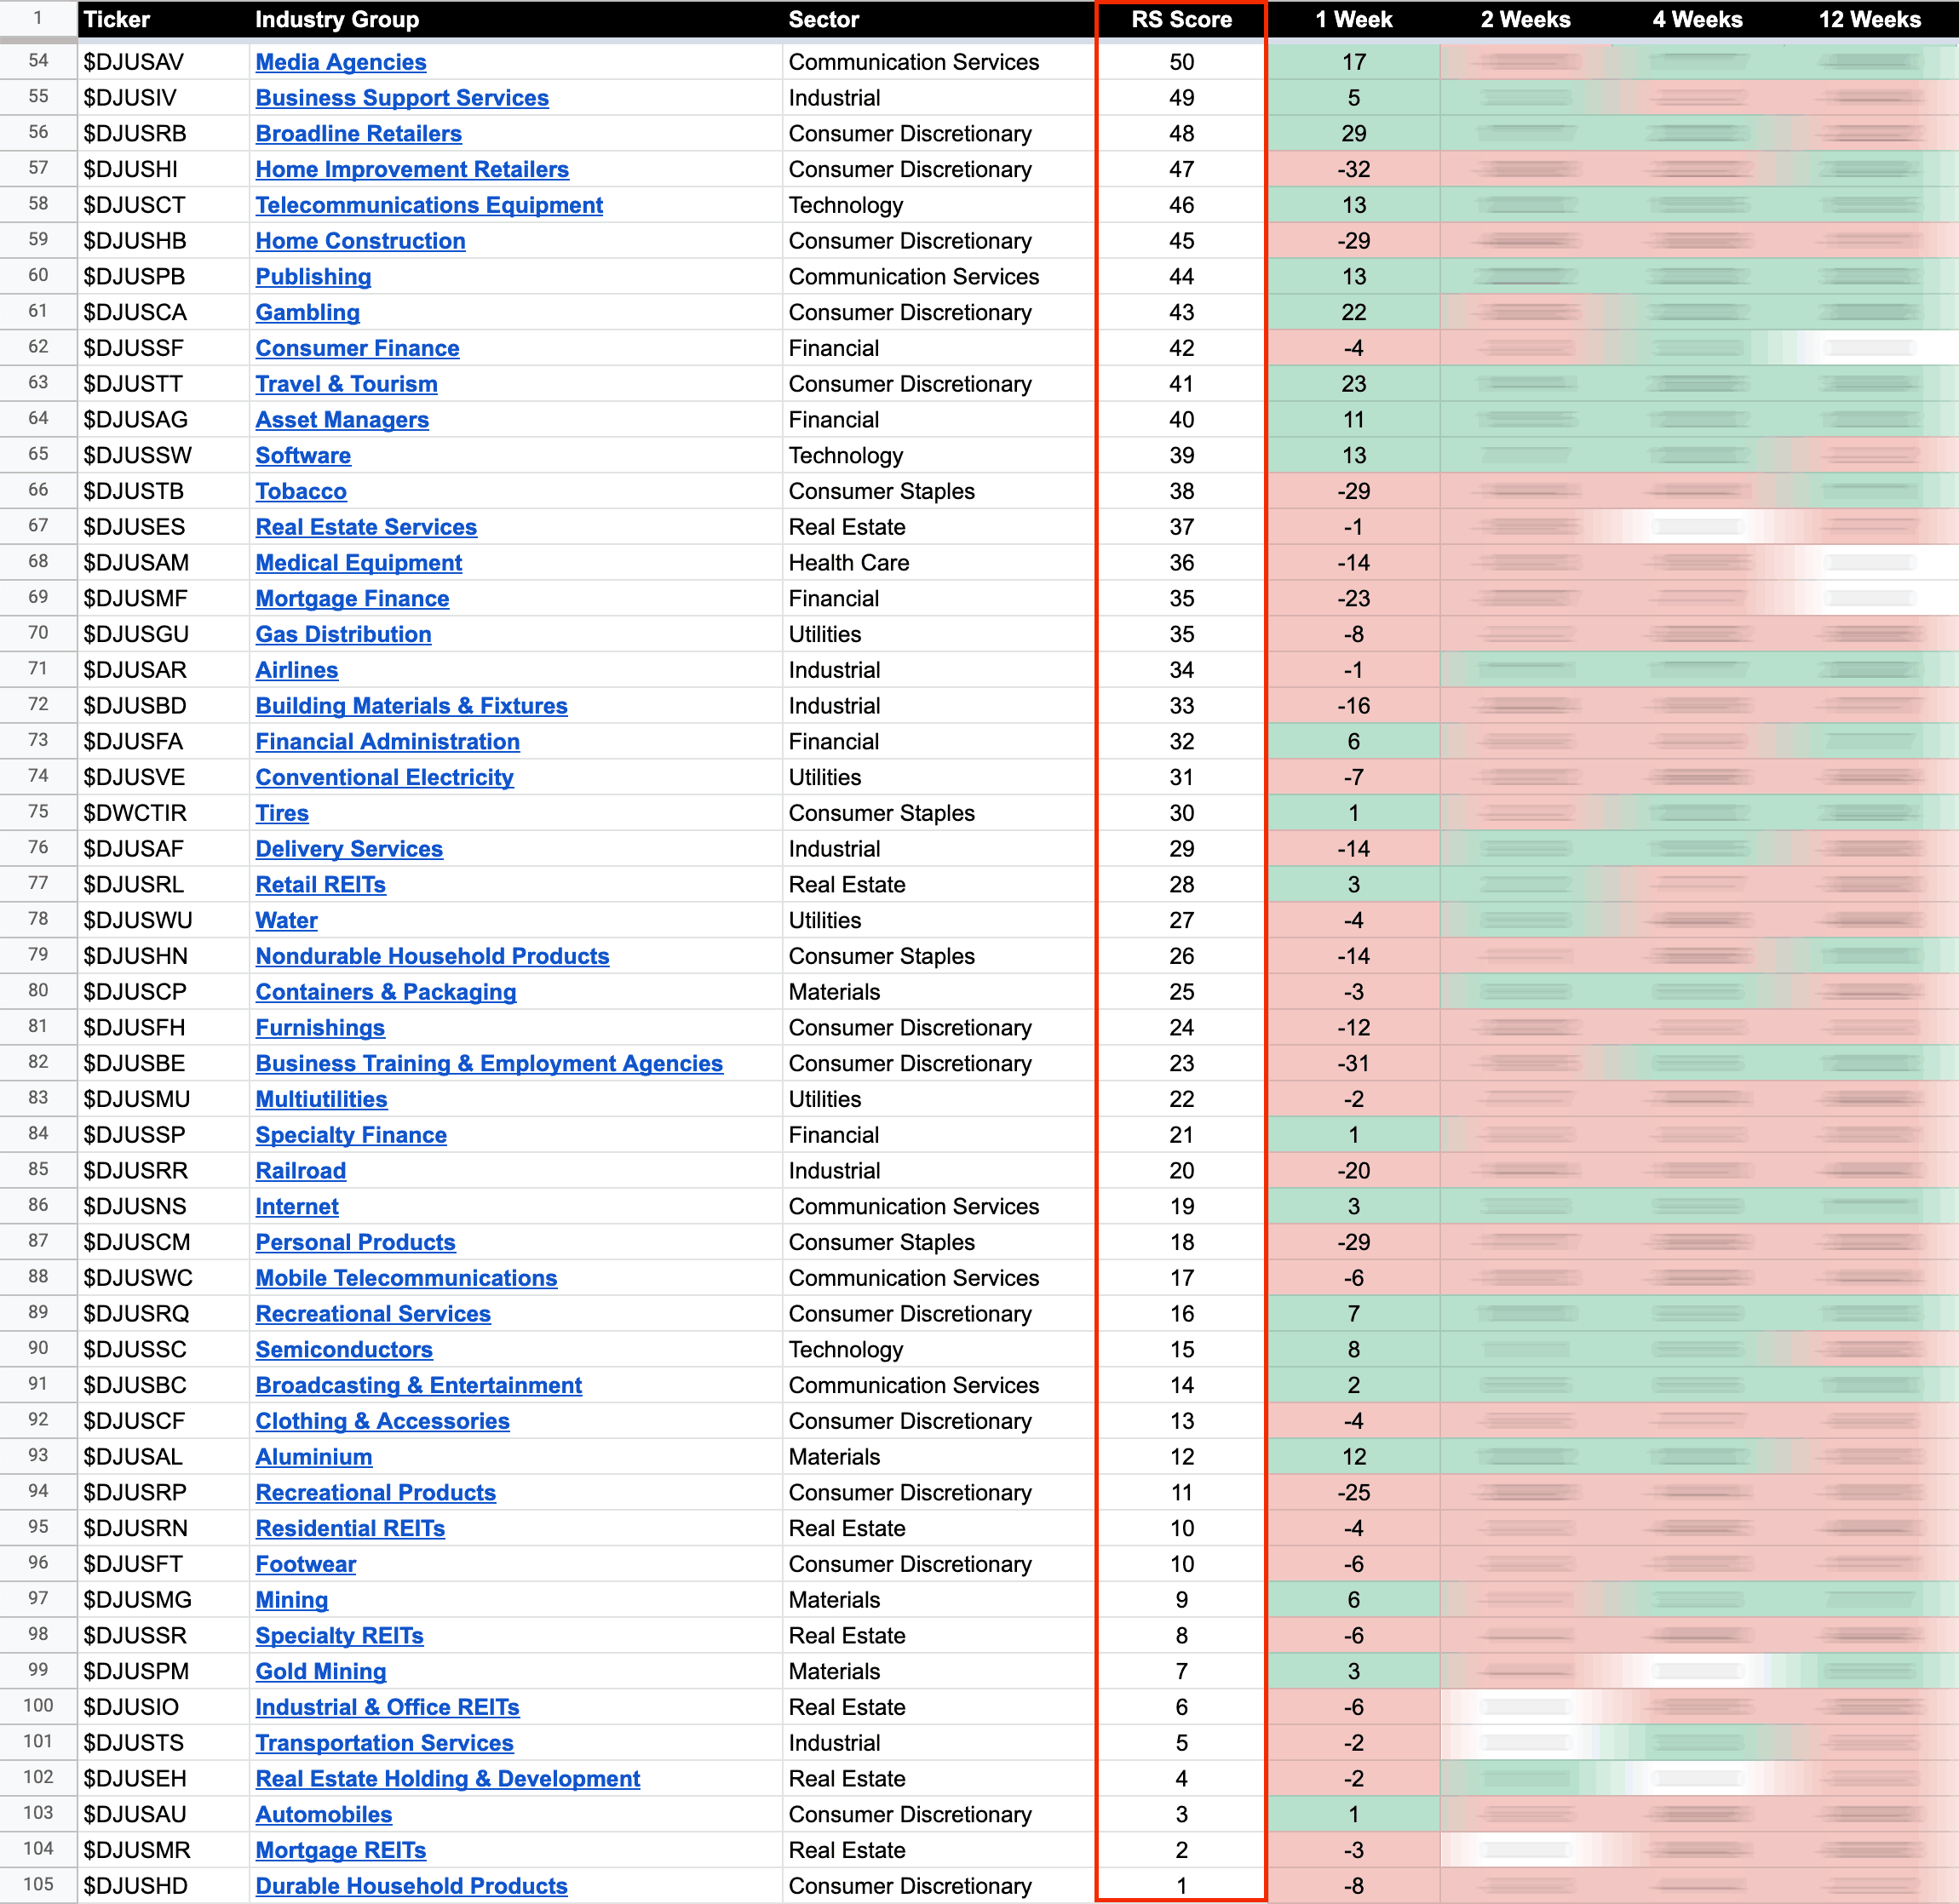
US Industry Groups by Weakest RS Score
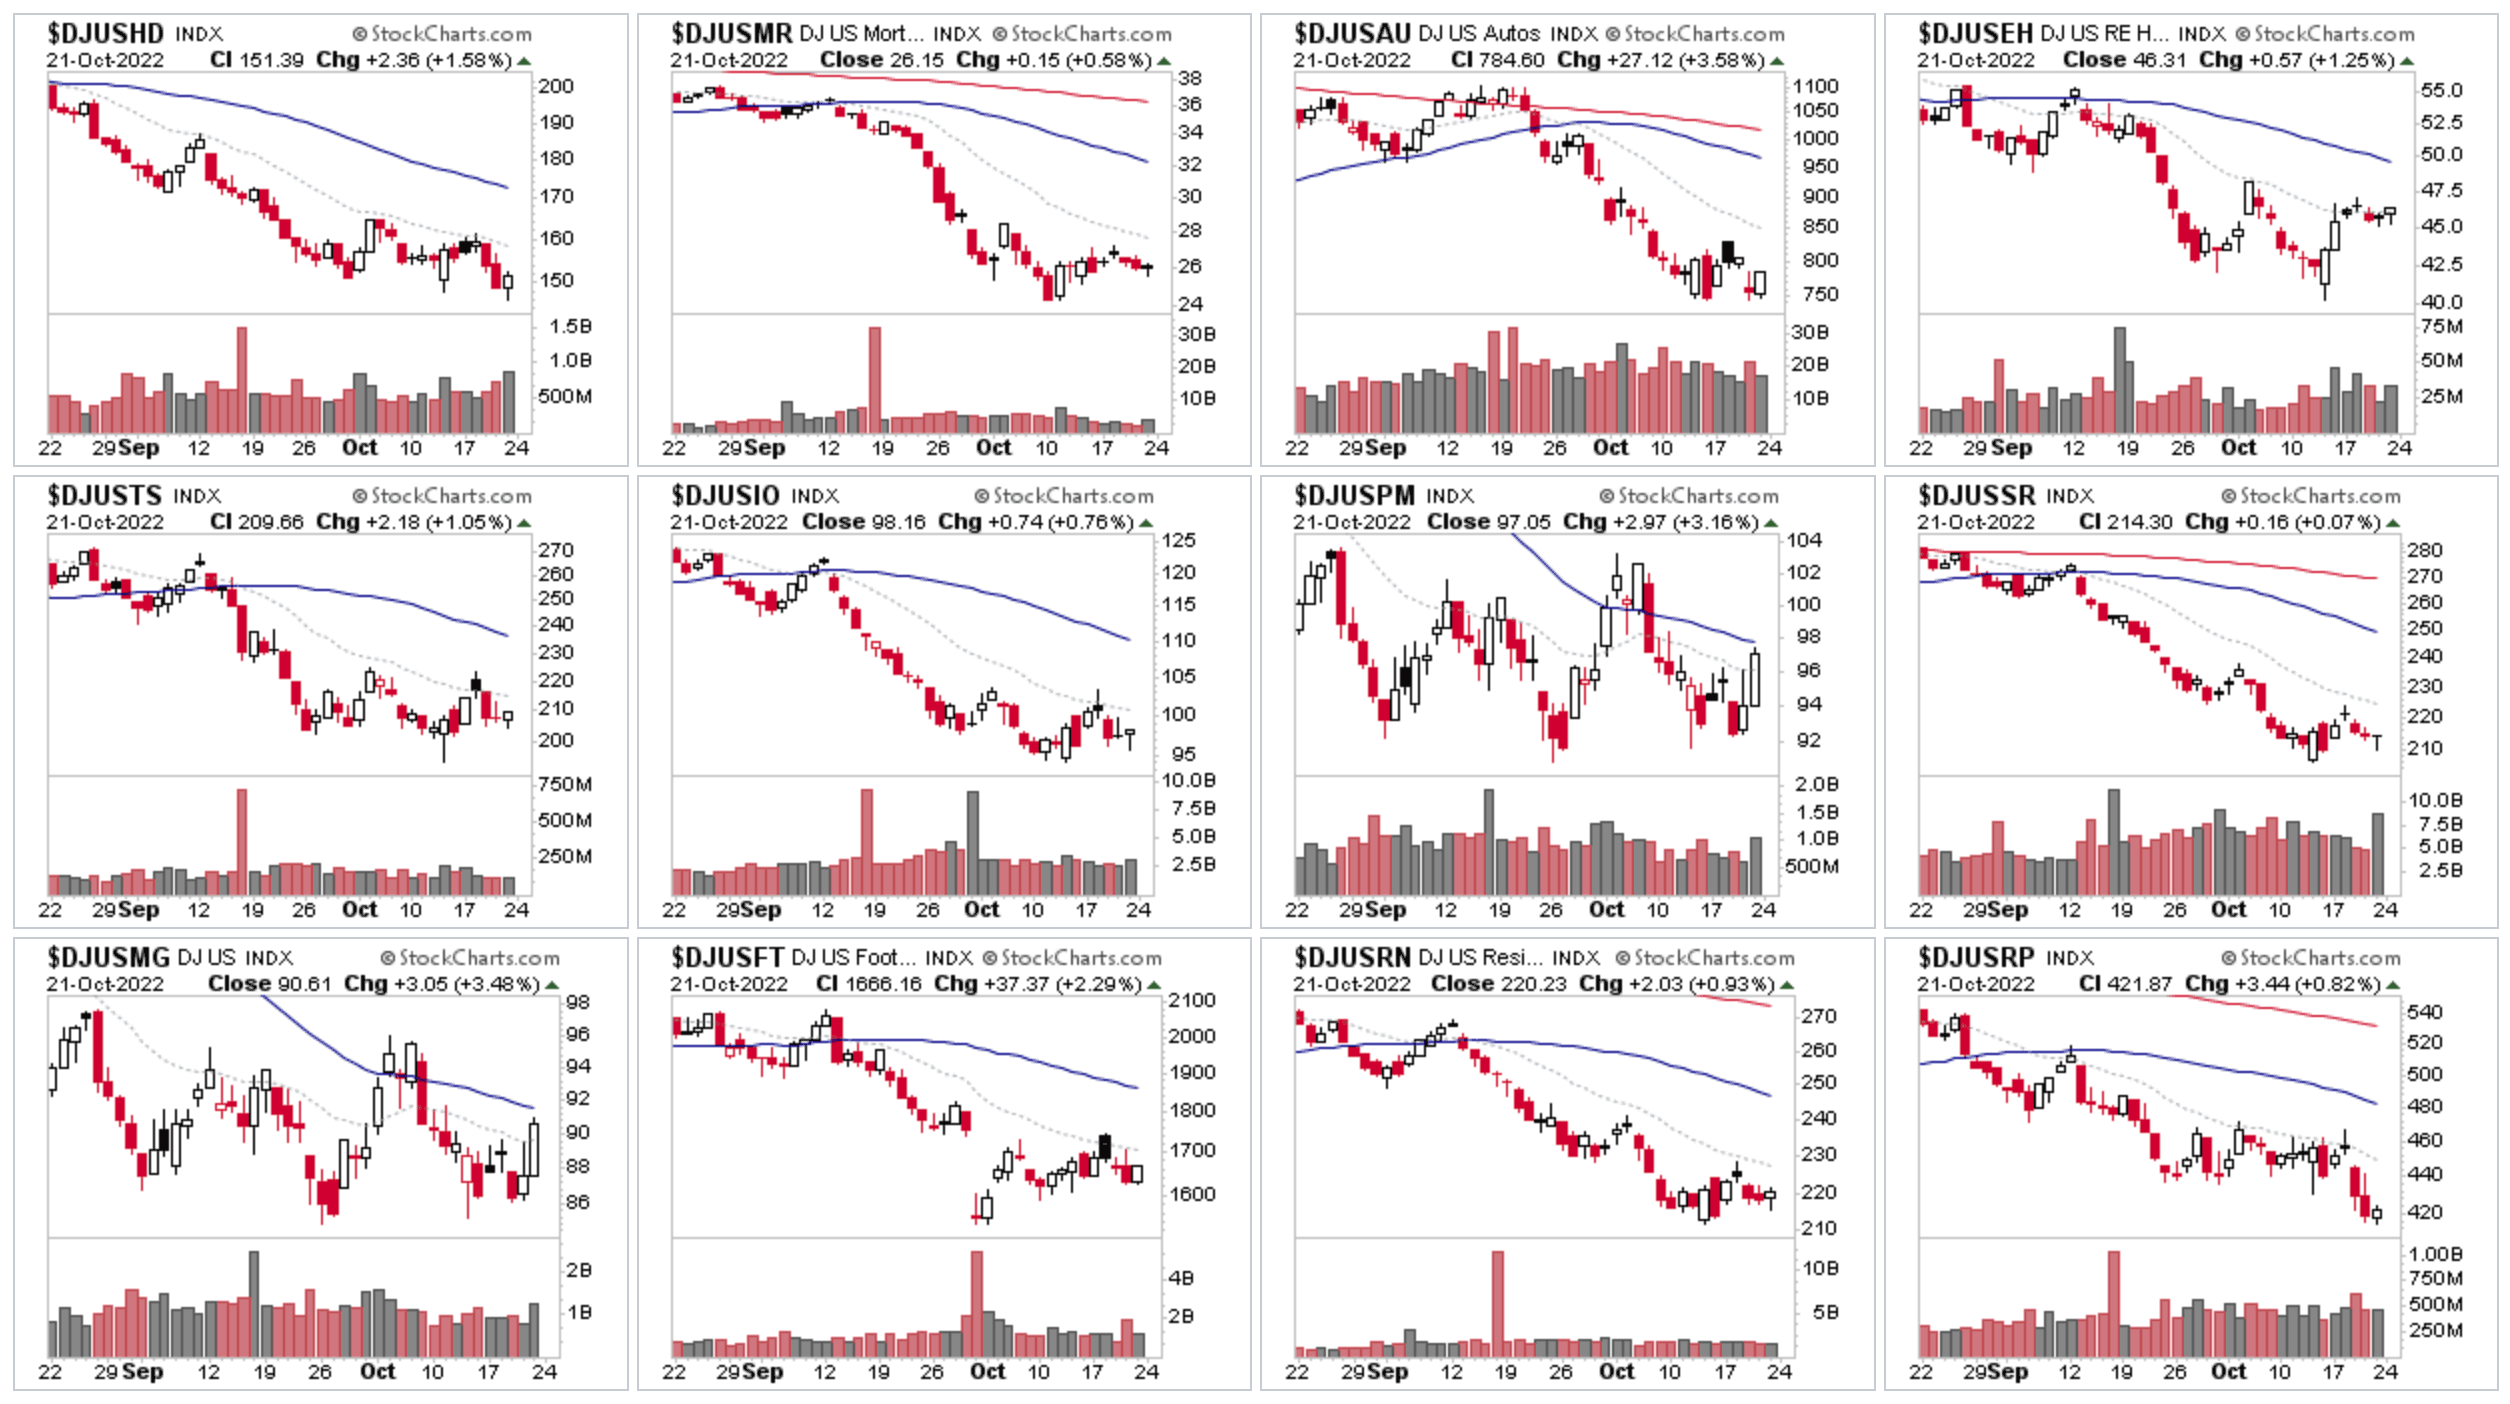
Aluminium finally shifted off from the bottom of the RS rankings – moving up +12 RS points. Durable Household Products, Mortgage REITs and Automobiles have now moved down to the bottom three positions. But the majority of groups are once more attempting to pullback in their recent ranges.
104 Dow Jones Industry Groups sorted by Relative Strength
The purpose of the Relative Strength (RS) tables is to track the short, medium and long-term RS changes of the individual groups to find the new leadership earlier than the crowd.
RS Score of 100 is the strongest, and 0 is the weakest.
In the Stage Analysis method we are looking to focus on the strongest groups, as what is strong, tends to stay strong for a long time. But we also want to find the improving / up and coming groups that are starting to rise up strongly through the RS table from the lower zone, in order to find the future leading stocks before they break out from a Stage 1 base and move into a Stage 2 advancing phase.
Each week I go through the most interesting groups on the move in more detail during the Stage Analysis Members weekend video – as Industry Group analysis is a key part of Stan Weinstein's Stage Analysis method.
Become a Stage Analysis Member:
To see more like this and other premium content, such as the regular US Stocks watchlist, detailed videos and intraday posts, become a Stage Analysis member.
Join Today
Disclaimer: For educational purpose only. Not investment advice. Seek professional advice from a financial advisor before making any investing decisions.


