Market Breadth: Percentage of Stocks Above their 50 Day, 150 Day & 200 Day Moving Averages Combined
The full post is available to view by members only. For immediate access:
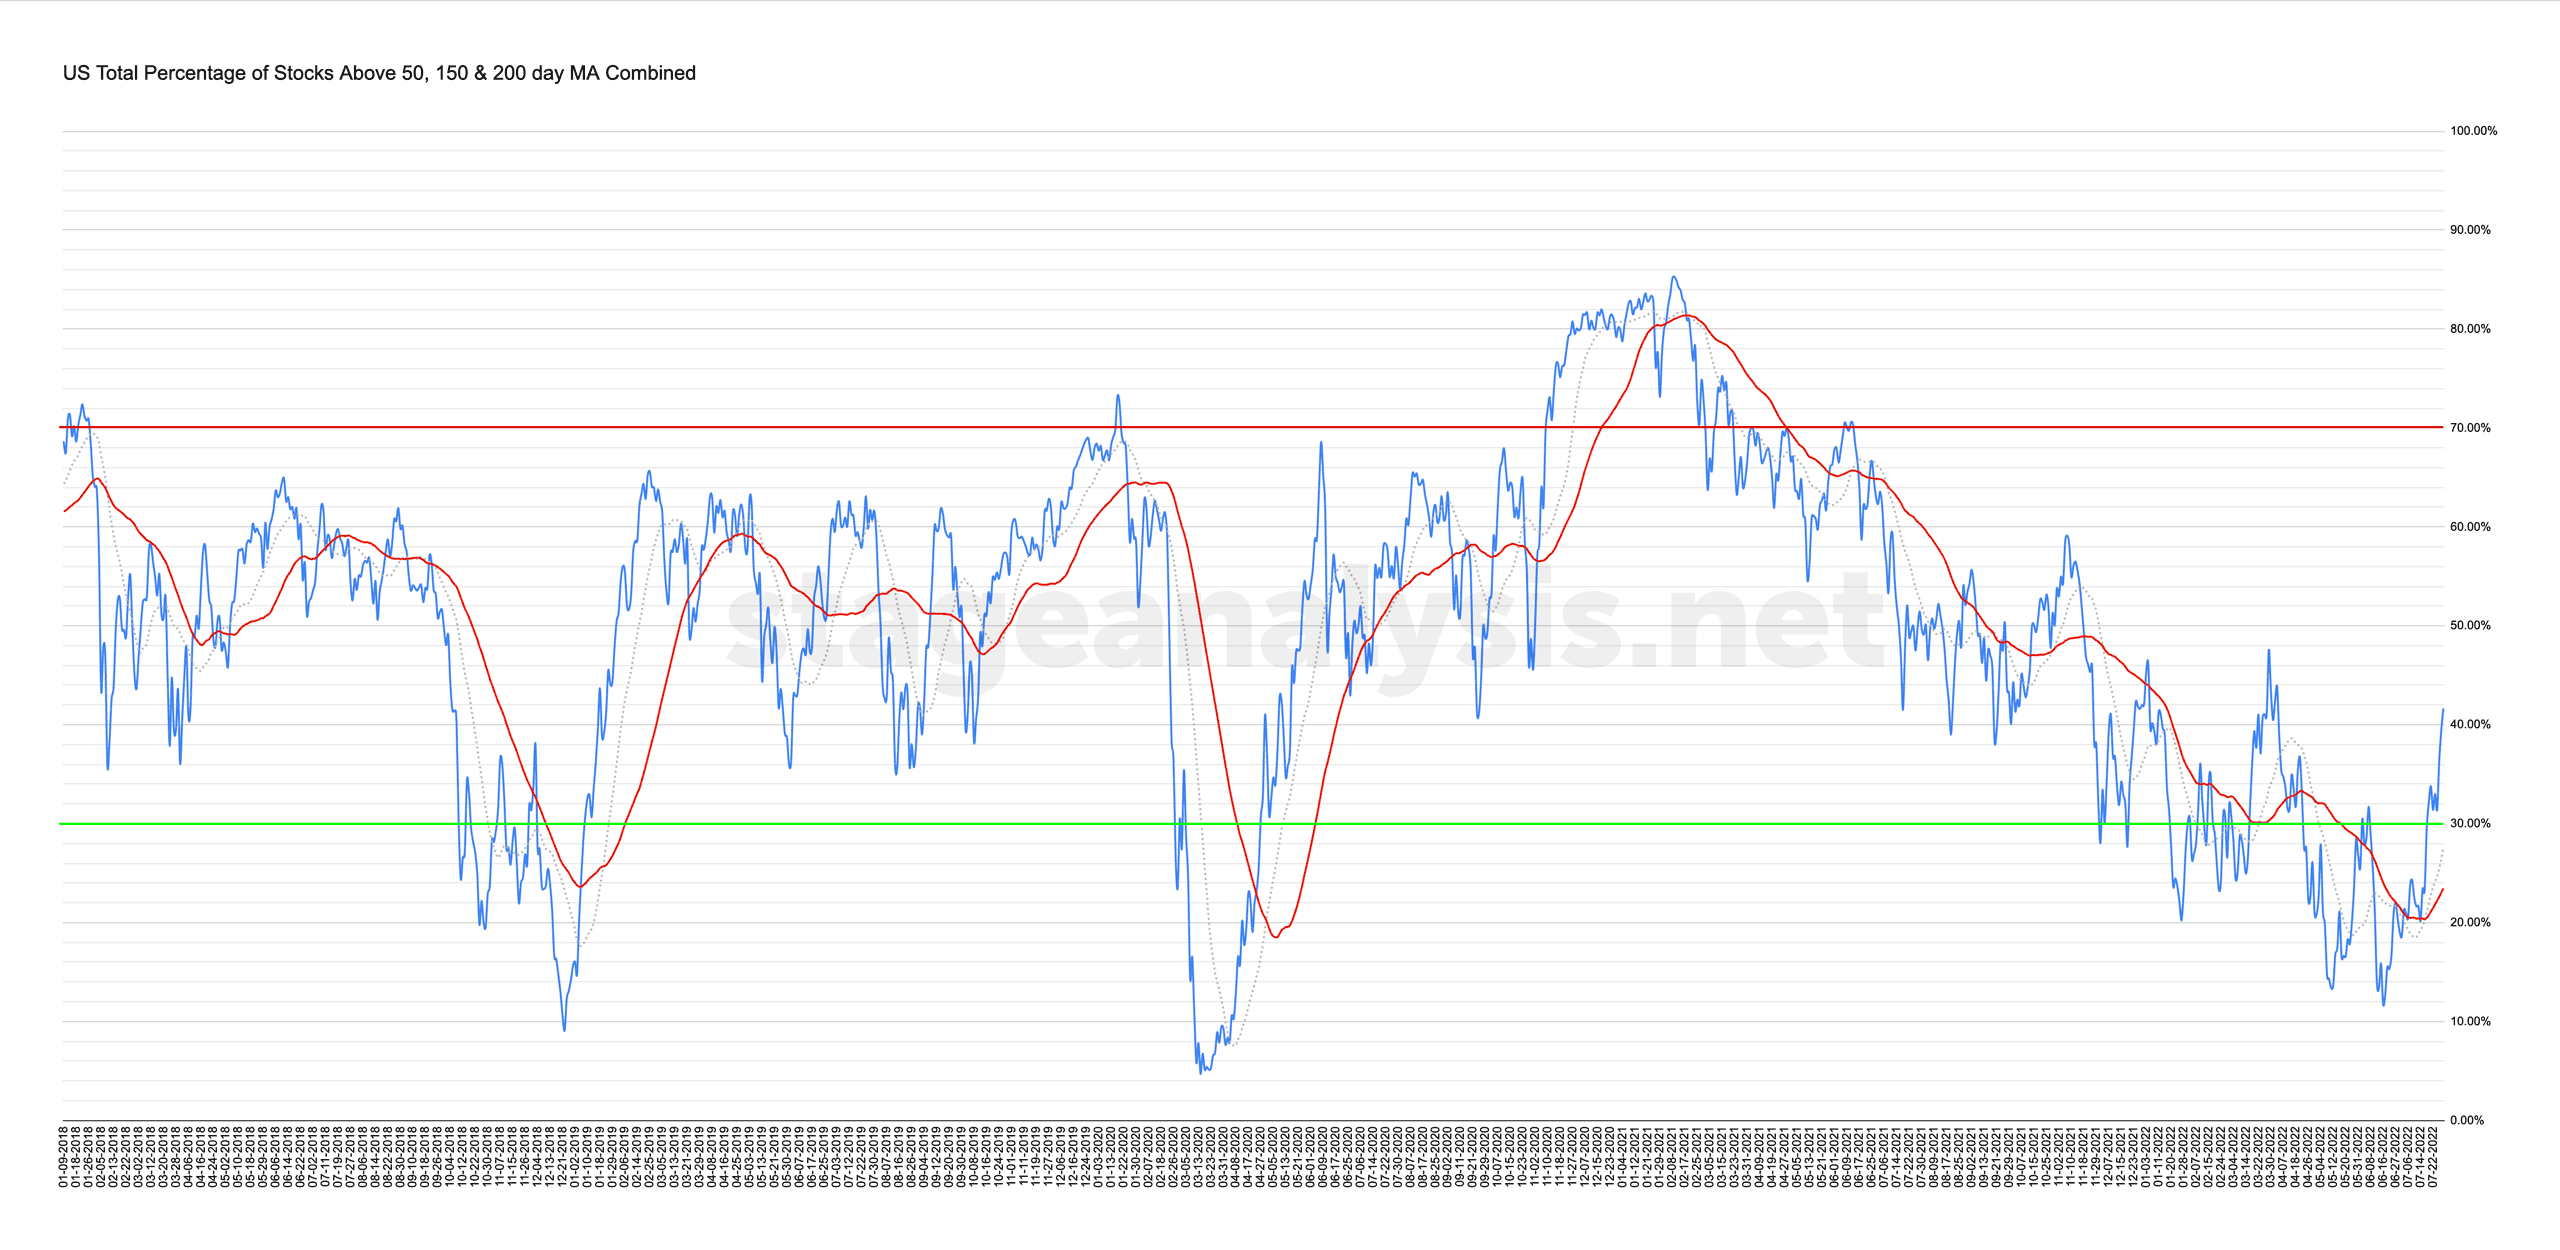
41.65% (+10.25% 1wk)
Status: Positive Environment in Stage 4 zone / Stage 1 zone
The US Total Percentage of Stocks Above their 50 Day, 150 Day & 200 Day Moving Averages had another strong week with further expansion in the breadth, with a +10.25% gain, which takes the overall combined average up to 41.65%, and potentially out of the Stage 4 zone. As the 40%-60% range is considered the Stage 1 or Stage 3 zone (i.e. a non trending environment)
However, it's very much at the lower end of that range, and so although it may be attempting to transition to Stage 1, it will need much more confirmation, as it could easily drop back below the 40% level again, like it did in March. As the combined average is currently +18.20% above its own 50 day MA, which in the short-term is nearing an extreme level, while the market is moving into a major liquidity zone, where it's formed multiple swing lows and swing highs year to date, and hence the moving average breadth is extended in the short-term with price moving into a zone of potential resistance.
But, the short-term trend remains higher currently and has gradually improved back to positive environment status. So this counter-trend rally in Stage 4 may have more in the tank yet with earnings season in full swing. But caution remains prudent, as we move closer to the historically weakest month of the four year presidential cycle (September of the mid-term year).
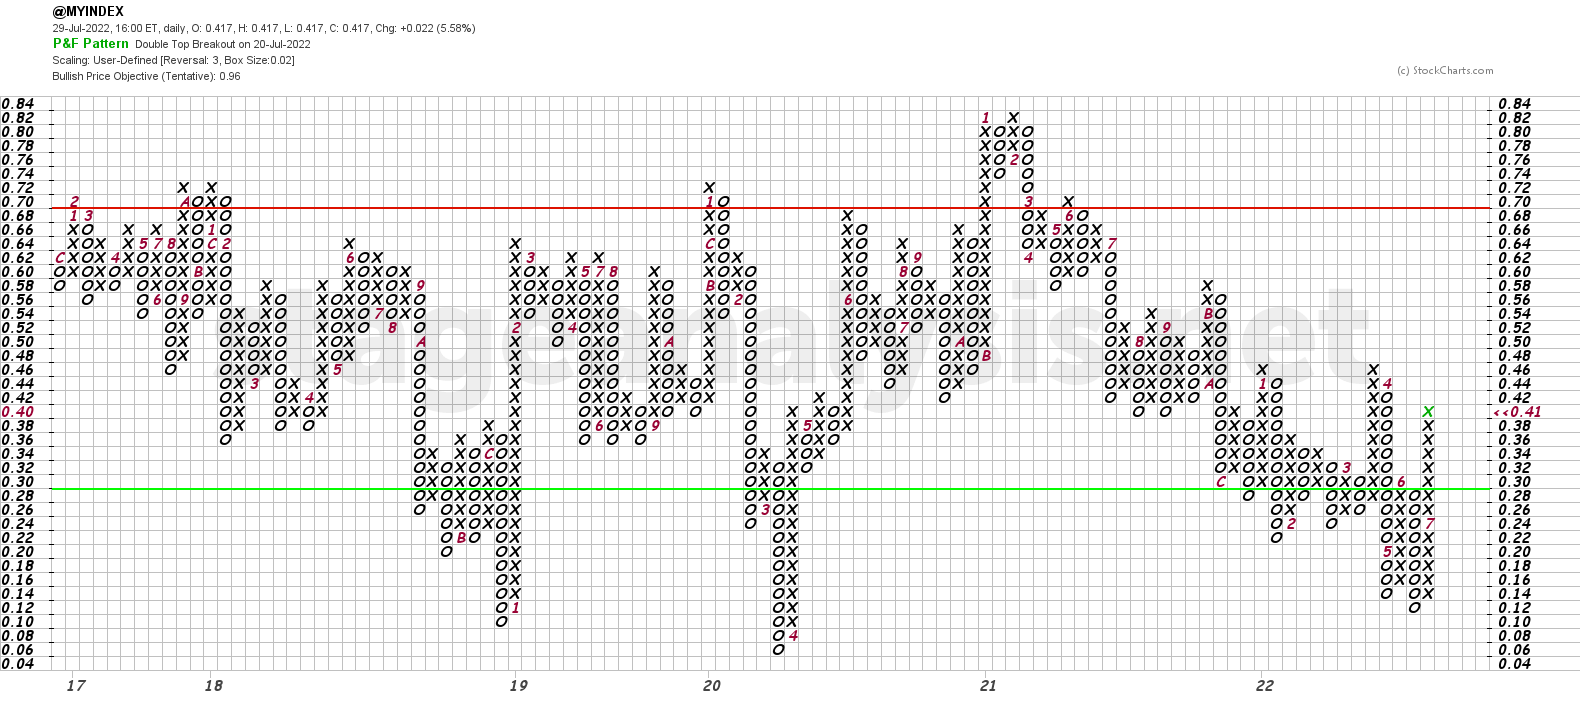
The Point and Figure chart added a further 4 Xs to its current column this week. Extending away from last weeks double top breakout that changed it to Bull Confirmed status, and is now within 3 boxes of the 46% level that it topped out at in January and March.
I'll discuss all of the combined moving average breadth charts from the full post in detail during the Stage Analysis Members weekend video – which is scheduled for later on Sunday afternoon EST.
Become a Stage Analysis Member:
To see more like this and other premium content, such as the regular US Stocks watchlist, detailed videos and intraday posts, become a Stage Analysis member.
Join Today
Disclaimer: For educational purpose only. Not investment advice. Seek professional advice from a financial advisor before making any investing decisions.


