US Stocks Industry Groups Relative Strength Rankings
The full post is available to view by members only. For immediate access:
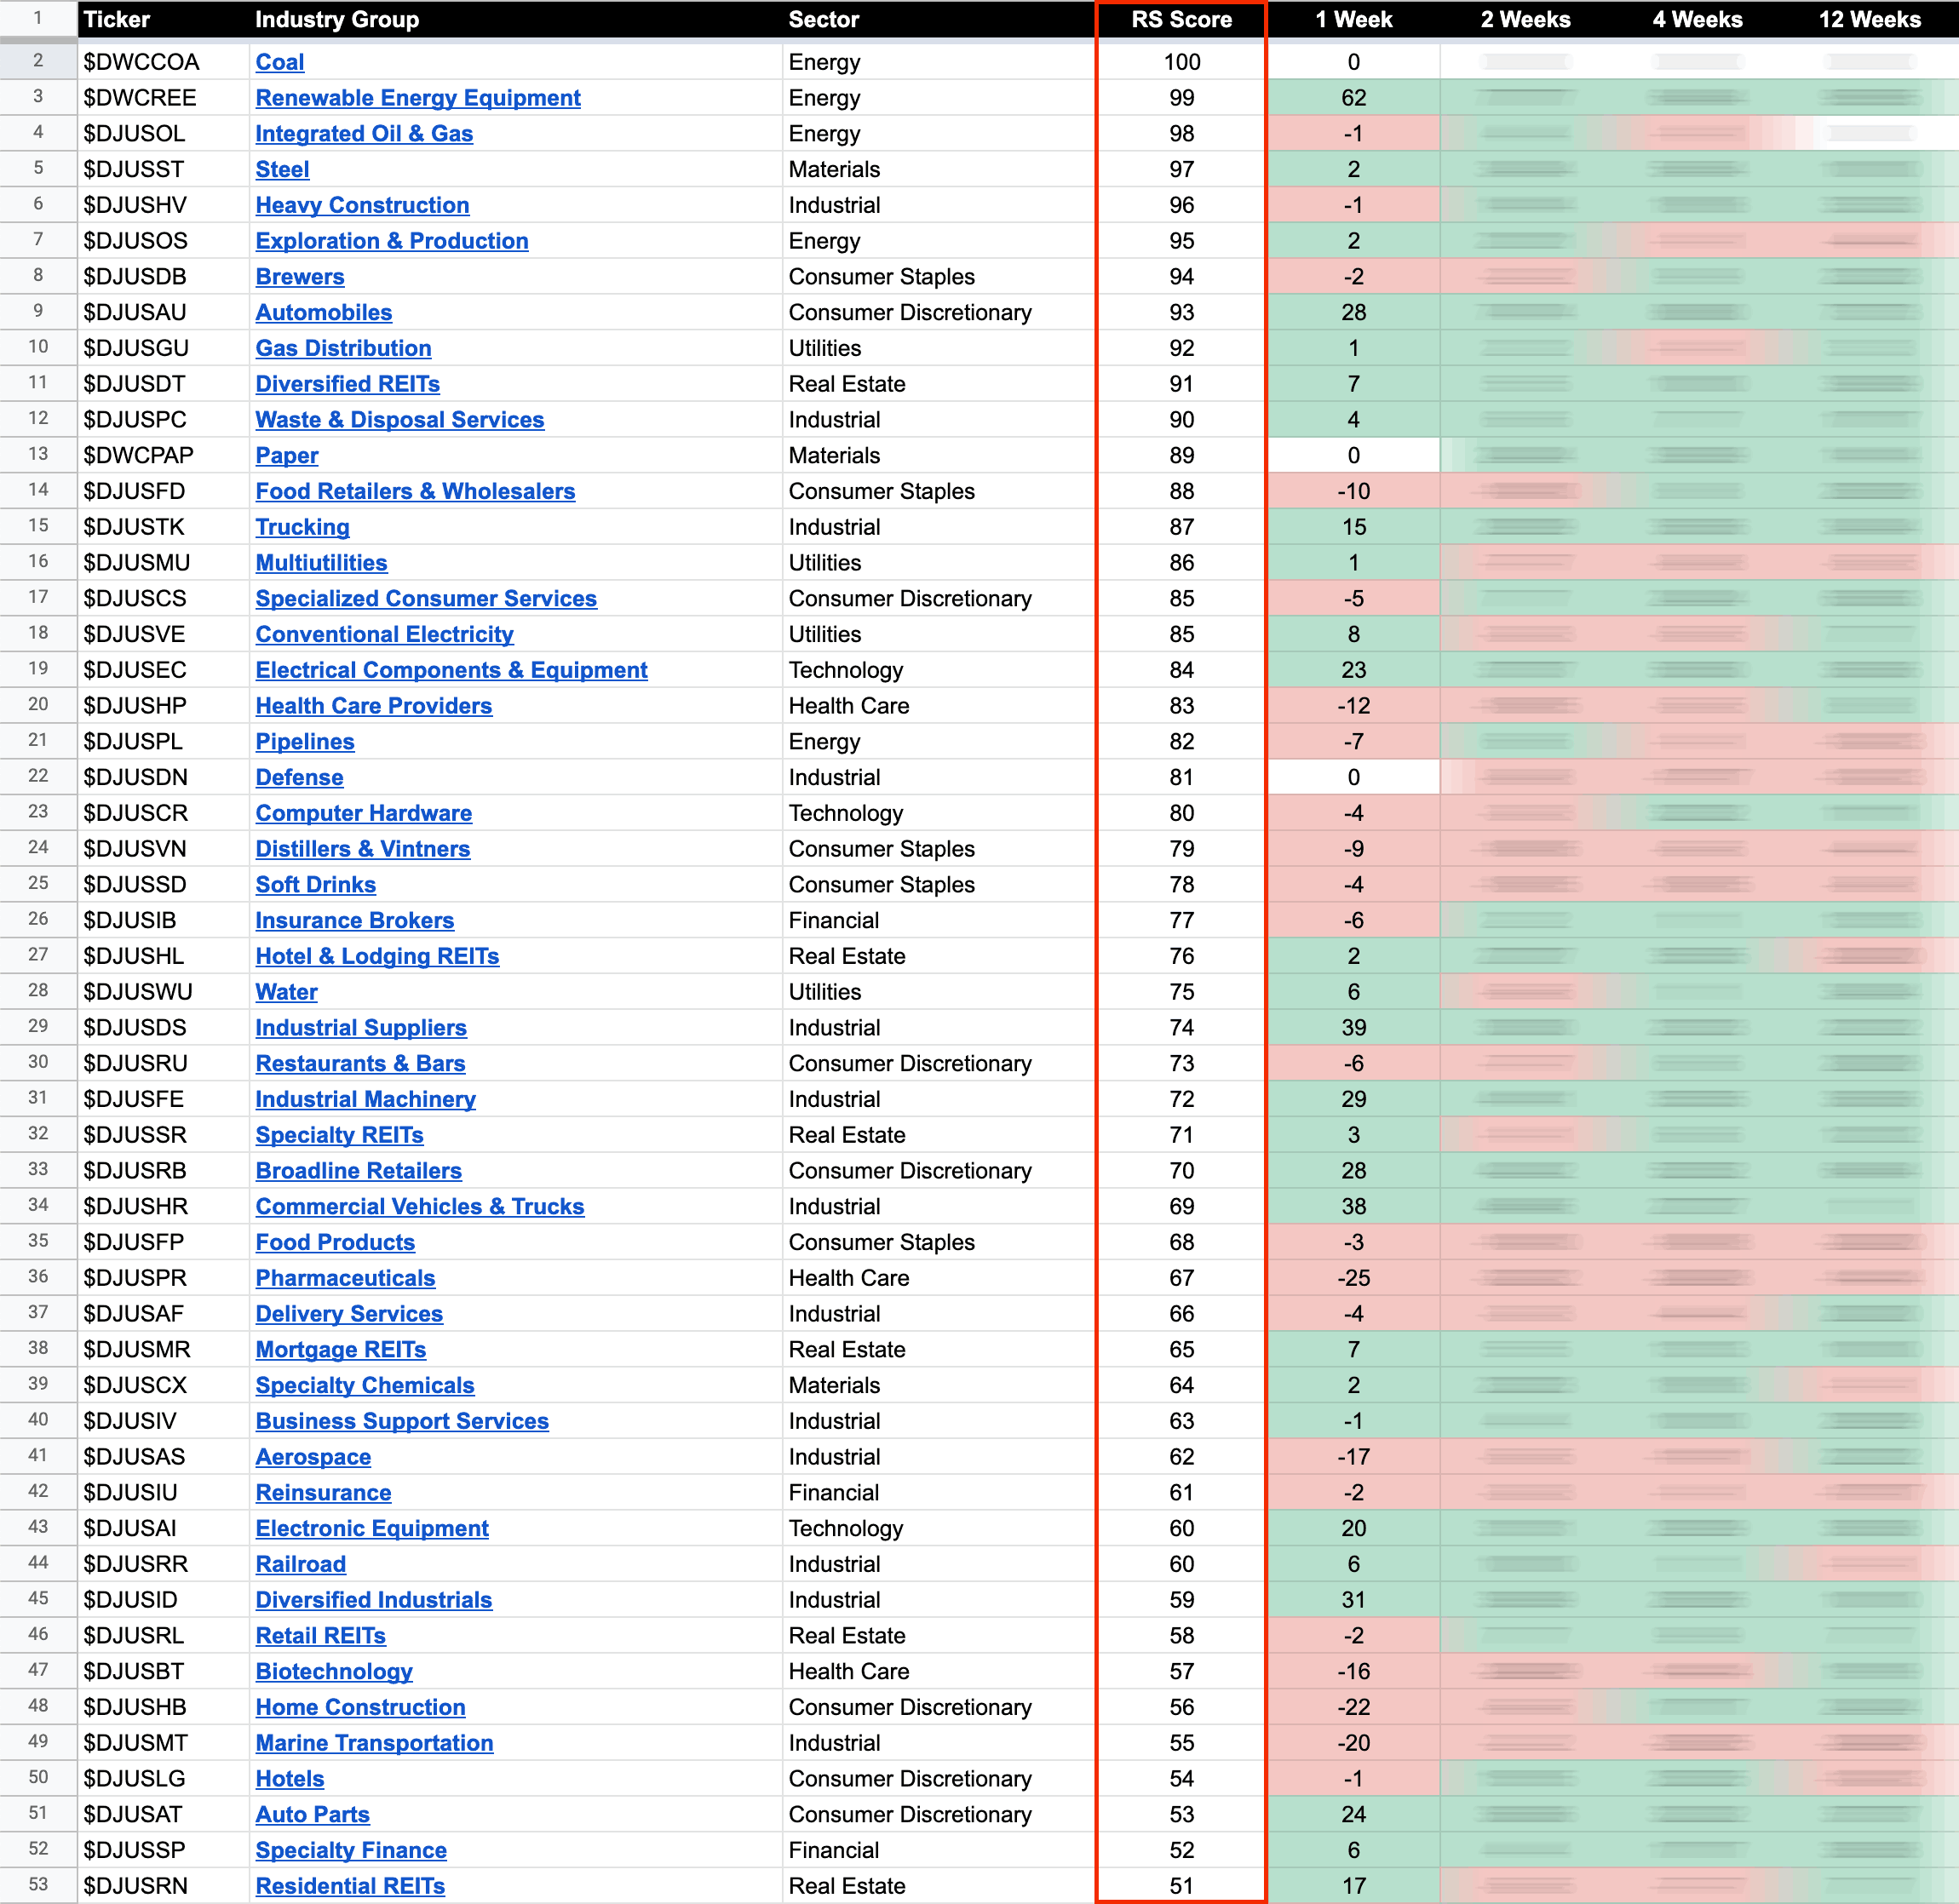
US Industry Groups by Highest RS Score
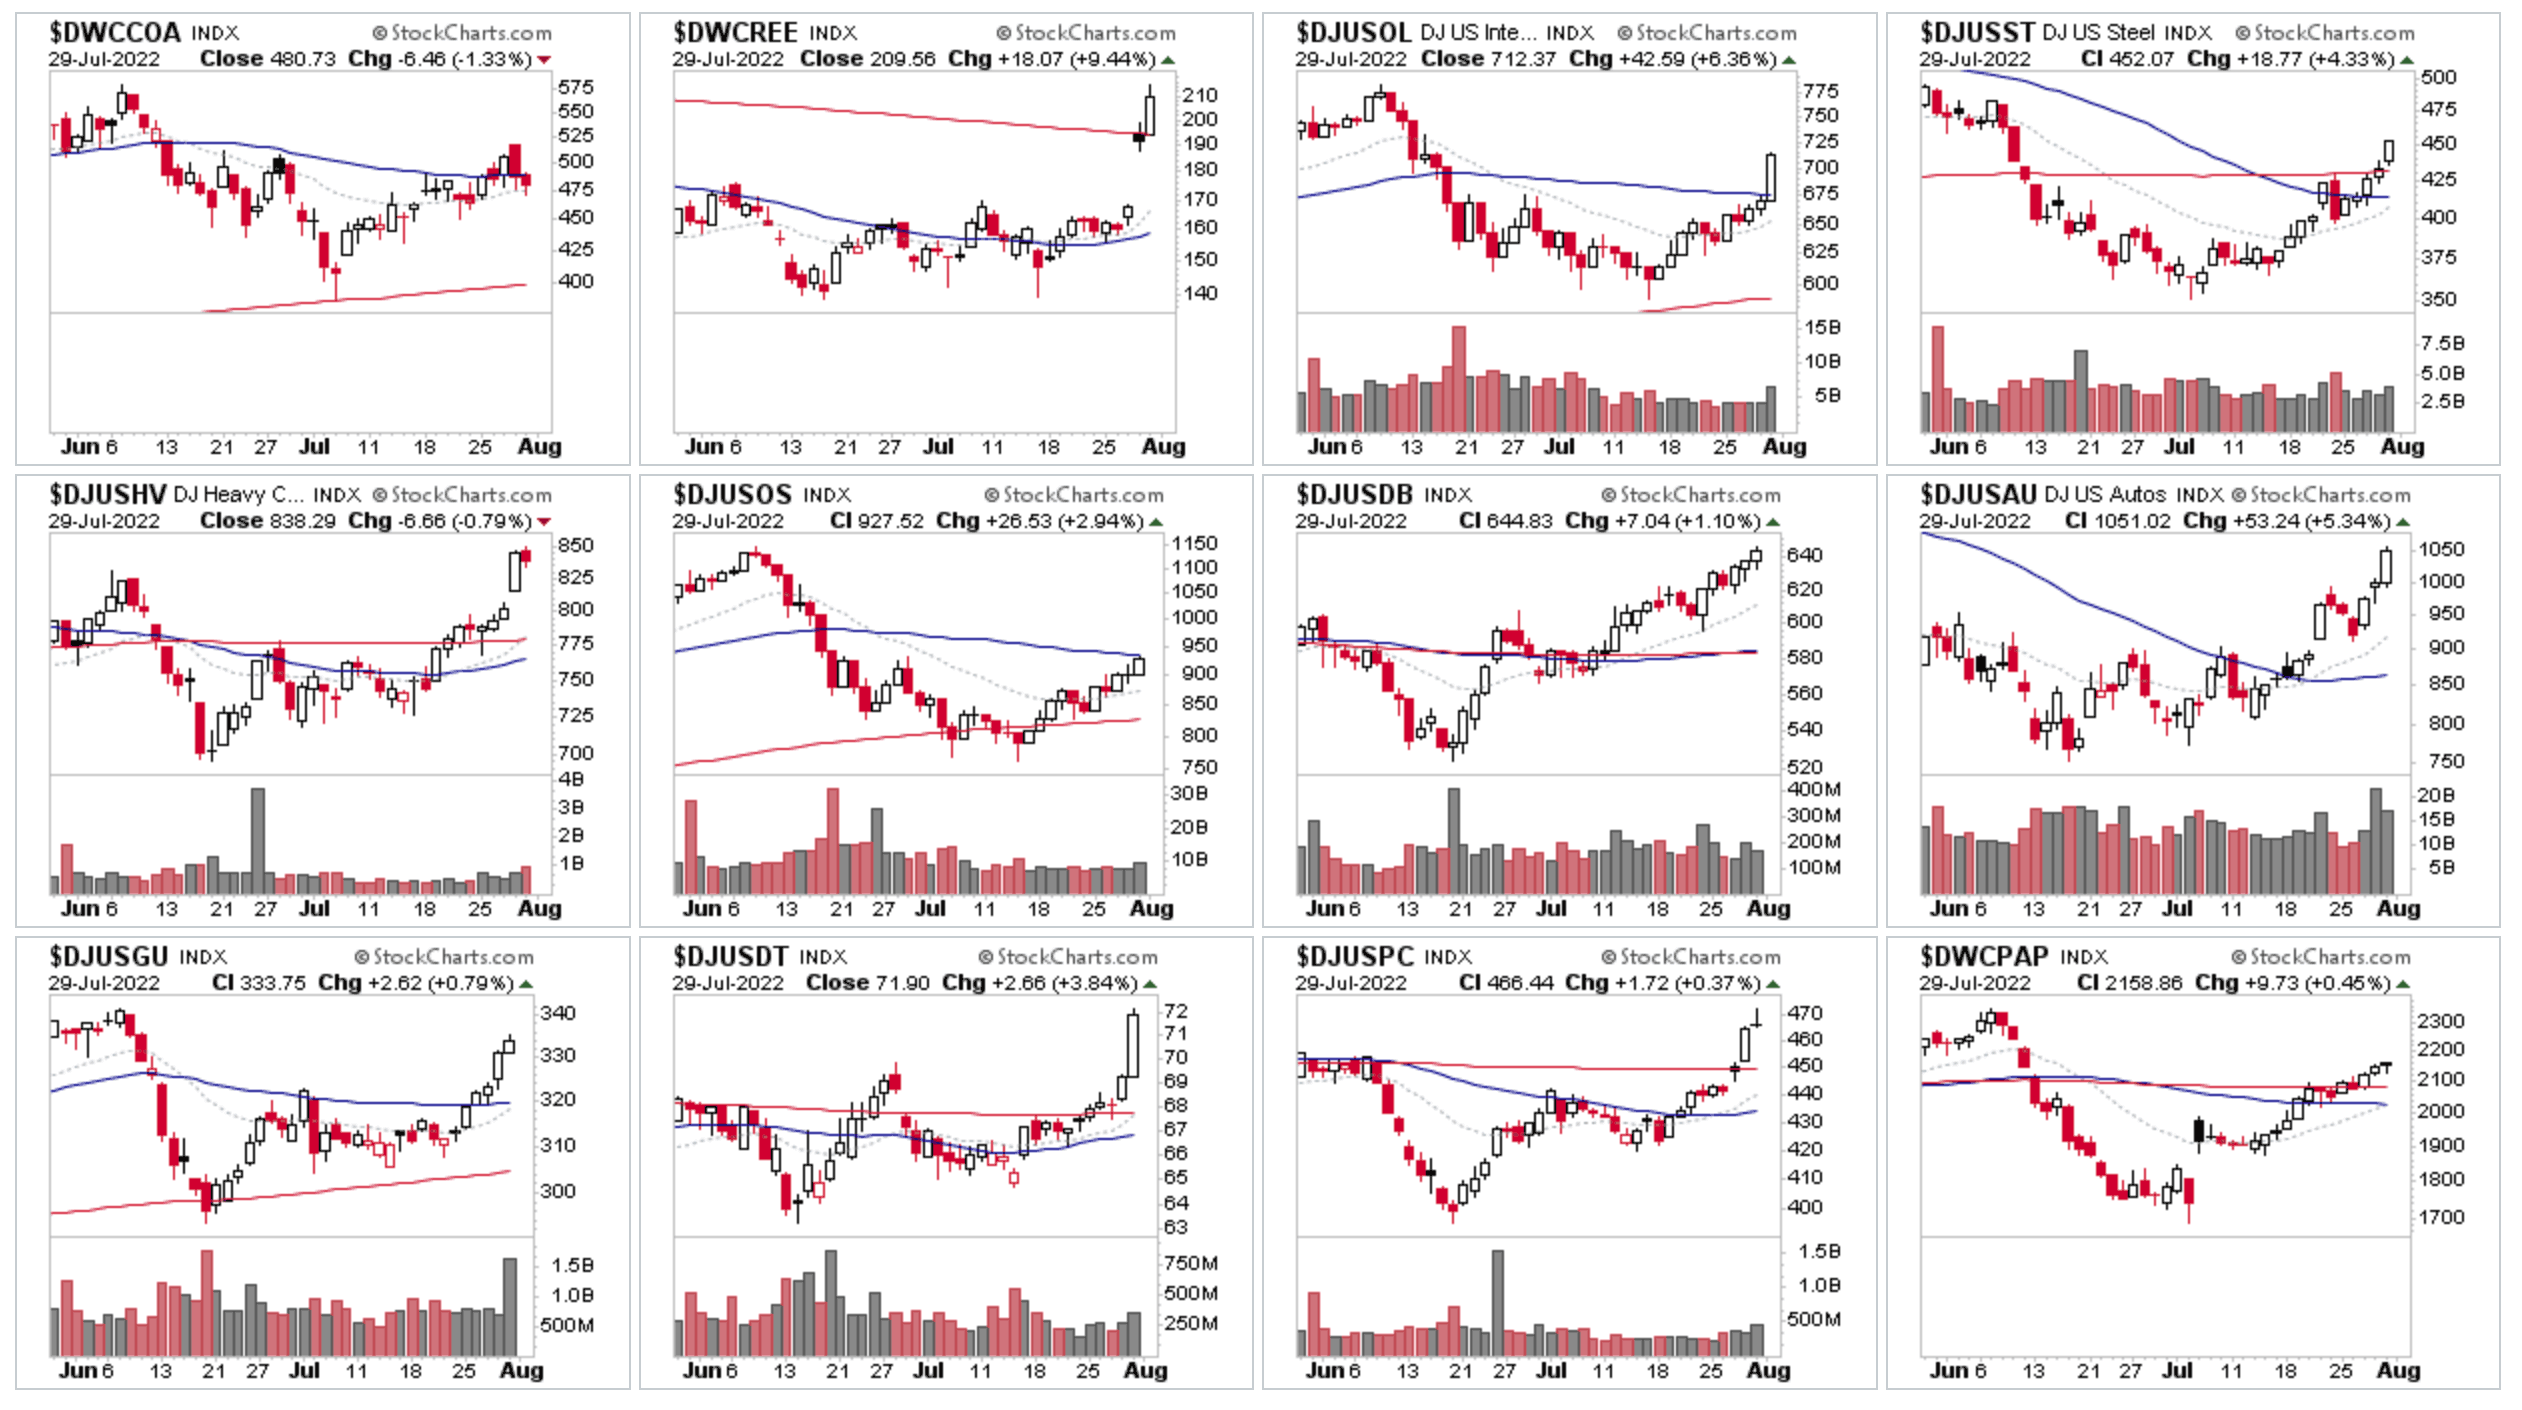
Coal remains the leading group for another week, although it faltered following earnings in BTU on Thursday and closed the week back below the 50 day MA.
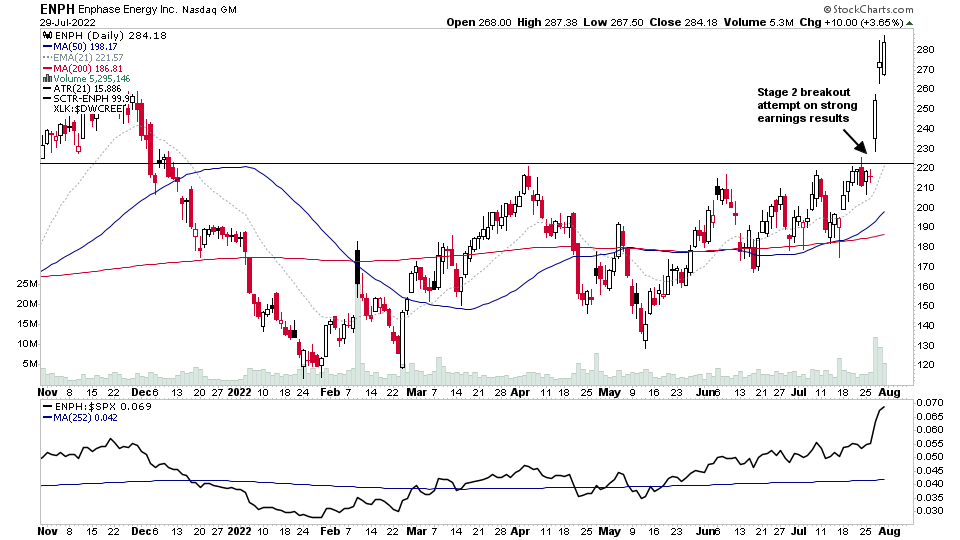
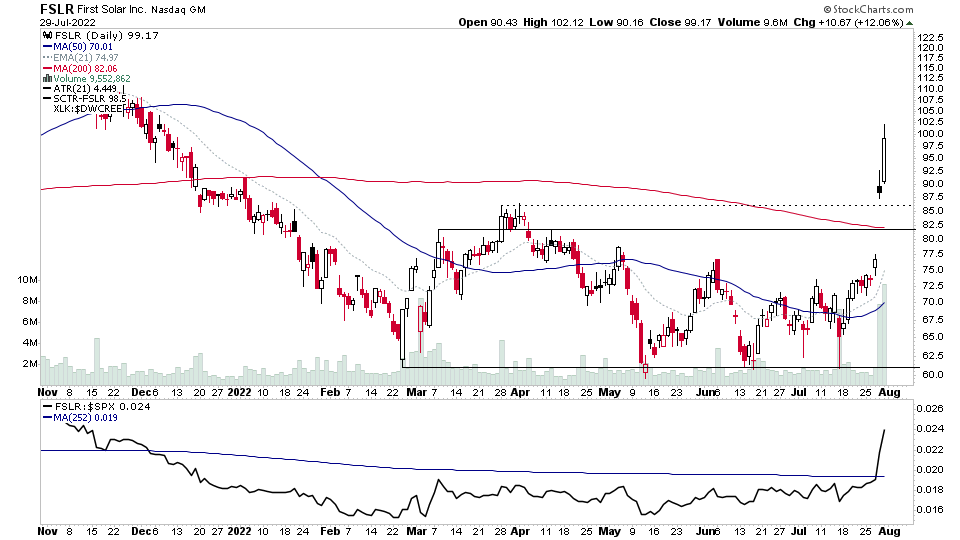
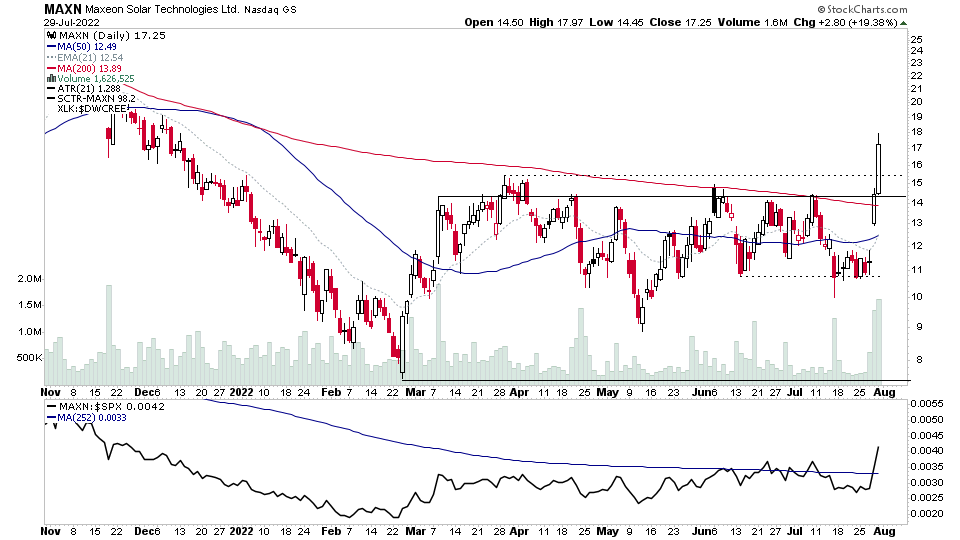
The standout group this week was the Renewable Energy Equipment group ($DWCREE), moving 62 RS points up the RS rankings with multiple Stage 2 breakouts in individual stocks in the group on strong relative volume, led by the deal on climate spending and strong earnings results from the leading stock in the group ENPH. All of which helped the group to make an early Stage 2 breakout attempt.
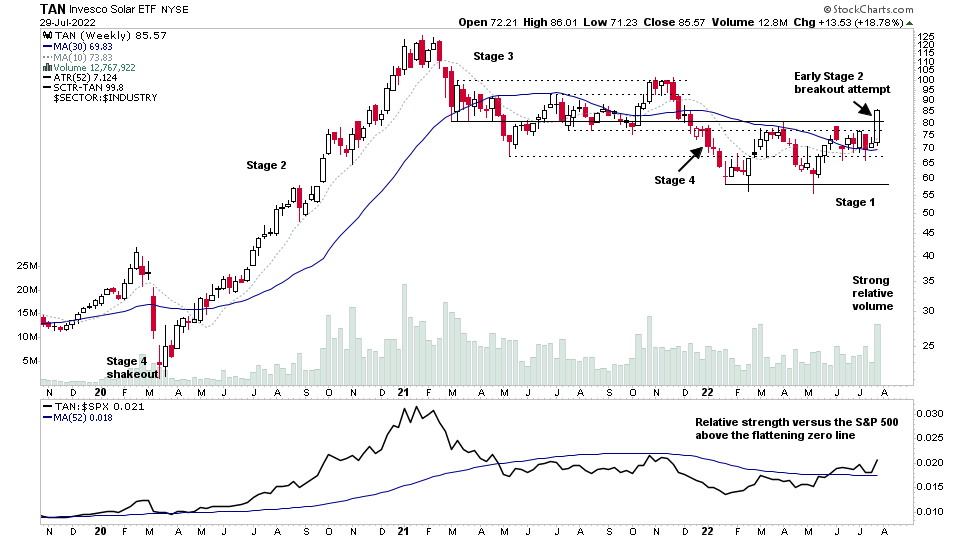
Below is the marked up Invesco Solar ETF – TAN weekly Stage Analysis chart. For those learning Stan Weinstein's Stage Analysis method. Note the key higher quality characteristics that we look for at a Stage 2 breakout. i.e. Price breaking out from a large base structure, Volume more than 2x the weekly average, Relative Strength versus the S&P 500 above the Mansfield RS zero line, with the zero line itself (52 week RS MA) flattening or rising, and little or no near term resistance.
So as you can see the group chart meets the majority of these, but falls short with the near term resistance requirement, as it is moving into a large one year long resistance range, from the 2021 Stage 3 structure, and so that could limit progress in the near term into Stage 2.
So as it doesn't meet all of the criteria we need to be on watch for signs of failure that could turn the breakout into an Upthrust and drop back into the Stage 1 range.
However, if the Stage 2 breakout is successful, then we'd want to see it follow through for a number of weeks before making a potential pullback towards the breakout level again (known as the Backup, or Backup to the Creek in the Wyckoff method) – which is a potential secondary entry point in Stage Analysis Investor method and also a favoured entry area in the Wyckoff method.
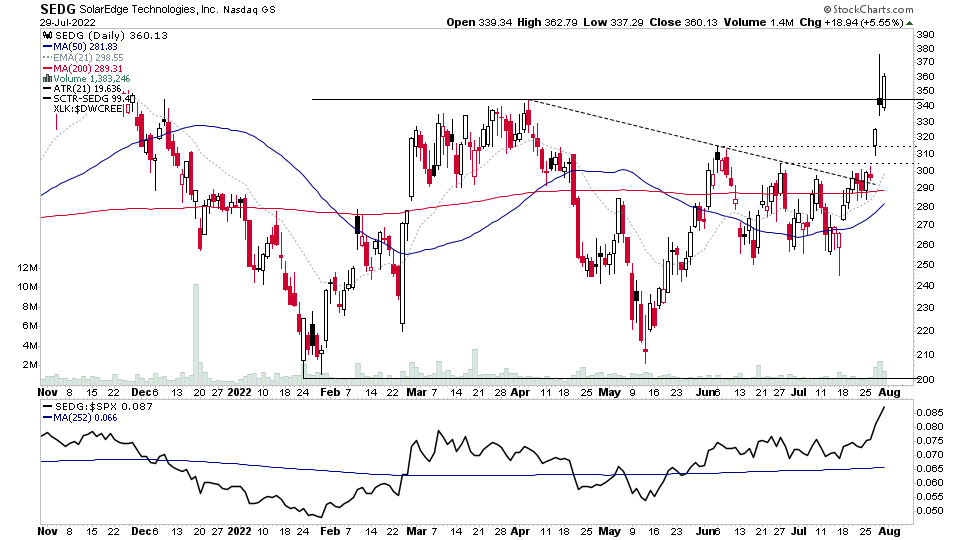
Here's the daily charts of a few of the strongest RS stocks from the group – ENPH, SEDG, FSLR, MAXN
US Industry Groups by Weakest RS Score
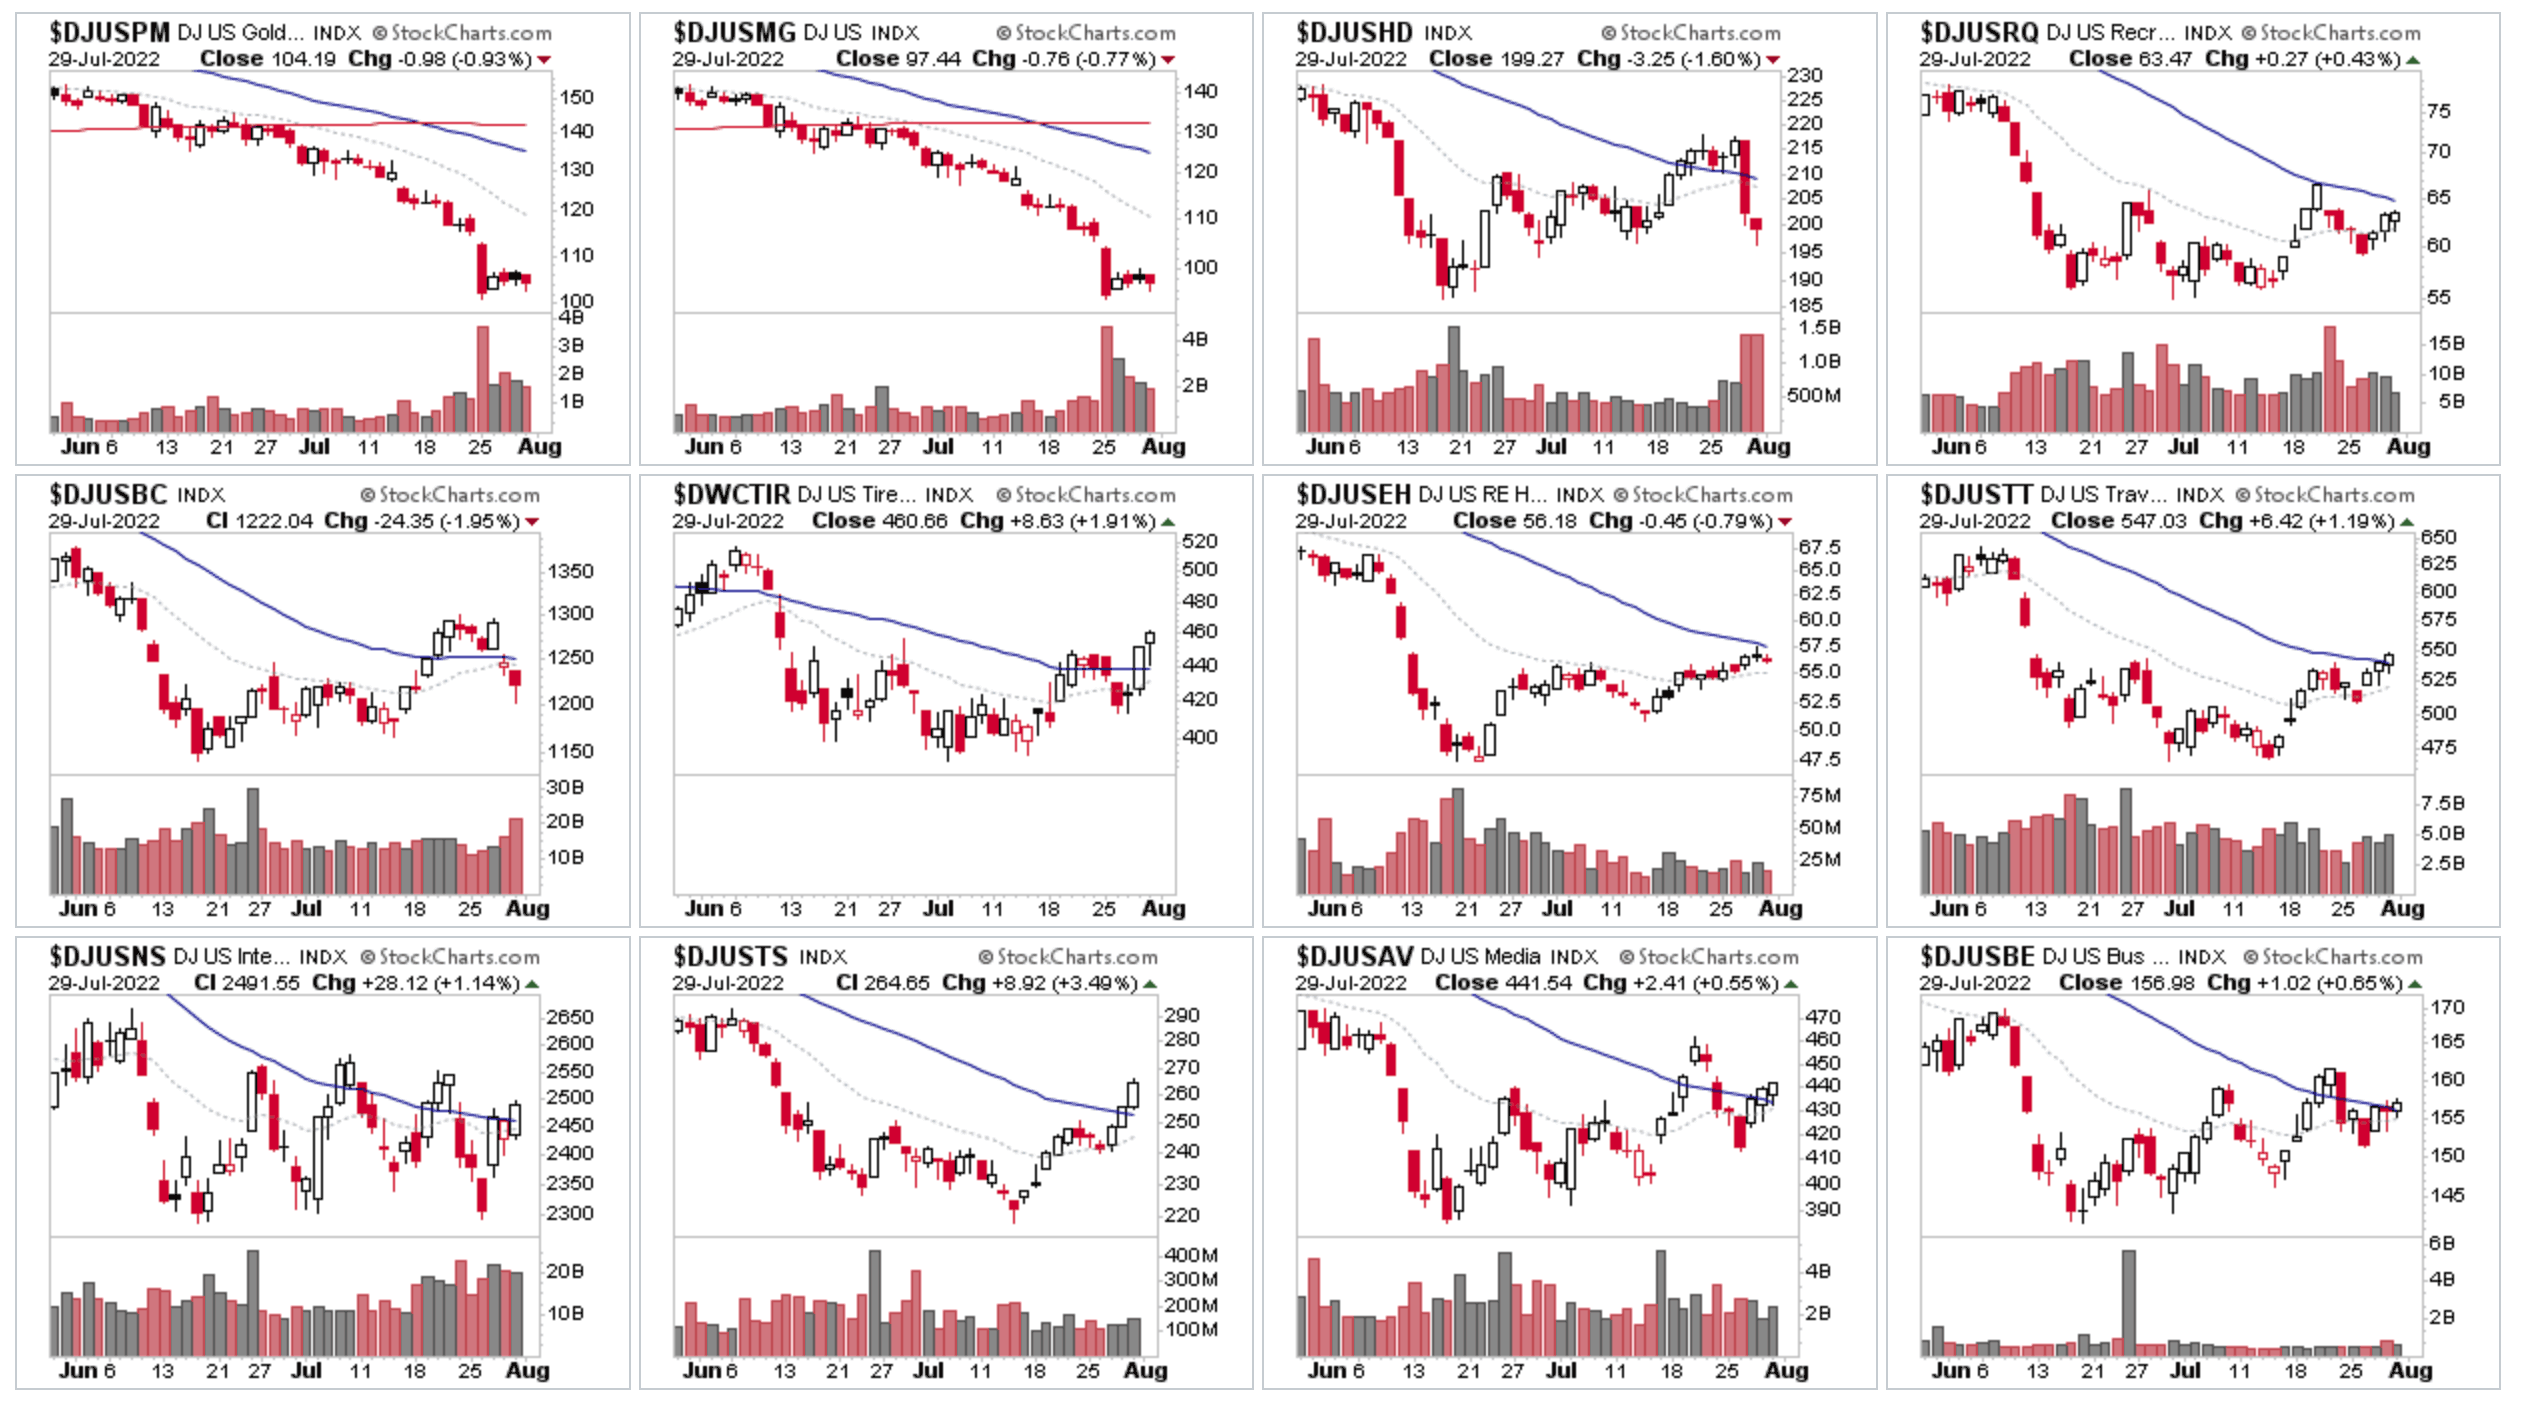
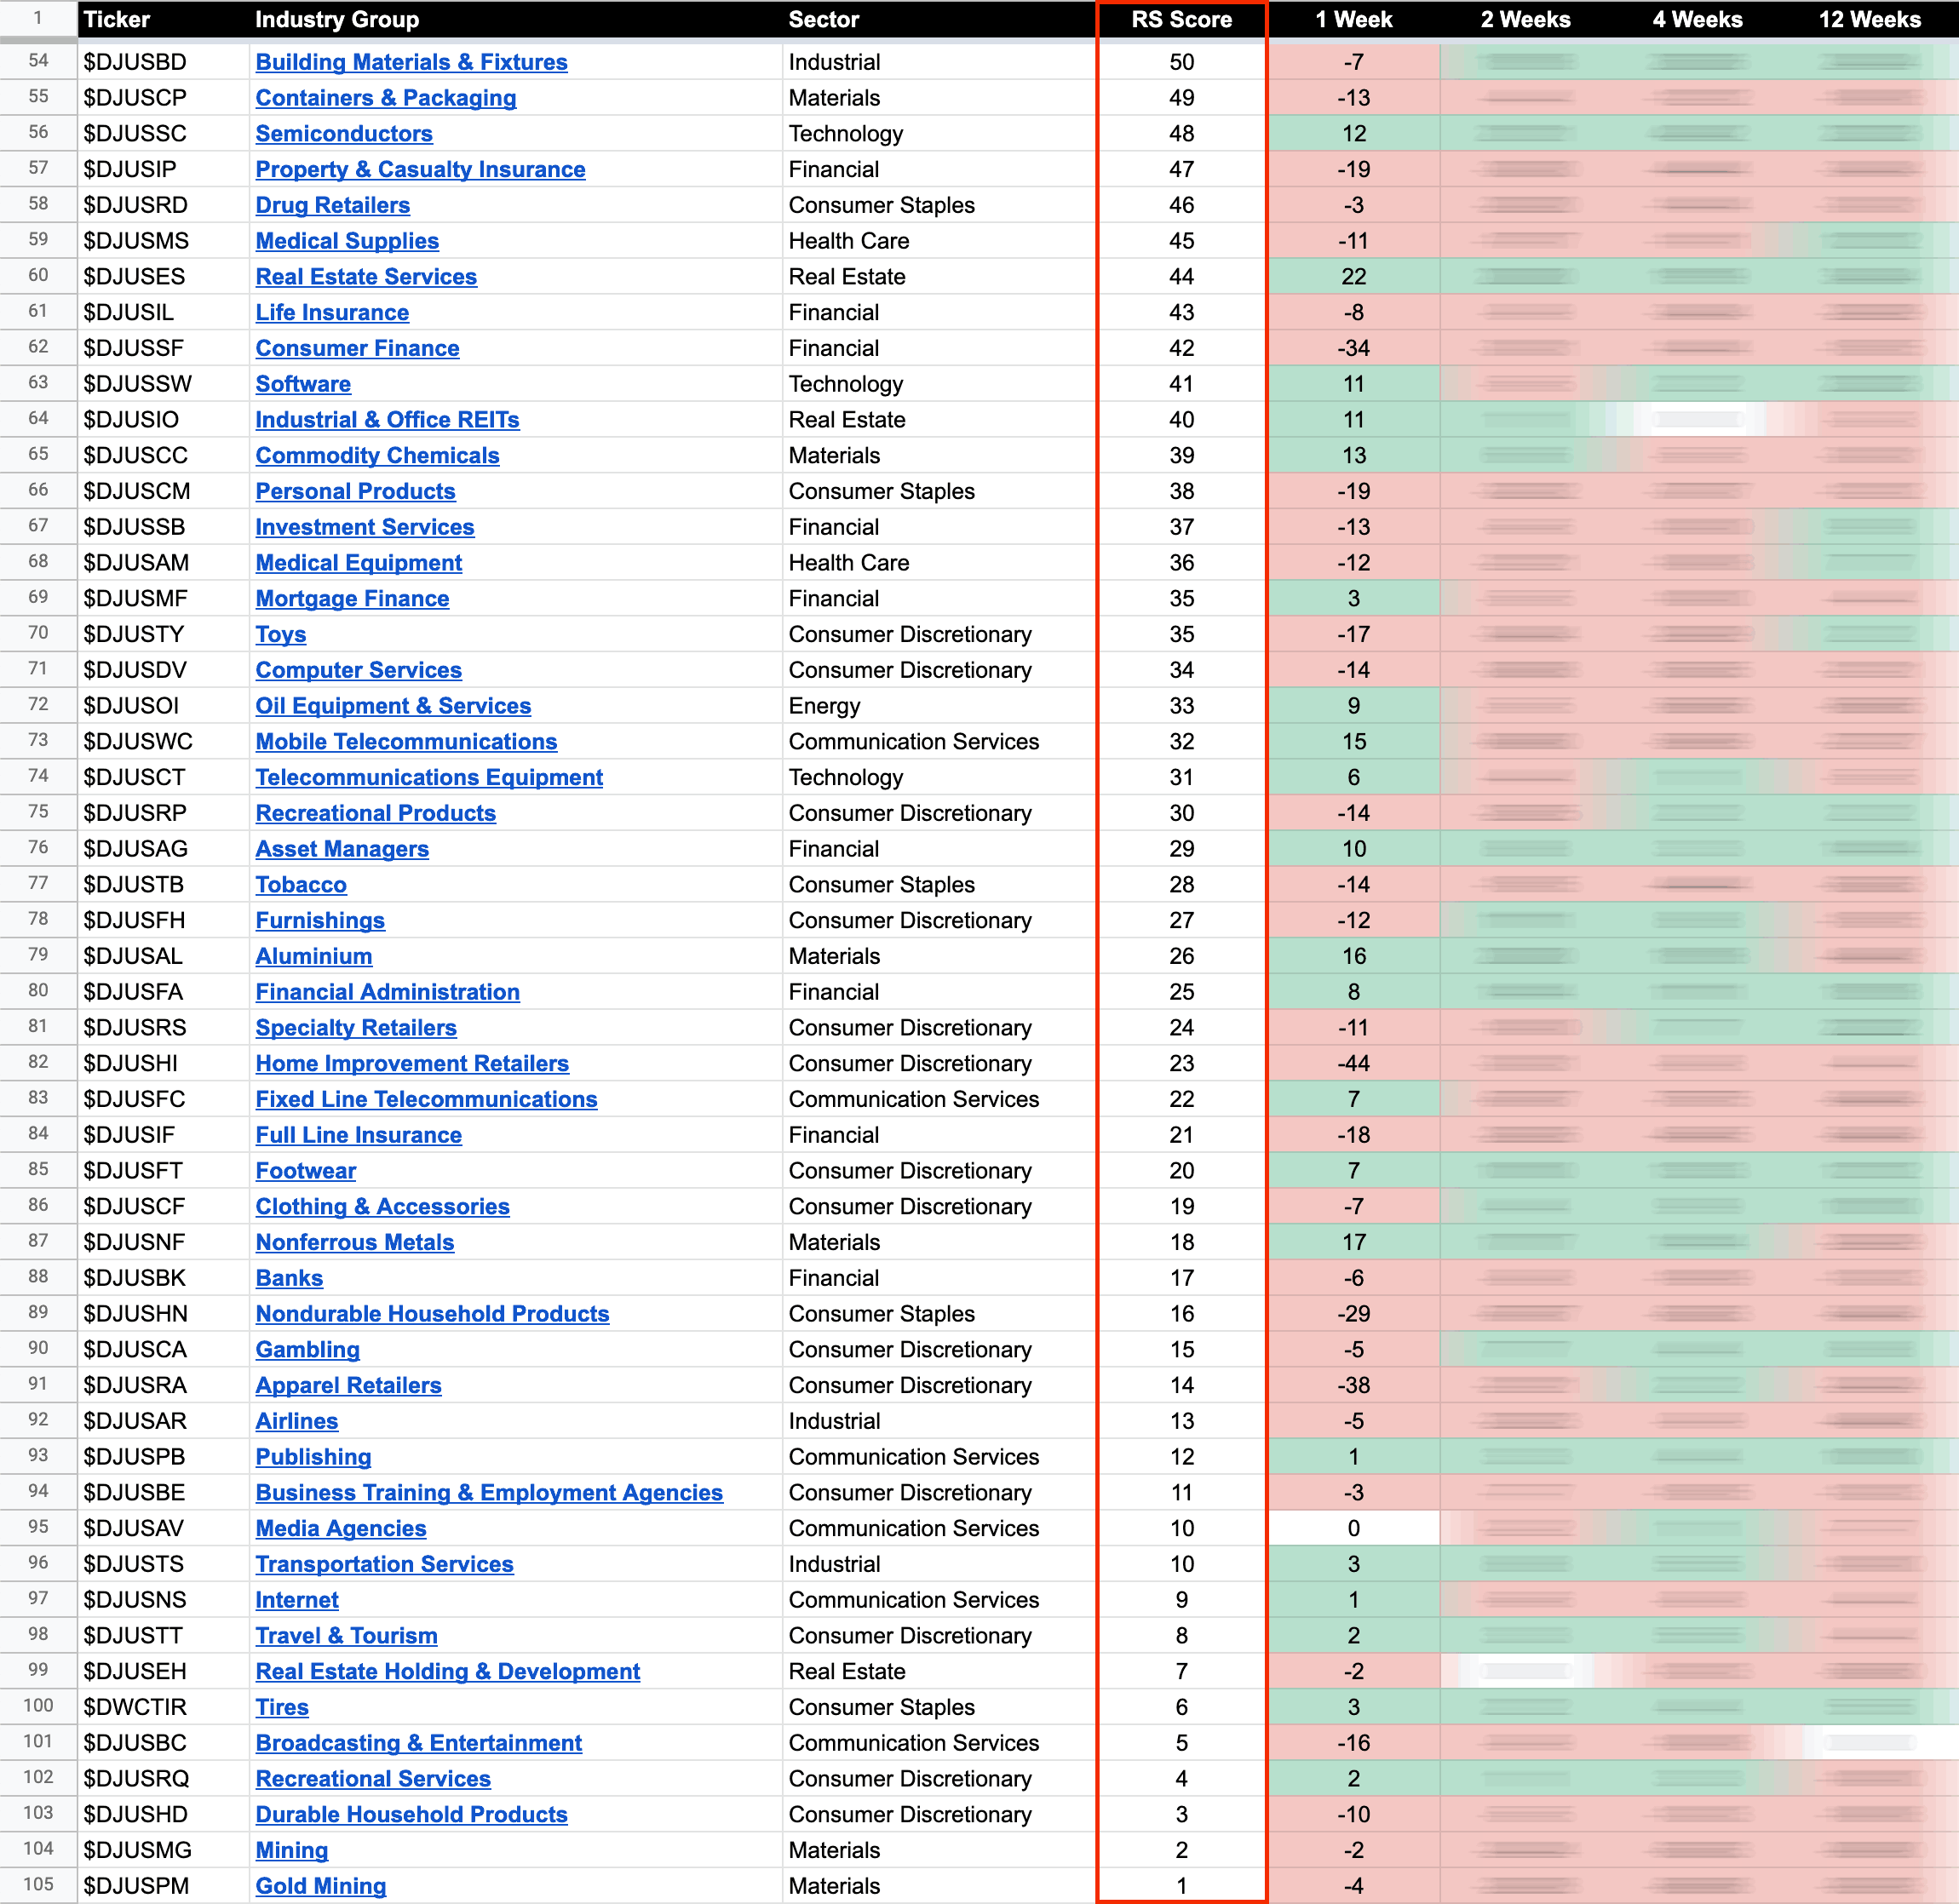
The Gold Mining and Mining groups dropped to the bottom of the RS rankings this week, with both consolidating near the lows, but on the heaviest volume in the last few years, and with gold futures having a fairly strong rebound at the support from the 2021 lows. So an interesting divergence and volume anomaly. So will the mining groups follow gold futures and attempt to rebound from their Stage 4 lows.
104 Dow Jones Industry Groups sorted by Relative Strength
The purpose of the Relative Strength (RS) tables is to track the short, medium and long-term RS changes of the individual groups to find the new leadership earlier than the crowd.
RS Score of 100 is the strongest, and 0 is the weakest.
In the Stage Analysis method we are looking to focus on the strongest groups, as what is strong, tends to stay strong for a long time. But we also want to find the improving / up and coming groups that are starting to rise up strongly through the RS table from the lower zone, in order to find the future leading stocks before they break out from a Stage 1 base and move into a Stage 2 advancing phase.
Each week I go through the most interesting groups on the move in more detail during the Stage Analysis Members weekend video – as Industry Group analysis is a key part of Stan Weinstein's Stage Analysis method.
Become a Stage Analysis Member:
To see more like this and other premium content, such as the regular US Stocks watchlist, detailed videos and intraday posts, become a Stage Analysis member.
Join Today
Disclaimer: For educational purpose only. Not investment advice. Seek professional advice from a financial advisor before making any investing decisions.

