US Stocks Breakouts – Breakdowns in Neutral Position
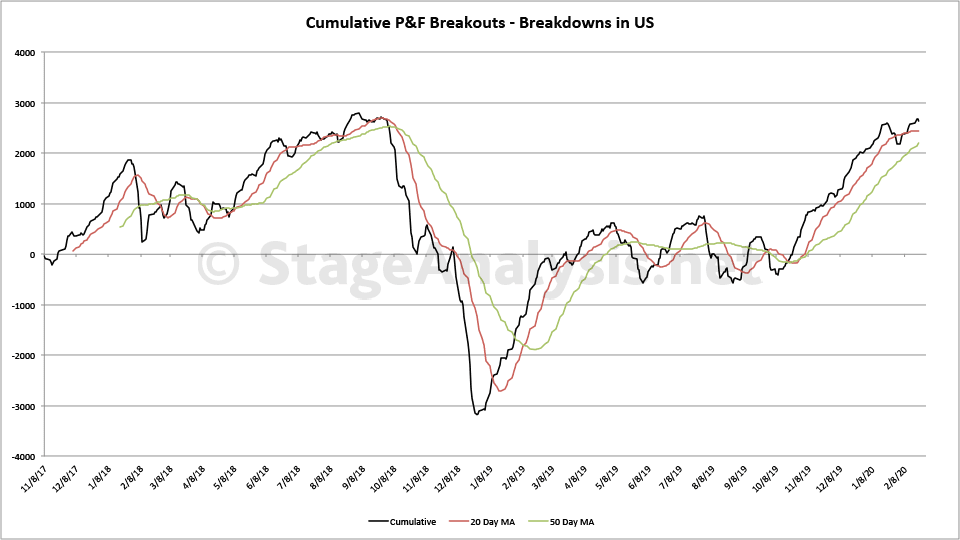
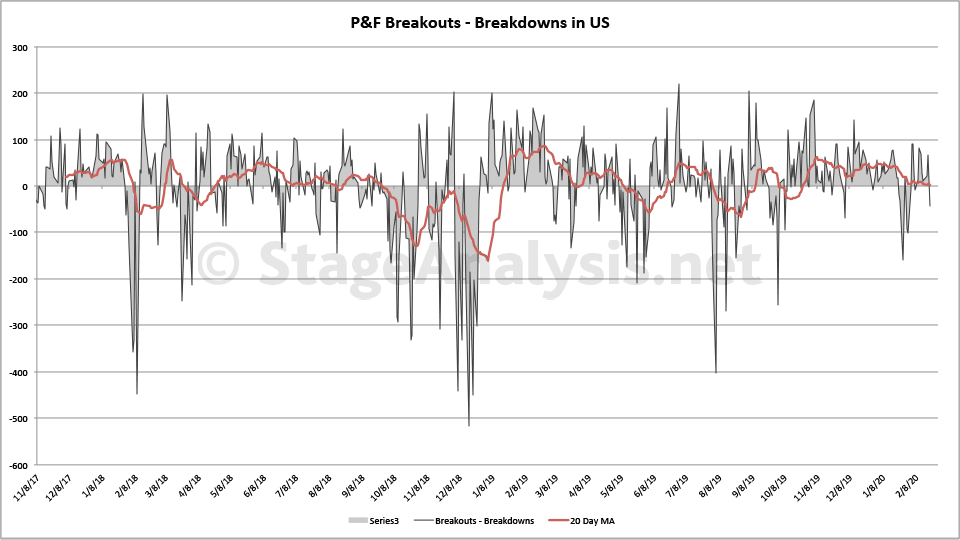
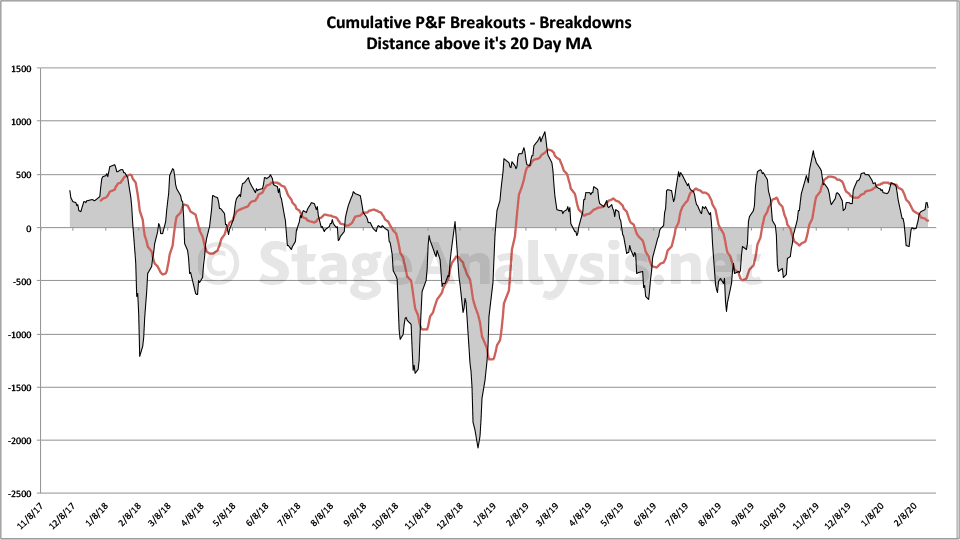
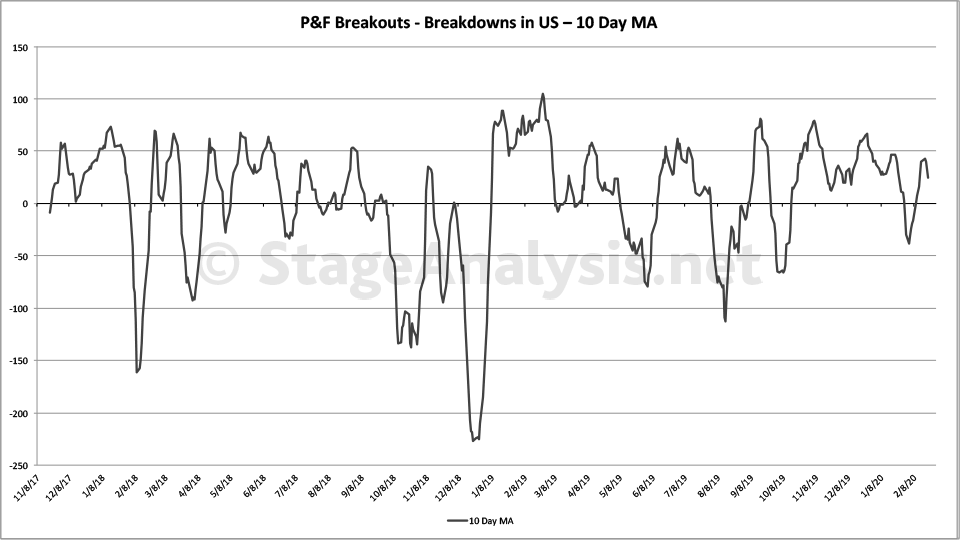
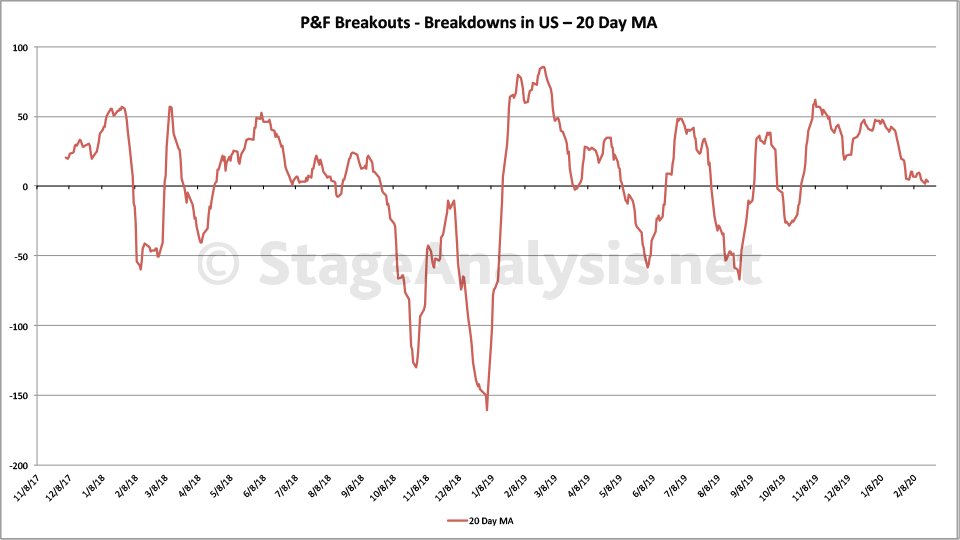
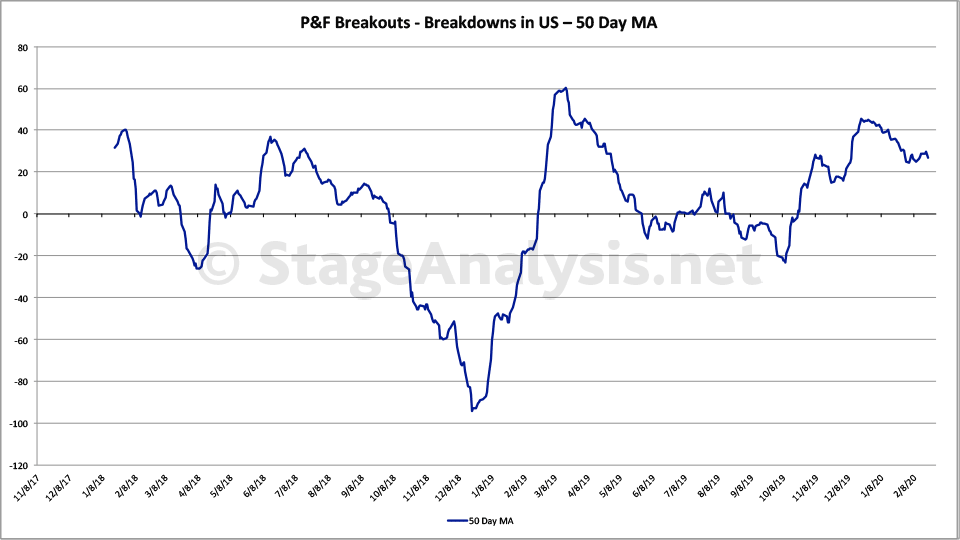
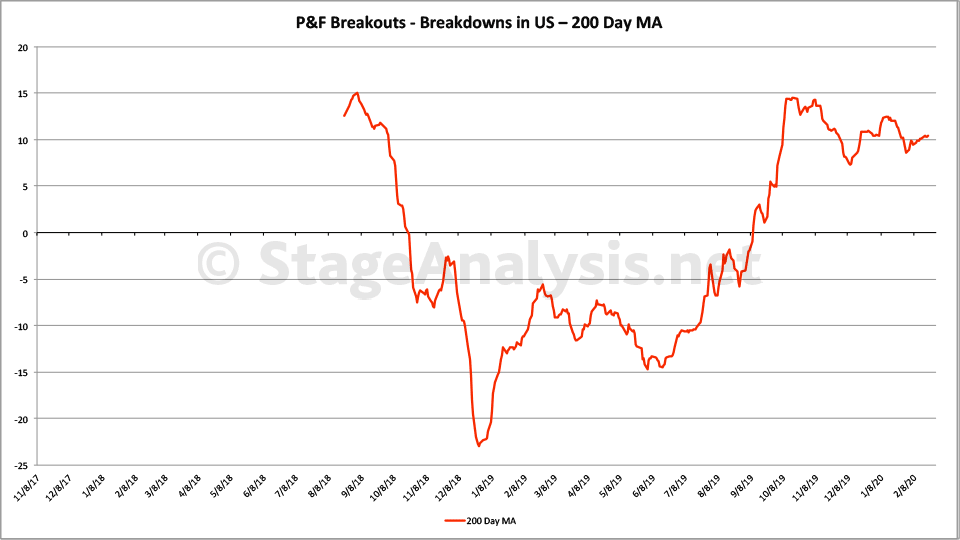
Attached is my updated custom breadth charts that I do based on the daily point and figure double top breakouts and double bottom breakdowns.
Totals for the week:
+279 double top stock breakouts
-223 double bottom stock breakdowns
+56 net stock breakouts - stock breakdowns
Note: The cumulative Stocks Breakouts – Breakdowns moved back to new highs again this week with a gain of +56 stock breakouts - stock breakdowns for the week. However, the short, medium and long term oscillators had a muted response to the cumulative move higher, and are so are starting to show a divergence. Which is a warning sign, and hence suggests caution here, until we have a definitive move.
Disclaimer: For educational purpose only. Not investment advice. Seek professional advice from a financial advisor before making any investing decisions.

