Market Breadth: Percentage of Stocks Above their 50 Day, 150 Day & 200 Day Moving Averages Combined
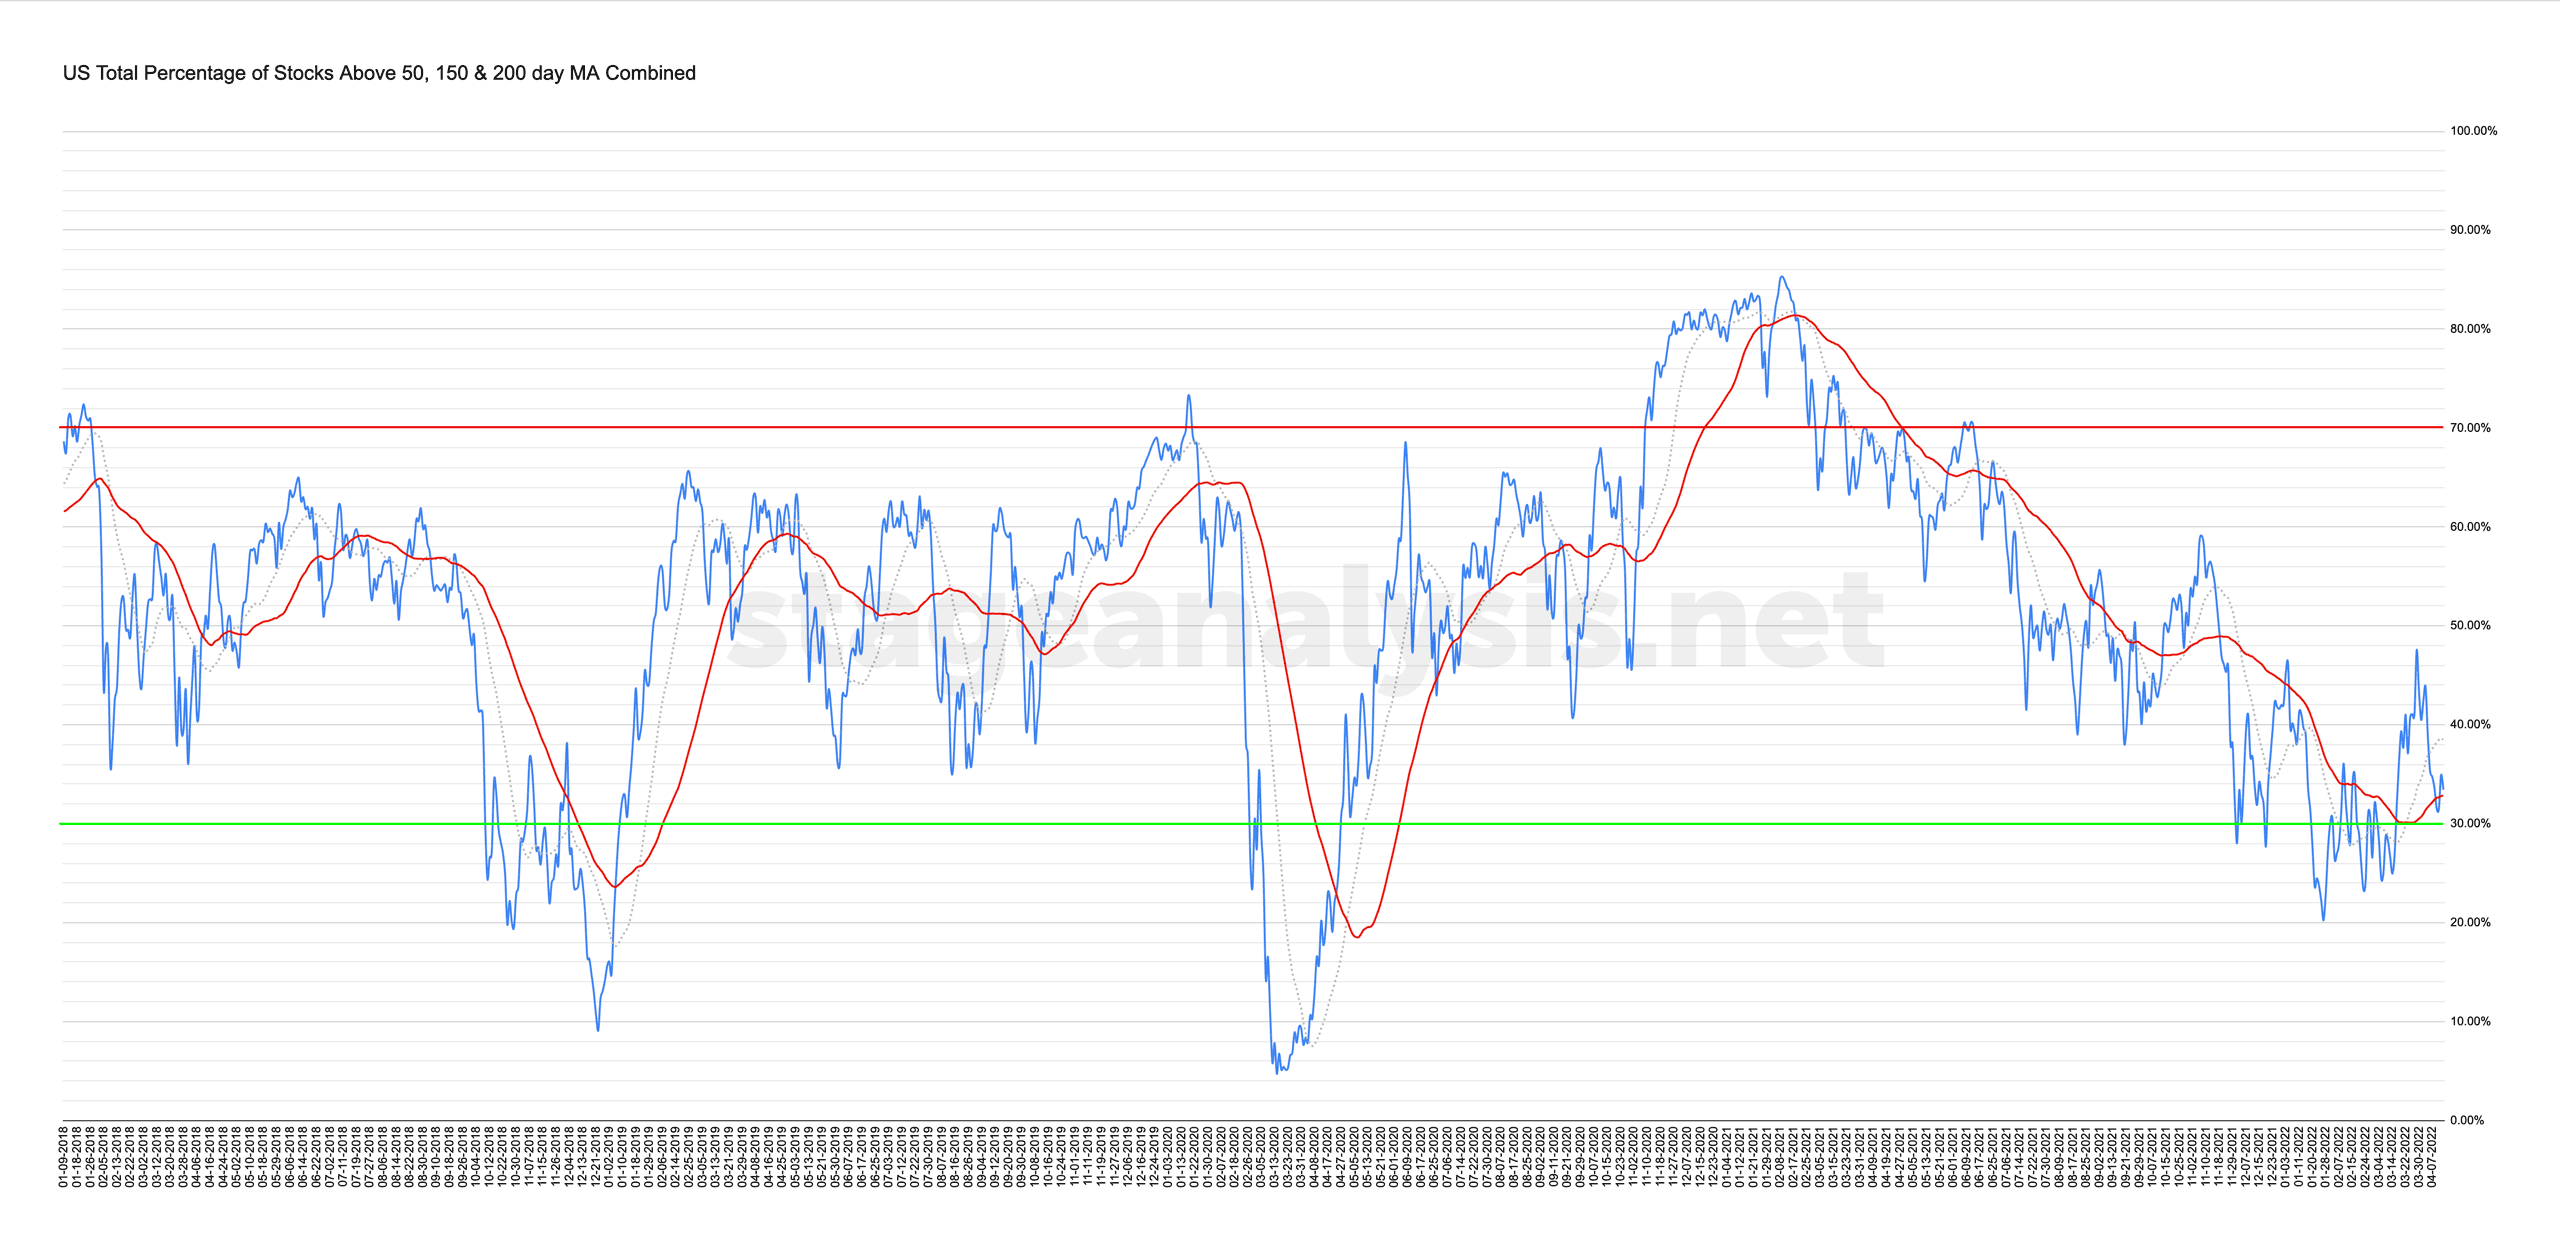
33.44% (-0.20% 1wk)
Status: Neutral Environment
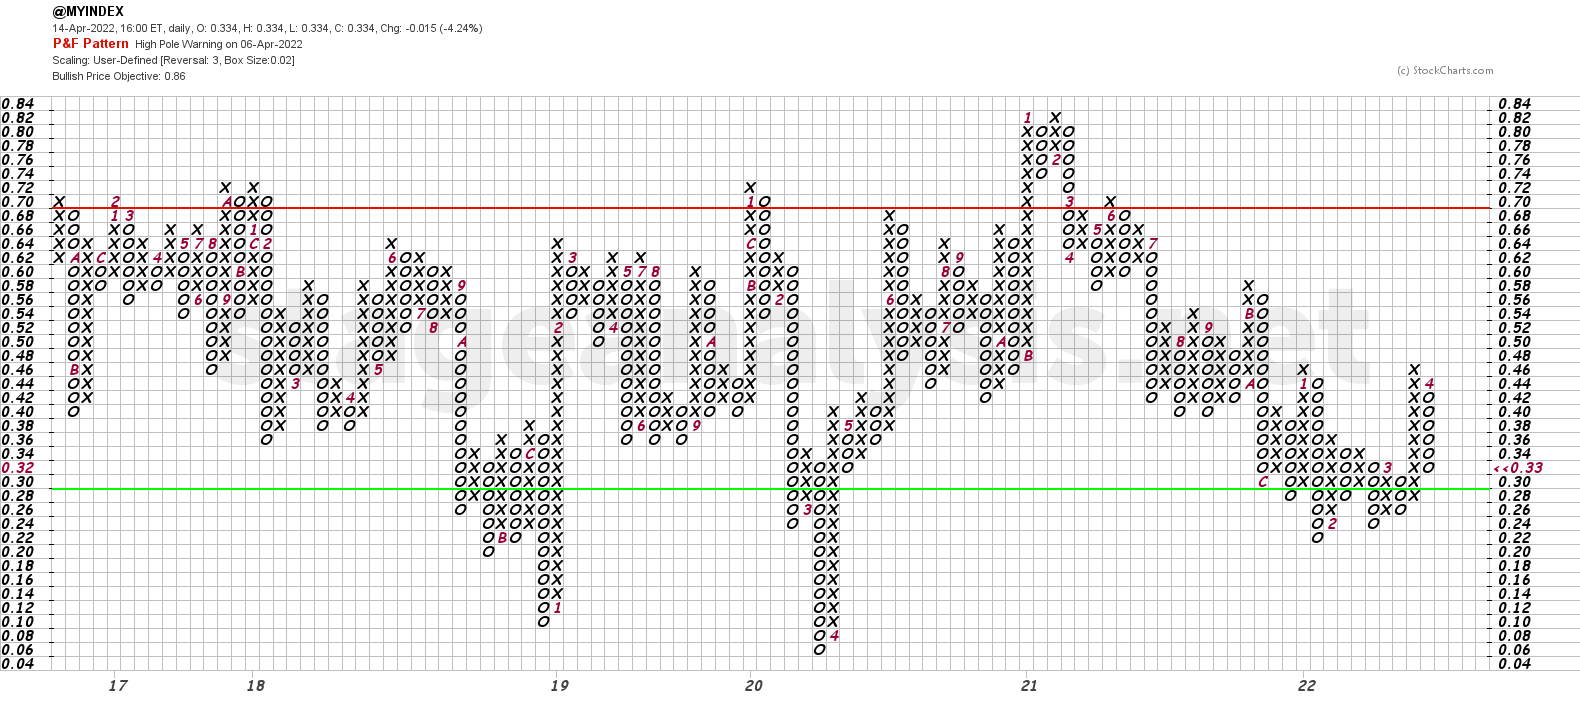
The US Total Percentage of Stocks Above their 50 Day, 150 Day & 200 Day Moving Averages Combined chart dipped below its own 50 day MA on Monday, but managed to recover back above it on Wednesday. However, it still remains below its own 20 day MA, and the P&F chart added a further O to its current column. And so it remains on Defensive Posture with a Neutral Environment status.
Strategy:
Neutral Environment with P&F column in Os in the Stage 4 percentage zone
- Defensive Posture
- Hold leaders (strong RS) stocks in strong / improving groups
- Sell laggards (weak RS) stocks in weak groups on rallies
- Progressive Exposure – only increase exposure if making progress – i.e. if you aren't making progress 25% invested, then don't get more exposed than that
- Build a focus list in select groups (i.e. start looking for future leading stocks candidates in groups with stocks starting to base in Stage 1 to monitor in the coming months. Remember the best bases for the strongest Stage 2 advances need 6 months+ in most cases to develop
- Focus on risk management
- Risk remains very high, so caution seems prudent.
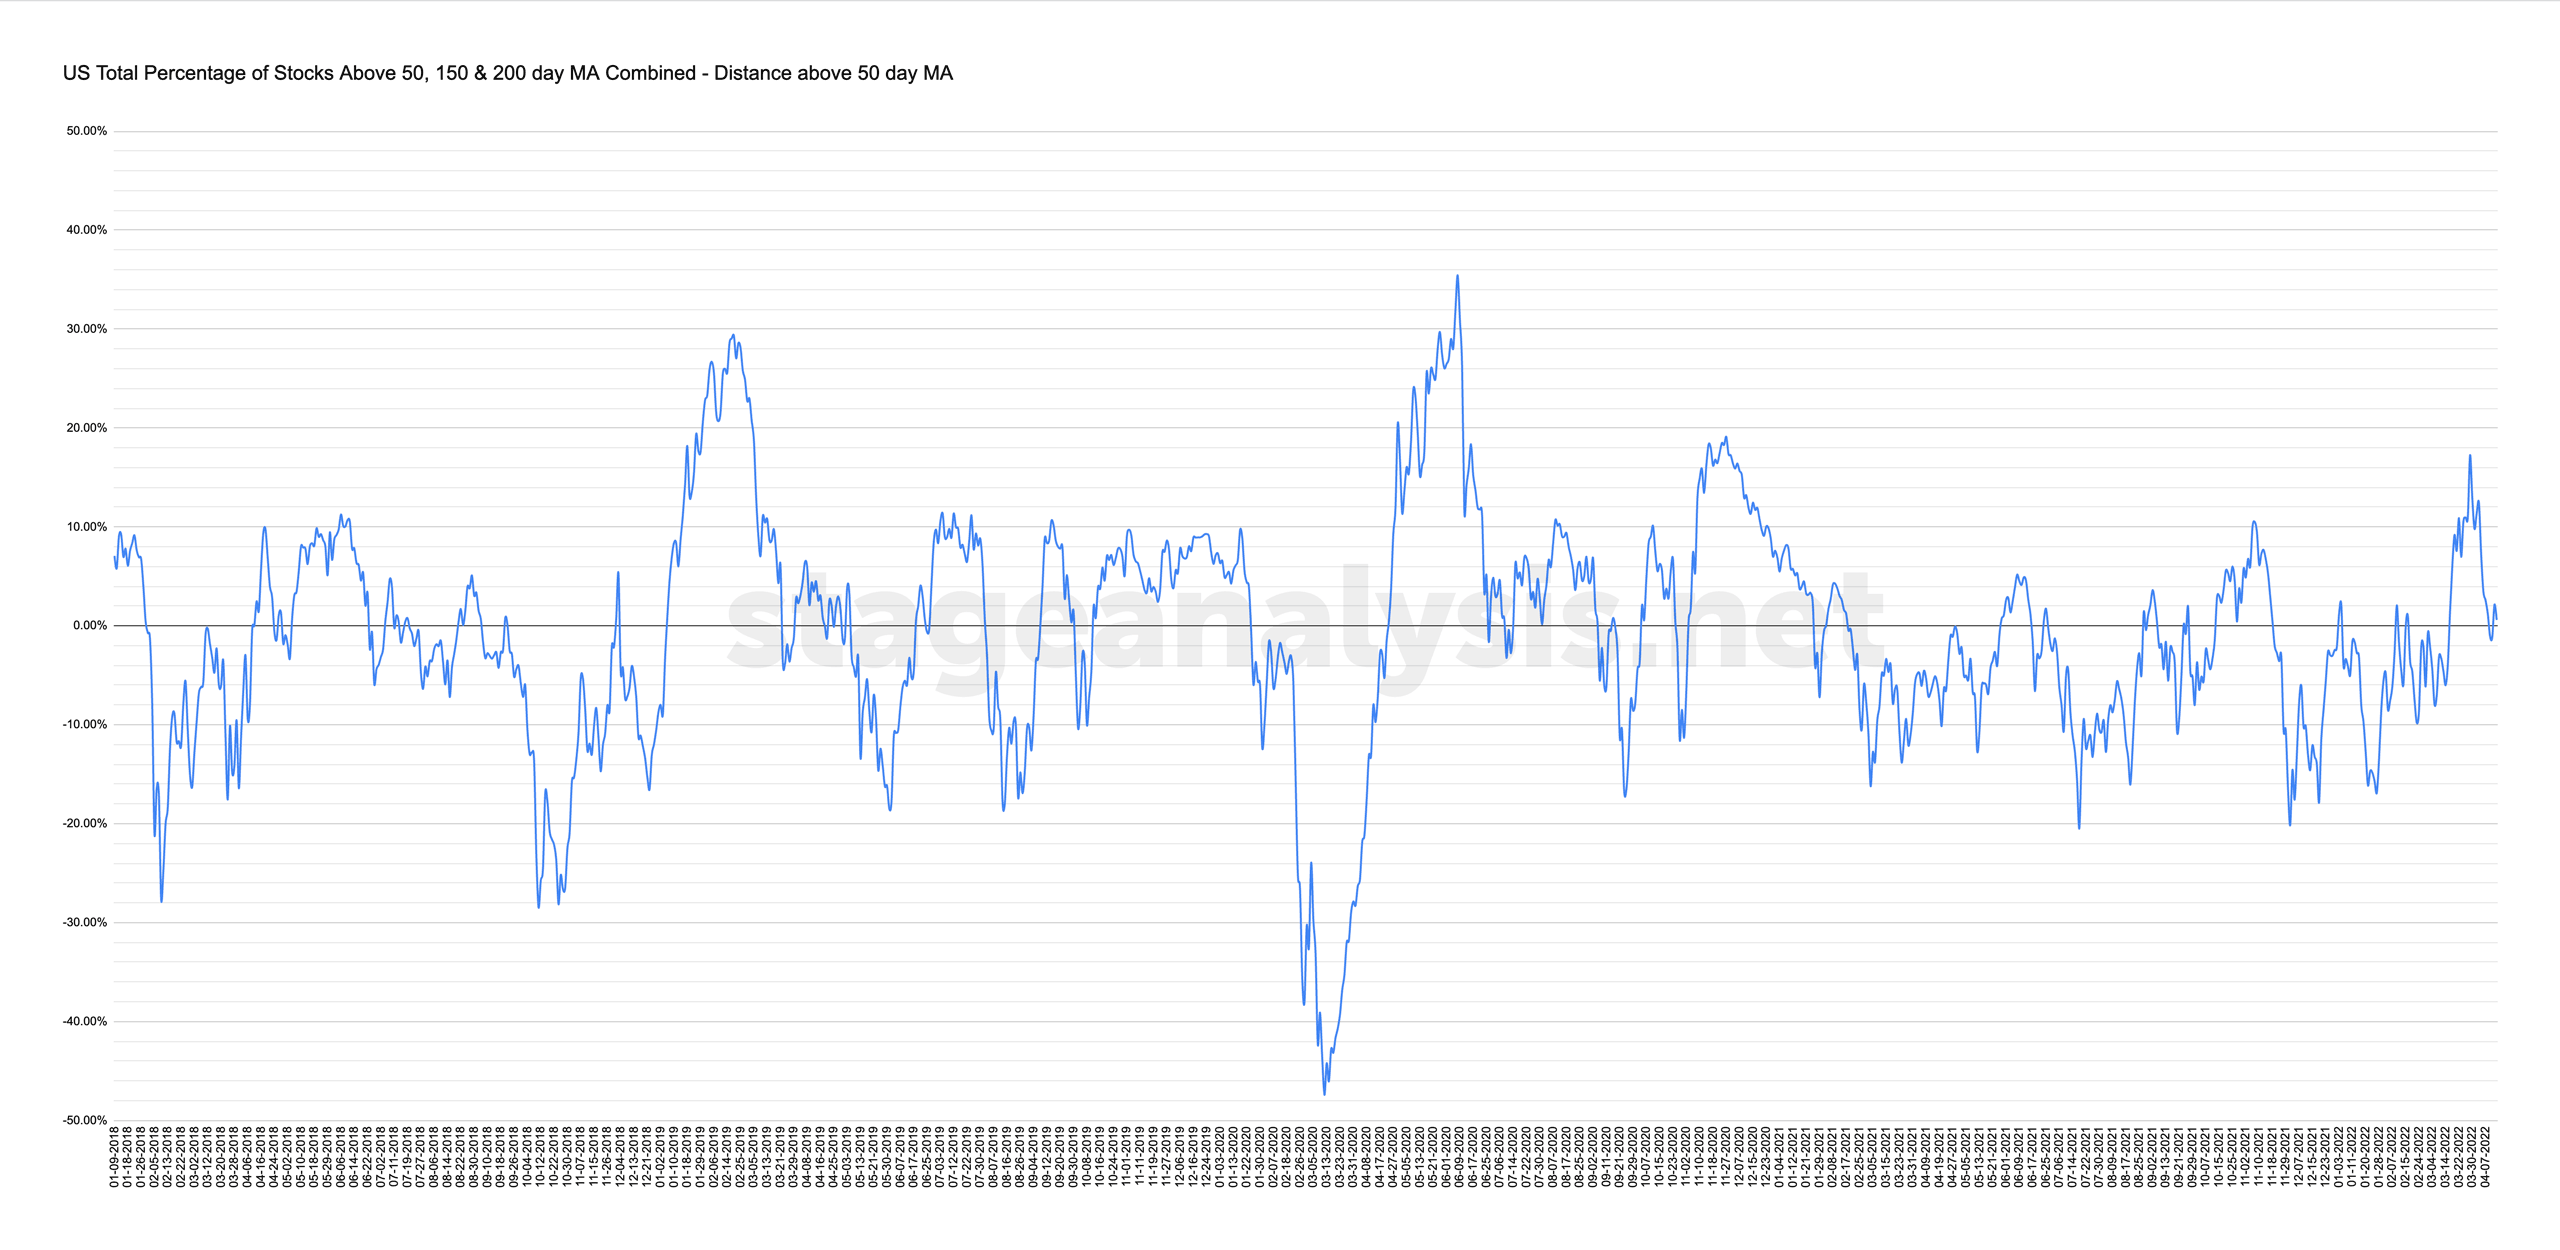
20 and 50 day Oscillator
These show the distance that the combined chart is from the 20 day MA and 50 day MA on the chart. Above the zero is positive environment and below is a difficult / negative environment
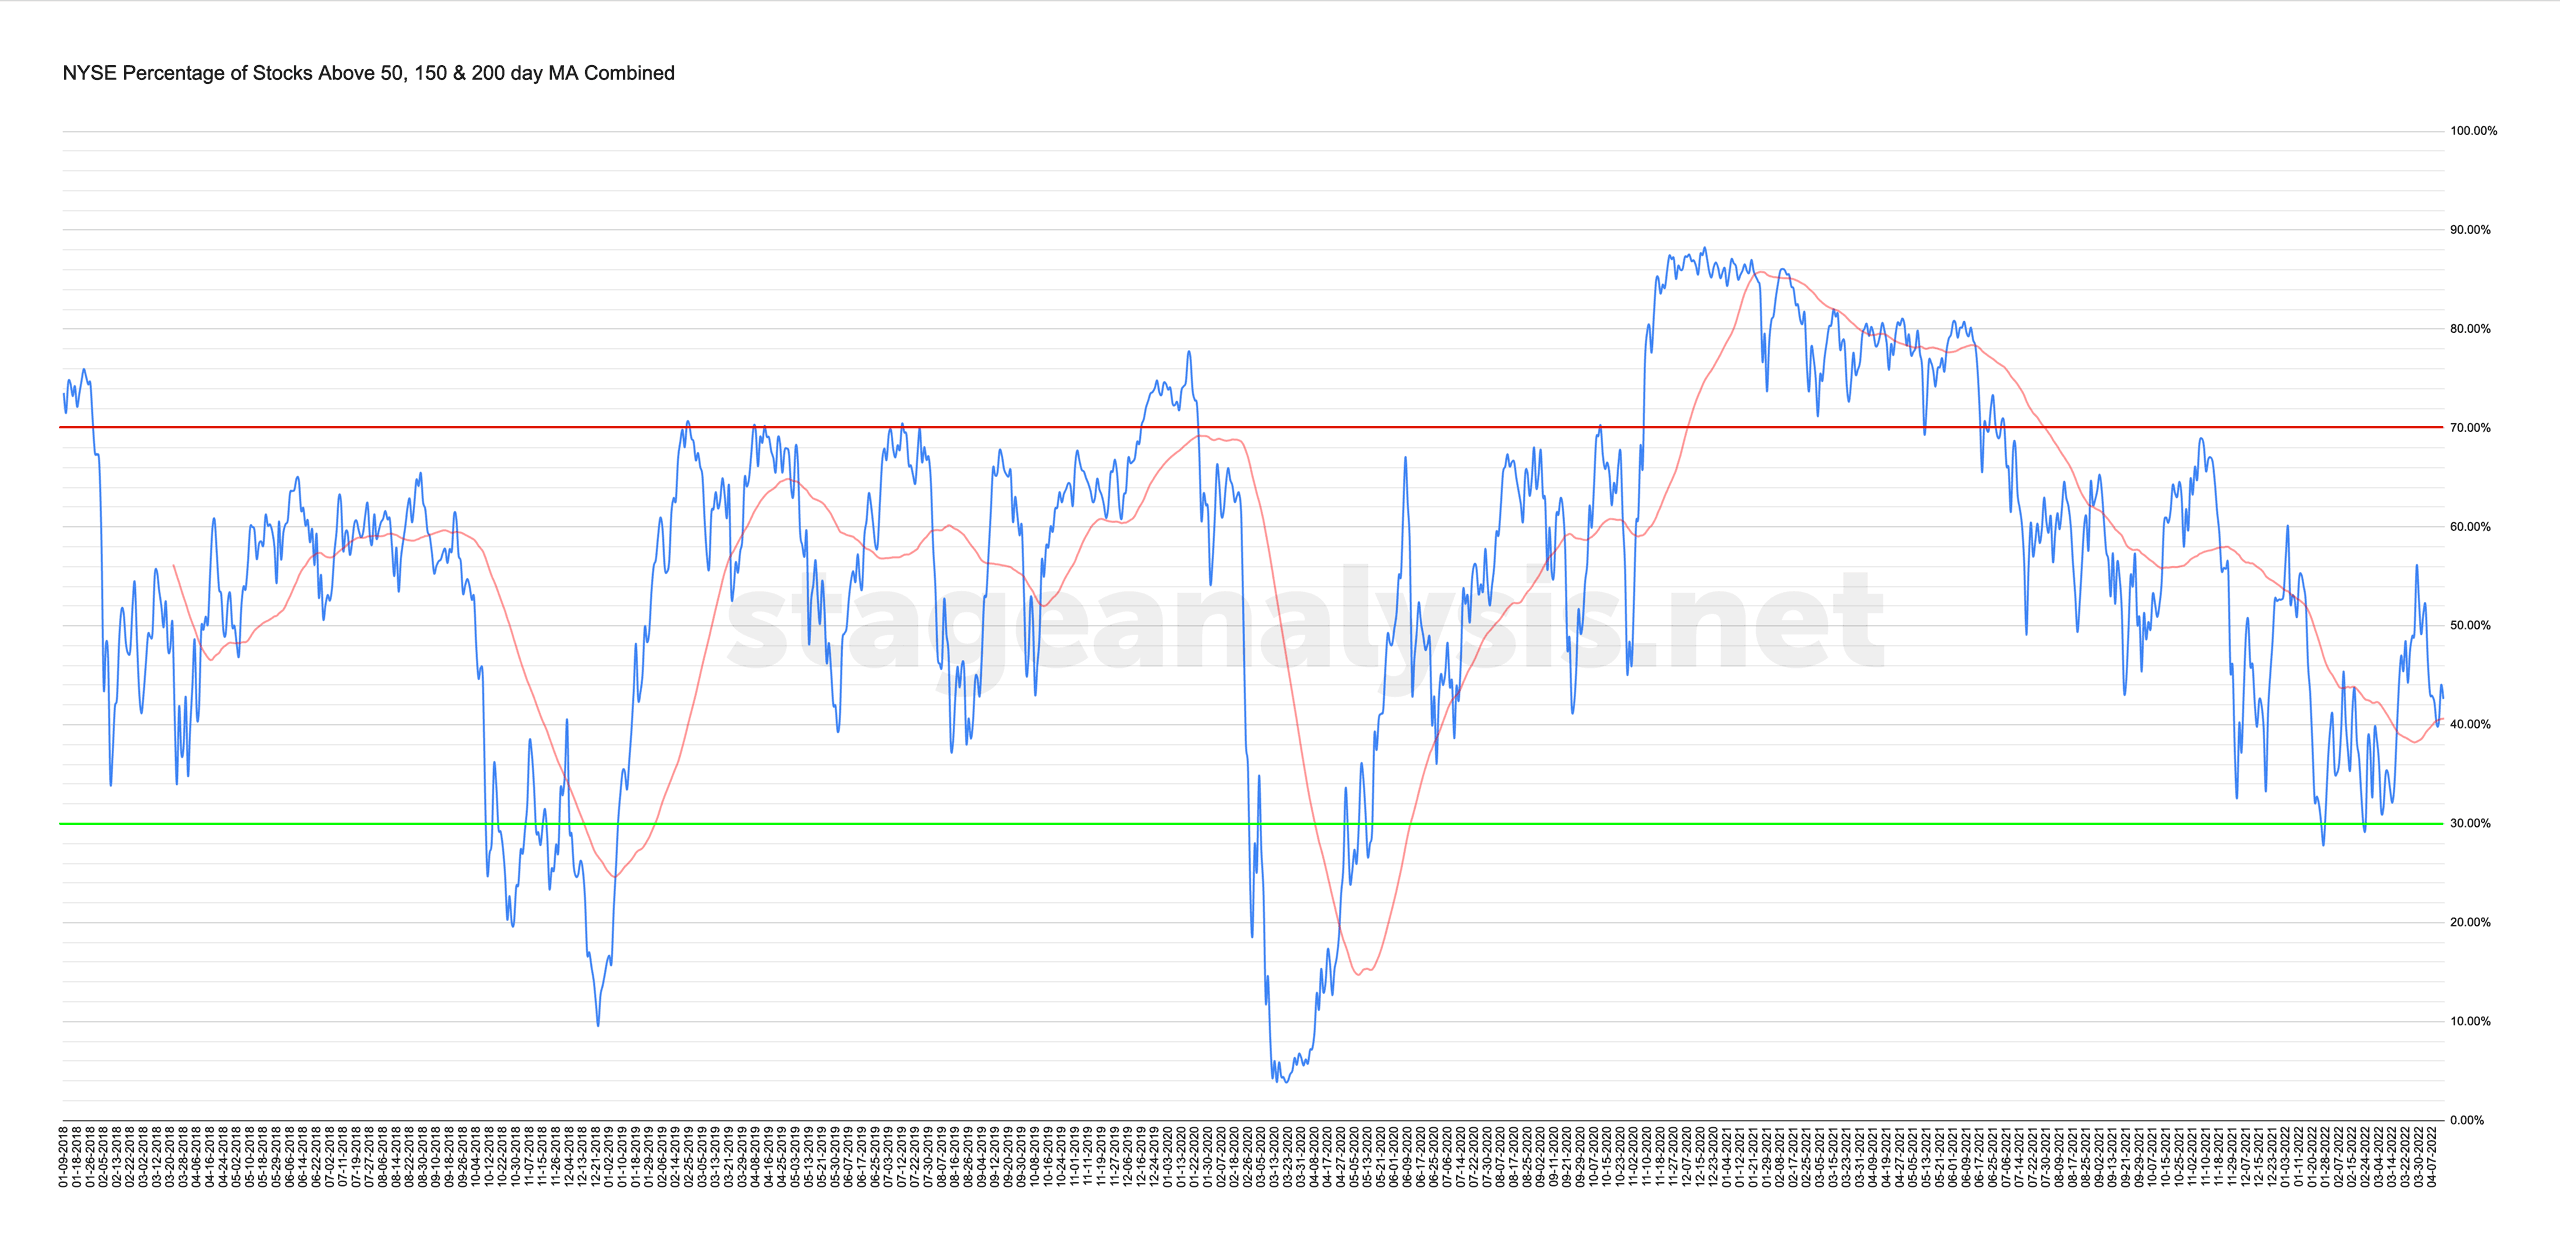
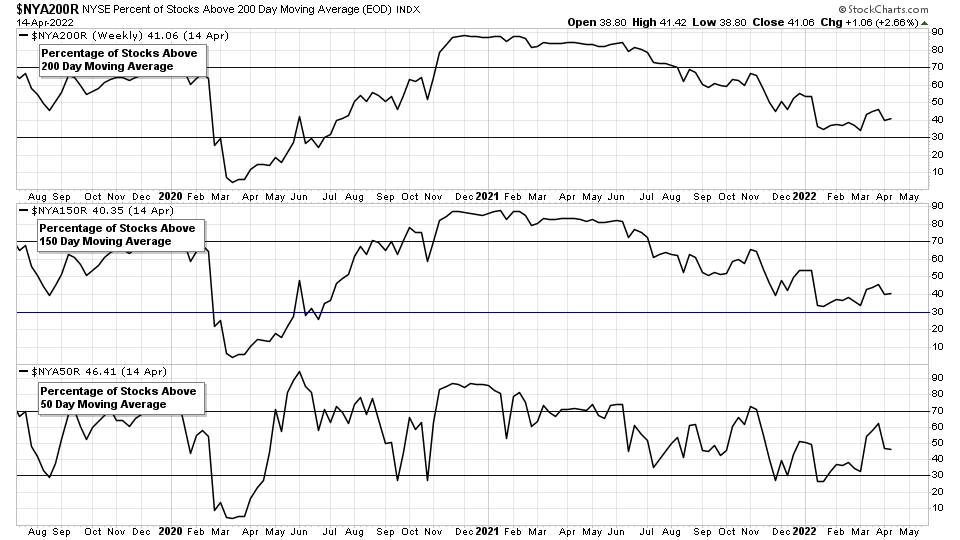
NYSE Total % Stocks Above their 50 Day, 150 Day & 200 Day Moving Averages Combined
- Long Term: Stocks Above 200 Day MA: 41.06%
- Medium Term: Stocks Above 150 Day MA: 40.35%
- Short Term: Stocks Above 50 Day MA: 46.41%
42.61% (+0.35% 1wk)
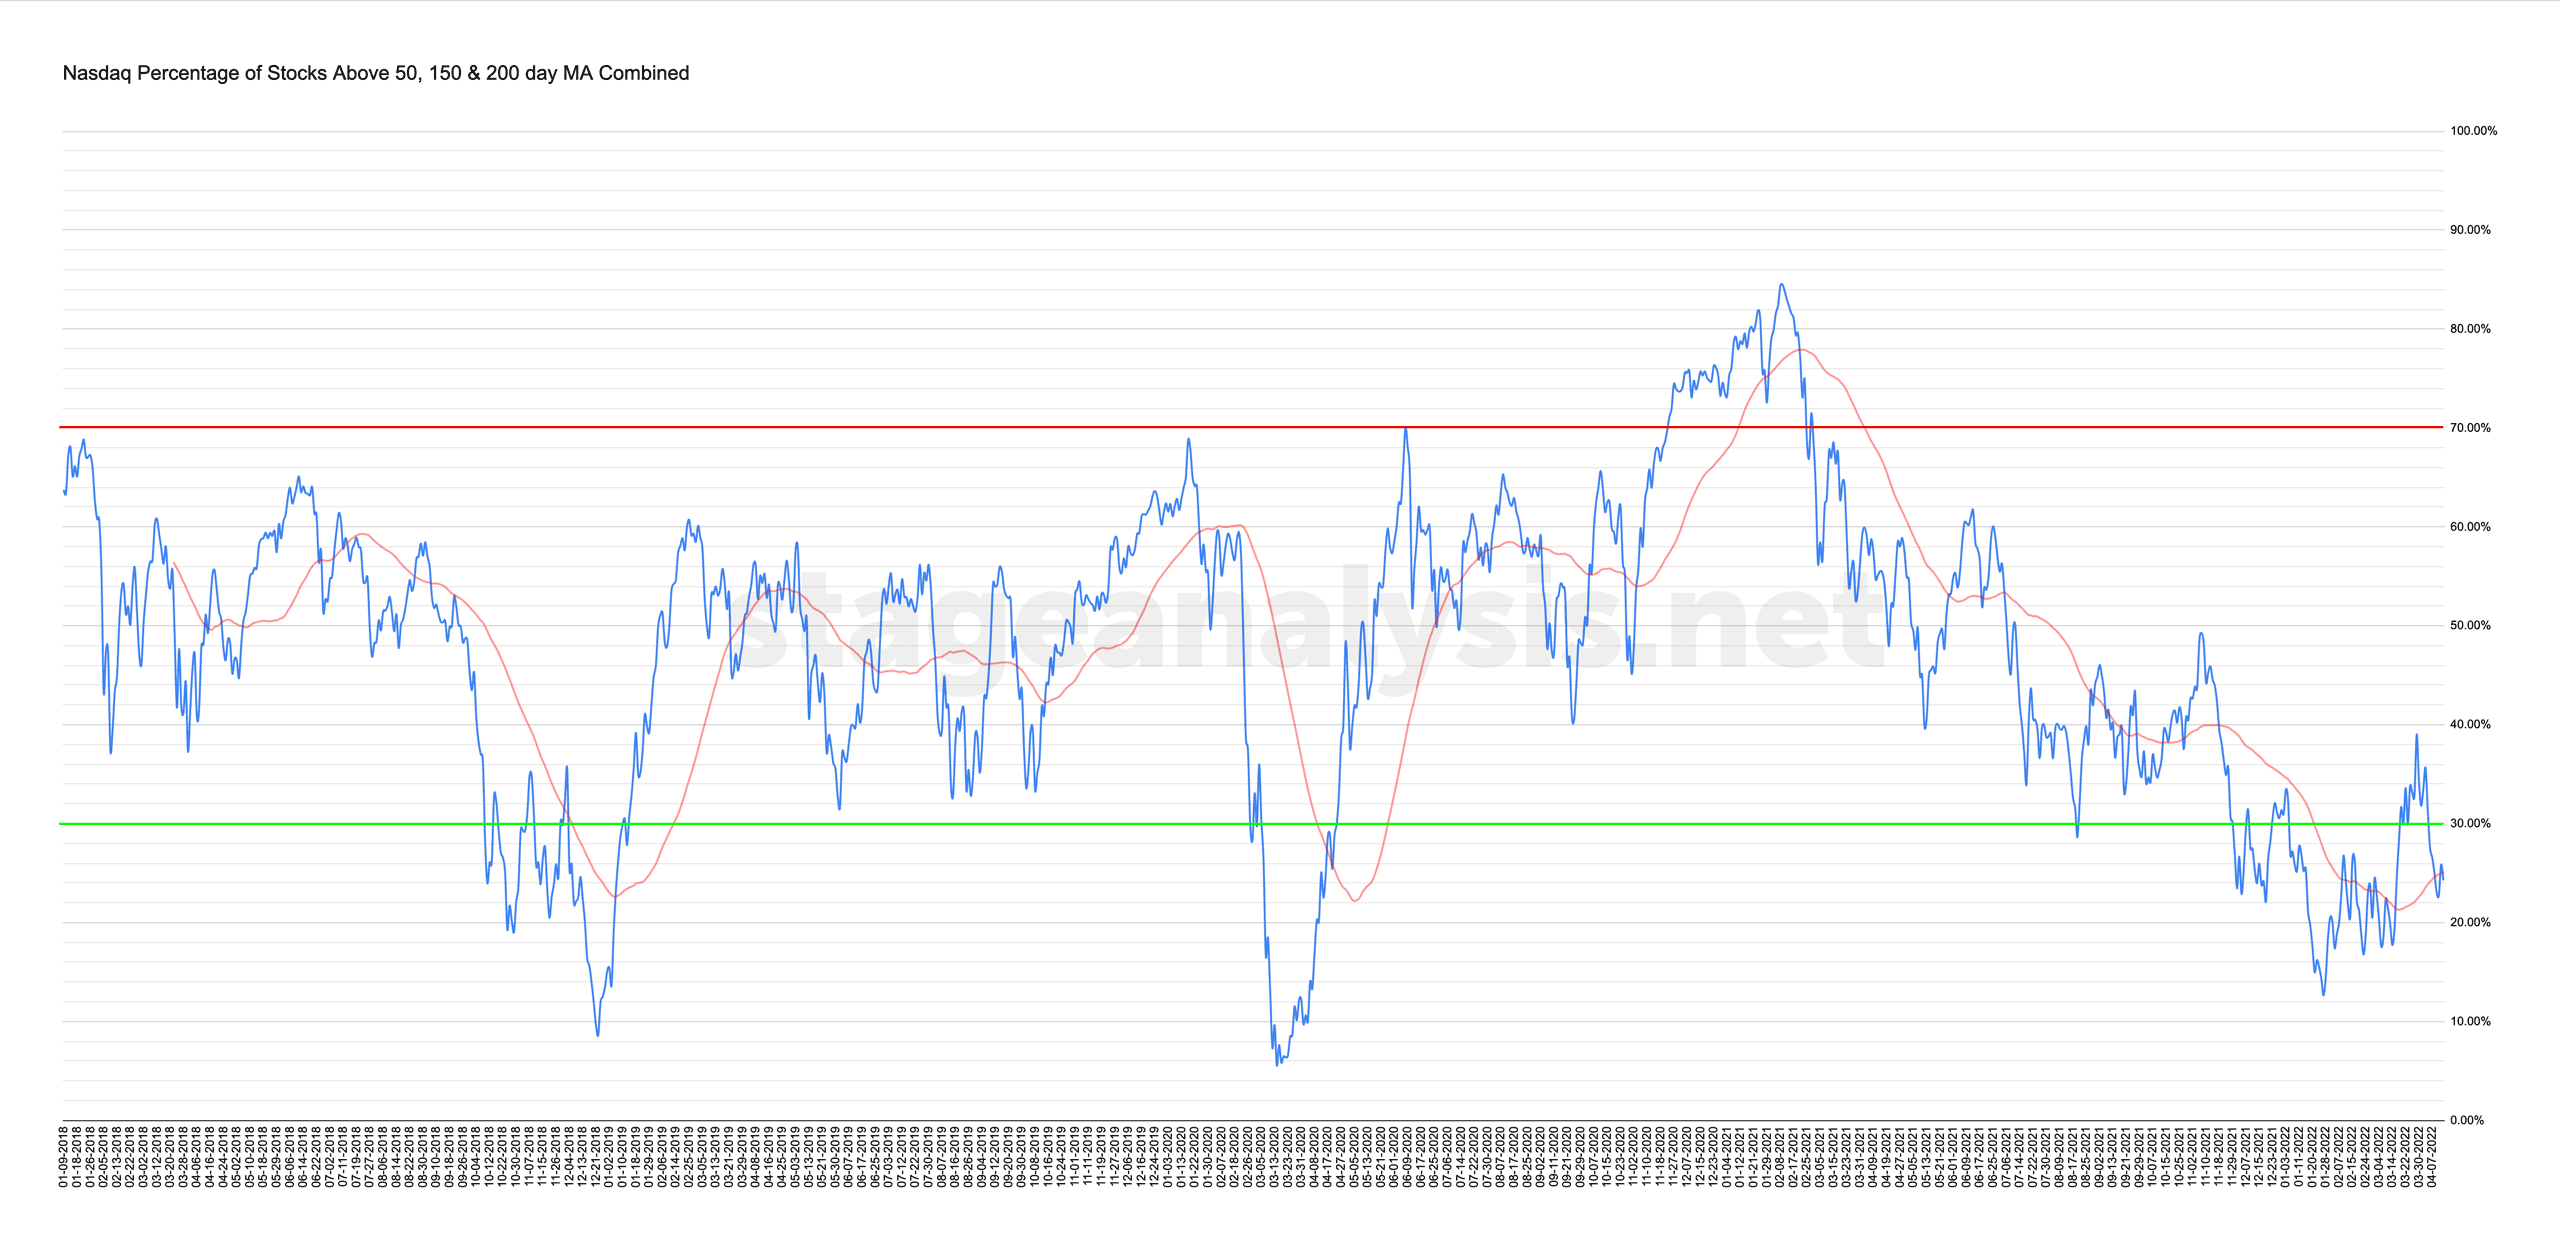
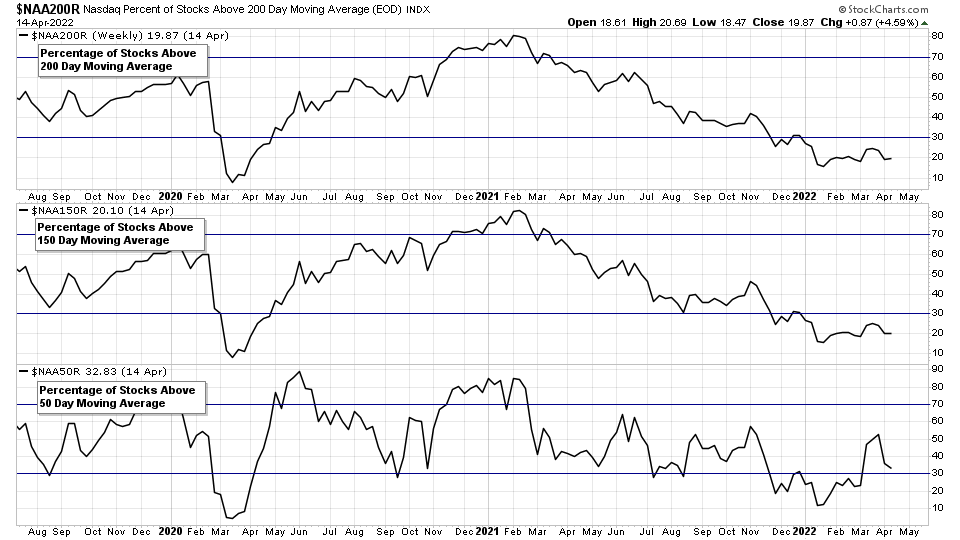
Nasdaq Total % Stocks Above their 50 Day, 150 Day & 200 Day Moving Averages Combined
- Long Term: Stocks Above 200 Day MA: 19.87%
- Medium Term: Stocks Above 150 Day MA: 20.10%
- Short Term: Stocks Above 50 Day MA: 32.83%
24.27% (-0.76% 1wk)
Become a Stage Analysis Member:
To see more like this and other premium content, such as the regular US Stocks watchlist, detailed videos and intraday posts, become a Stage Analysis member.
Join Today
Disclaimer: For educational purpose only. Not investment advice. Seek professional advice from a financial advisor before making any investing decisions.

