Bullish Percent Index and Moving Average Breadth Indicators Update - NYSE, Nasdaq and S&P 500
Bullish Percent Index - NYSE, Nasdaq and S&P 500
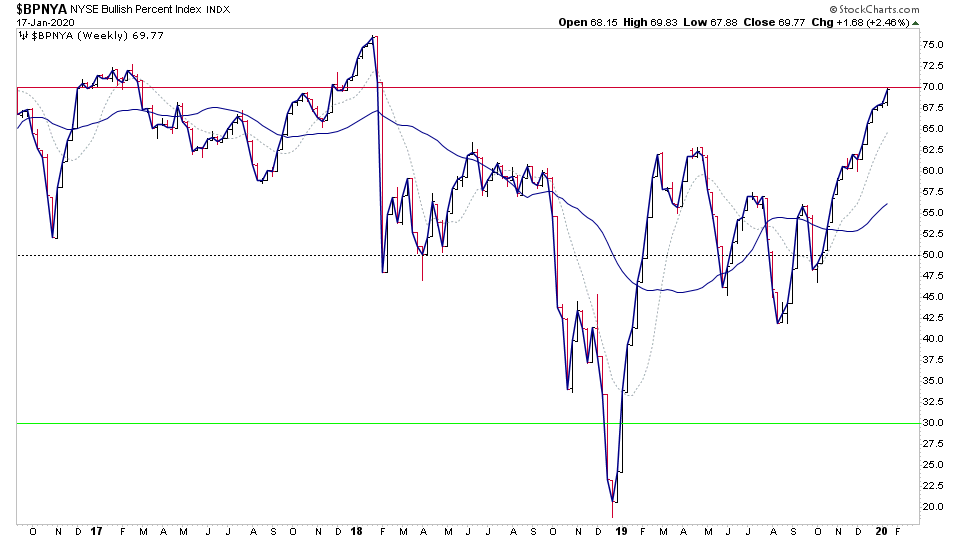
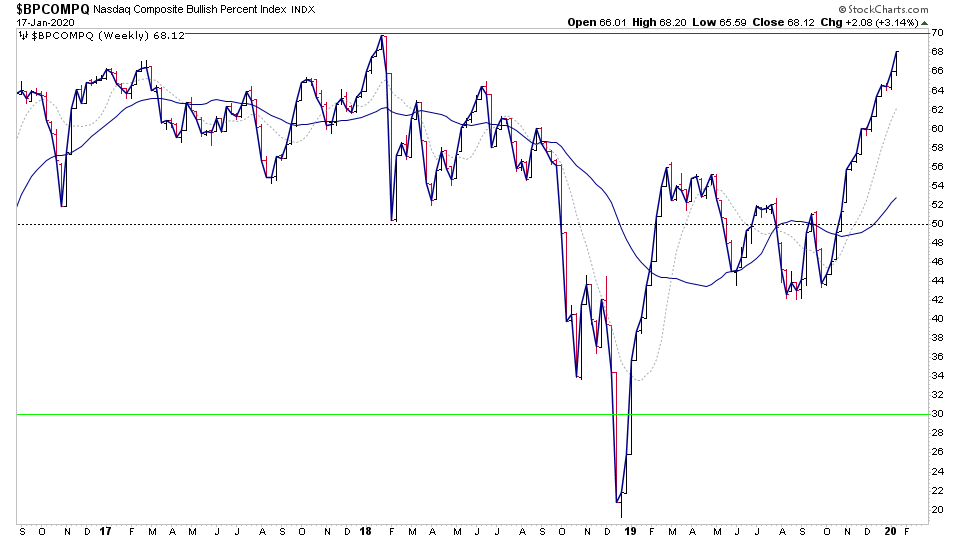
The NYSE Bullish Percent Index, sometimes referred to as the head coach closed just below the key 70% level for the first time since the breakdown in early 2018 this week. So although it's moving towards the upper zone, it's not yet oversold by any means, and the Nasdaq is in a similar position just below the key 70% level also.
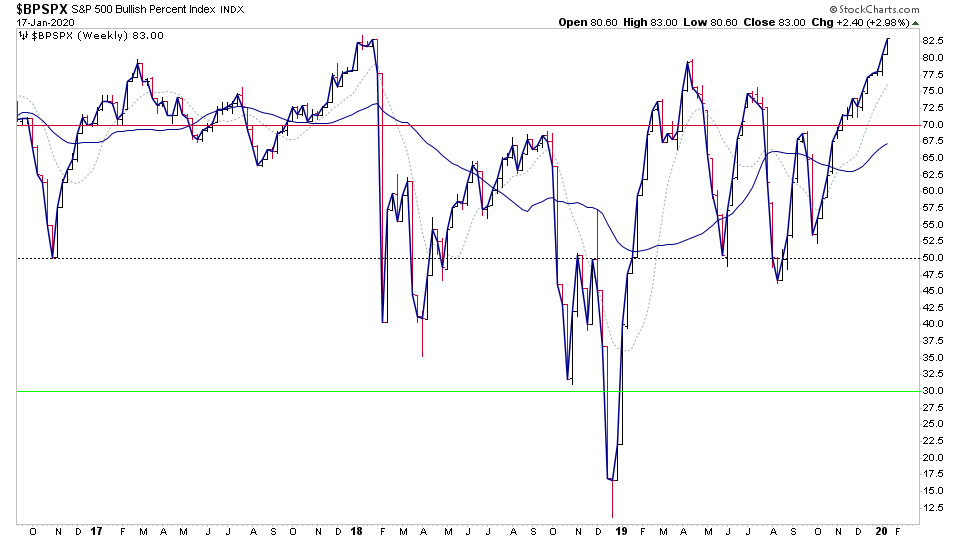
The S&P 500 Bullish Percent Index however, is running hot and has reached a lofty 83% this week which puts it well into the upper zone, and so I'll be watching this one closely, as it's rare for it to stay at extreme levels for long and it often tops out in the mid to high 80s.
So what does that mean? The broad market NYSE and Nasdaq Bullish Percent Indexes are at bull market levels but not extreme levels. Whereas the S&P 500 Bullish Percent Index is near to its historic highs. For me that says that we are getting near to a point where the large caps historically would need at least a consolidation period, but that the broad market still has plenty of room due to the underperformance of the small caps. Hence rotation maybe?
Moving Average Breadth Indicators - NYSE, Nasdaq and S&P 500
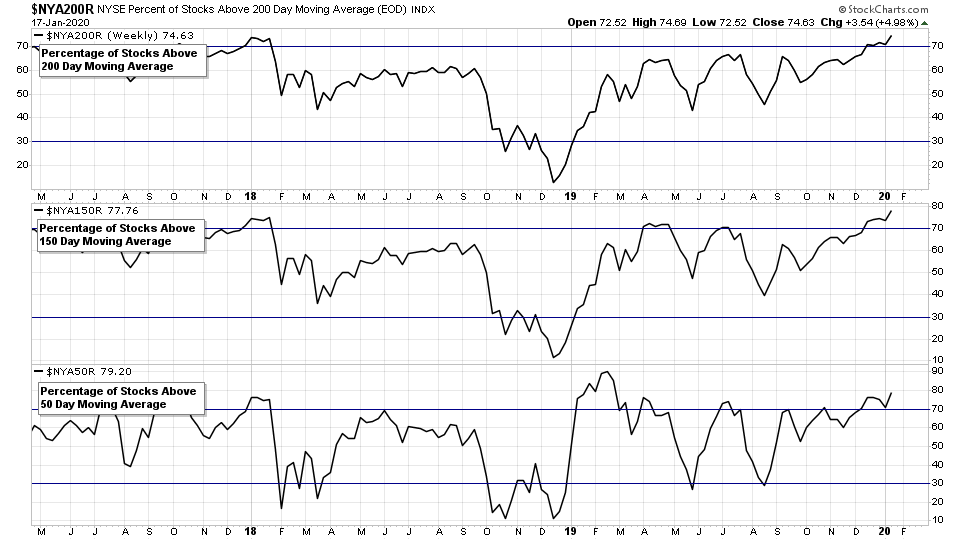
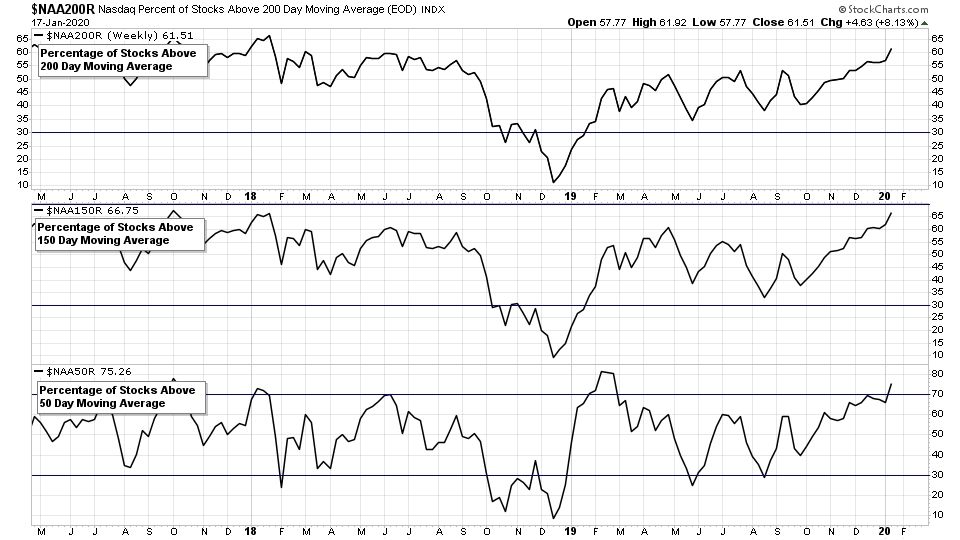
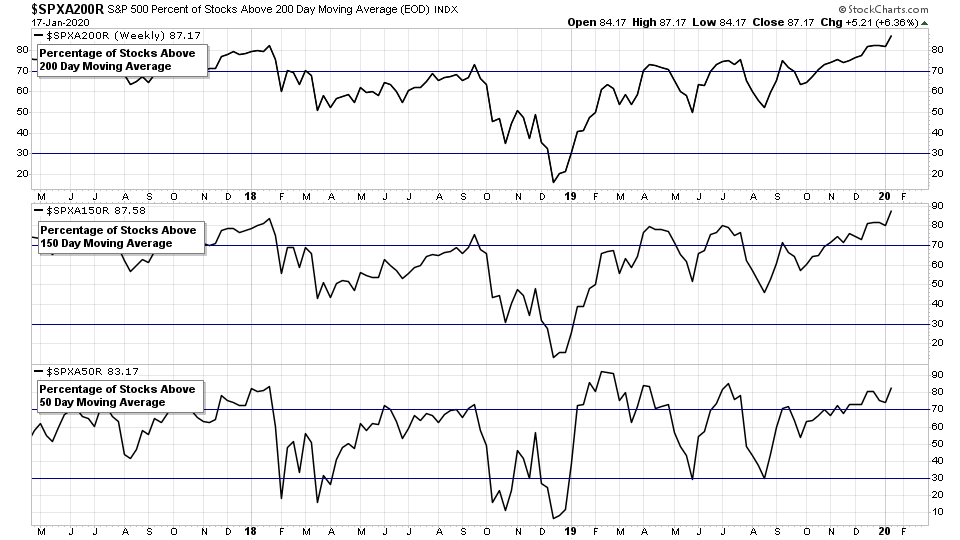
In the moving average breadth indicators we see a slightly different picture, as the NYSE and S&P 500 moving average breadth indicators have all been moving strongly higher and are near the top of normal ranges. However, the Nasdaq market has struggled in comparison, and is only just moving clearly into the bull range above 60% for the first time since 2018 in the 200 day MA and 150 day MA indicators, and so still has plenty of room to move higher, as it made it above 80% in both 2003 and 2009, and got above 70% in 2013. Although in the last two years it's stayed below the 70% level at each of the market highs.
Disclaimer: For educational purpose only. Not investment advice. Seek professional advice from a financial advisor before making any investing decisions.

