
Percentage of Stocks Above their 50 Day, 150 Day & 200 Day Moving Averages Combined – Status change to Neutral / Positive Environment
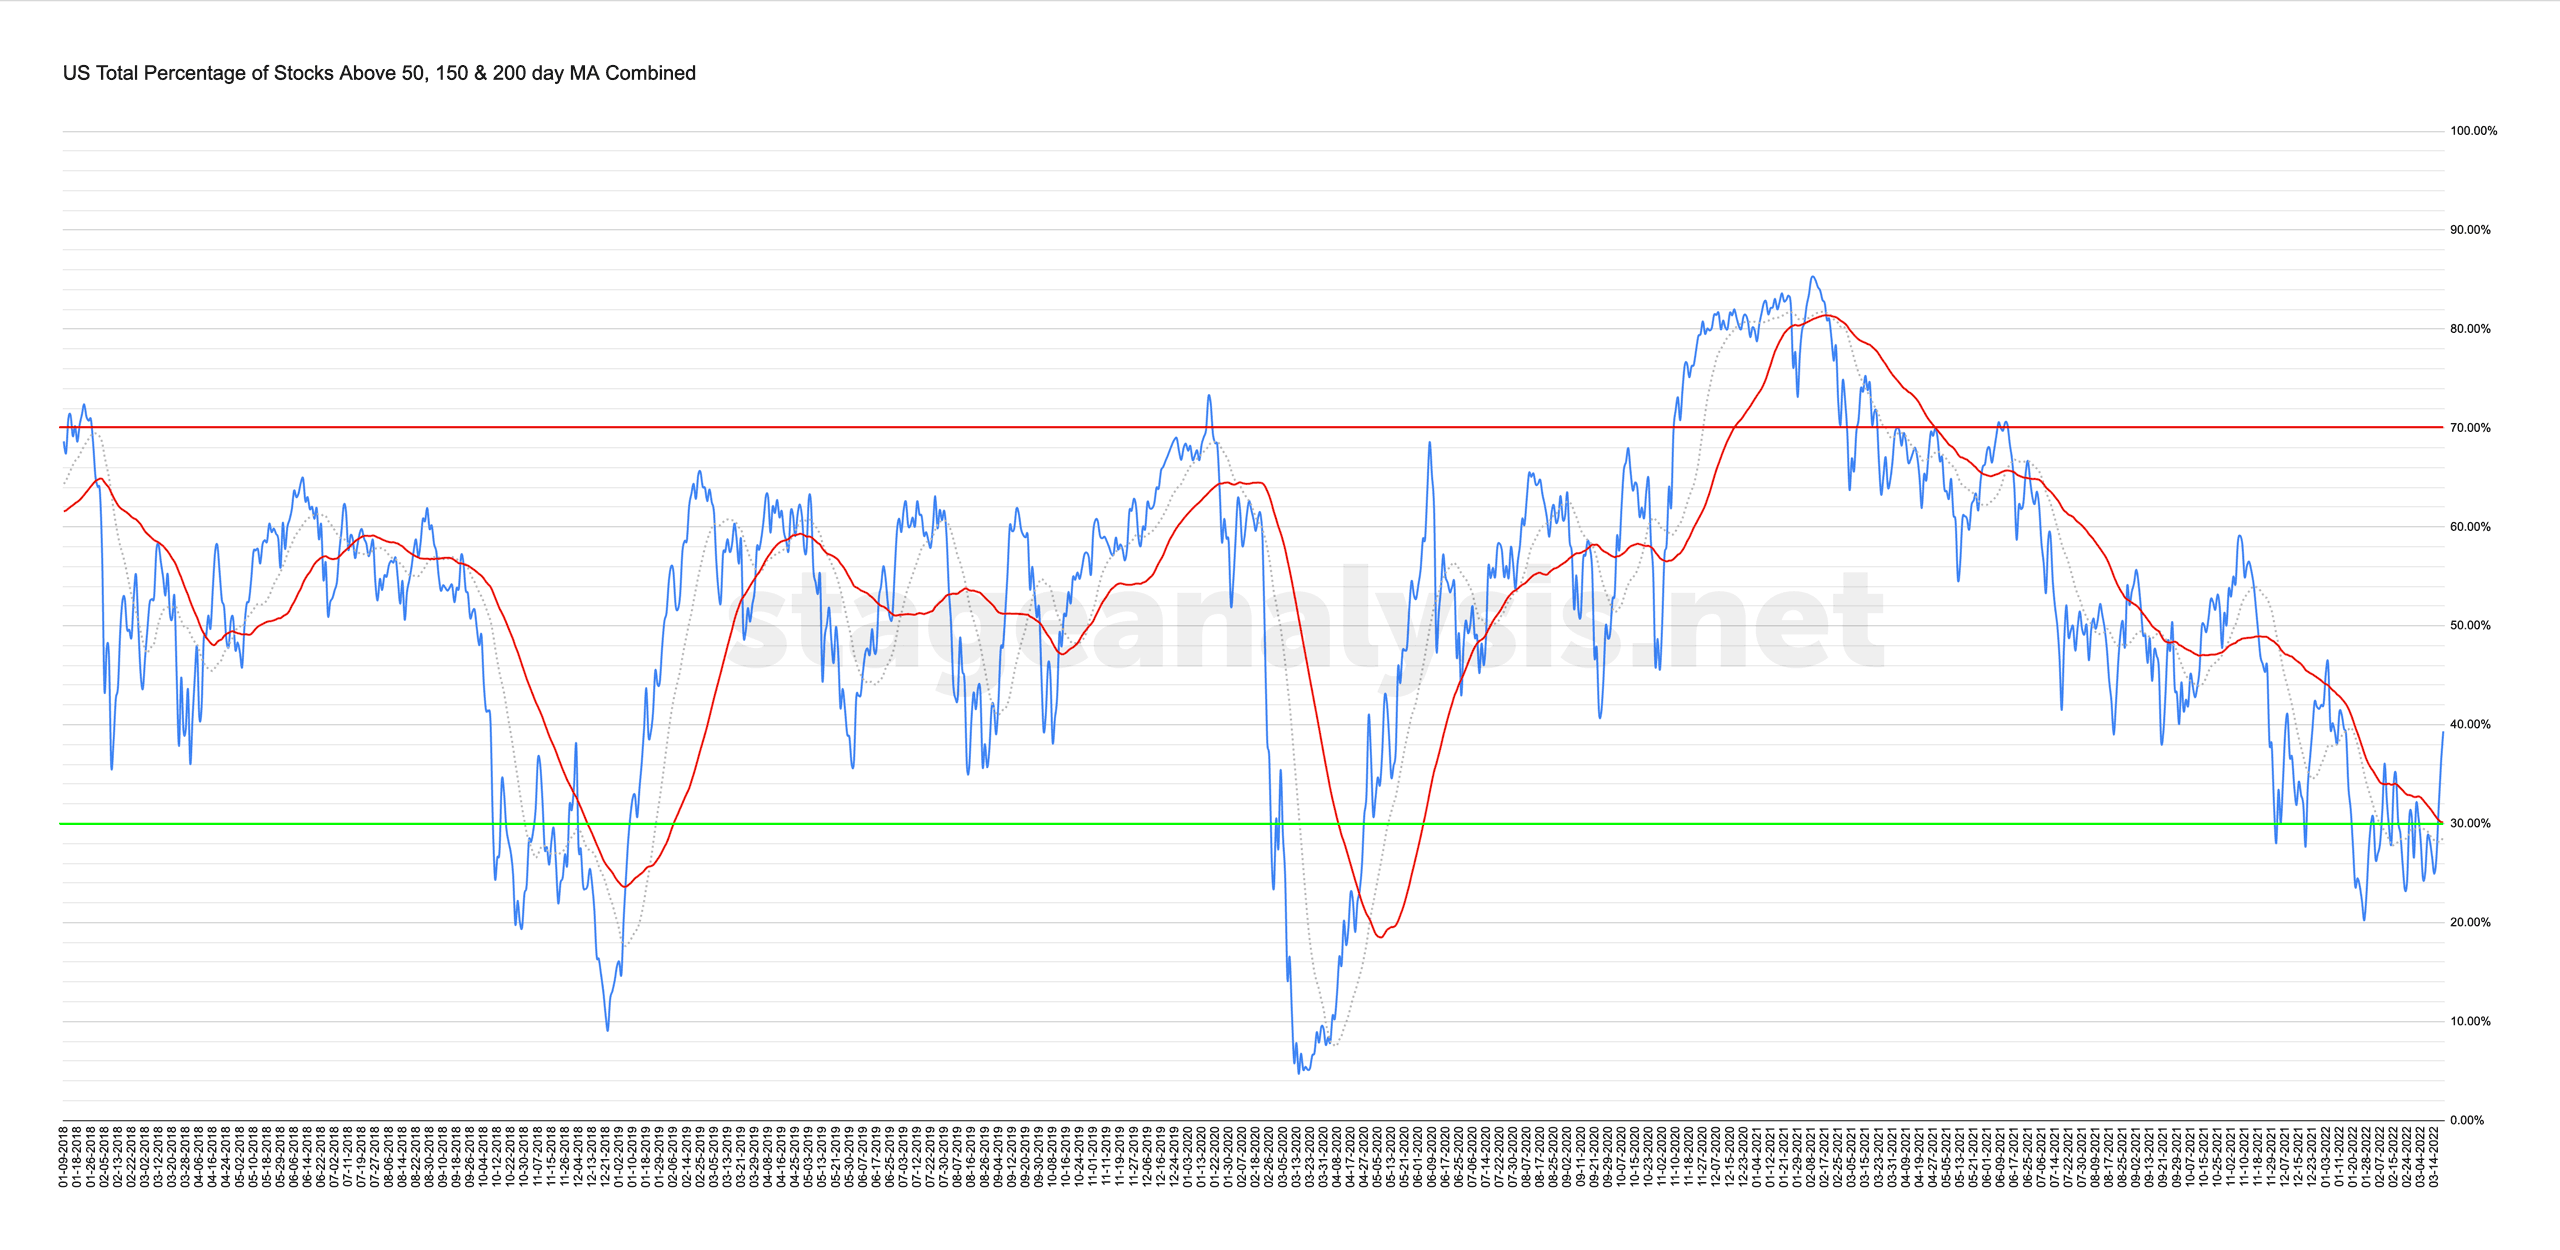
39.34% (+12.62% 1wk)
Status Change: Neutral / Positive Environment
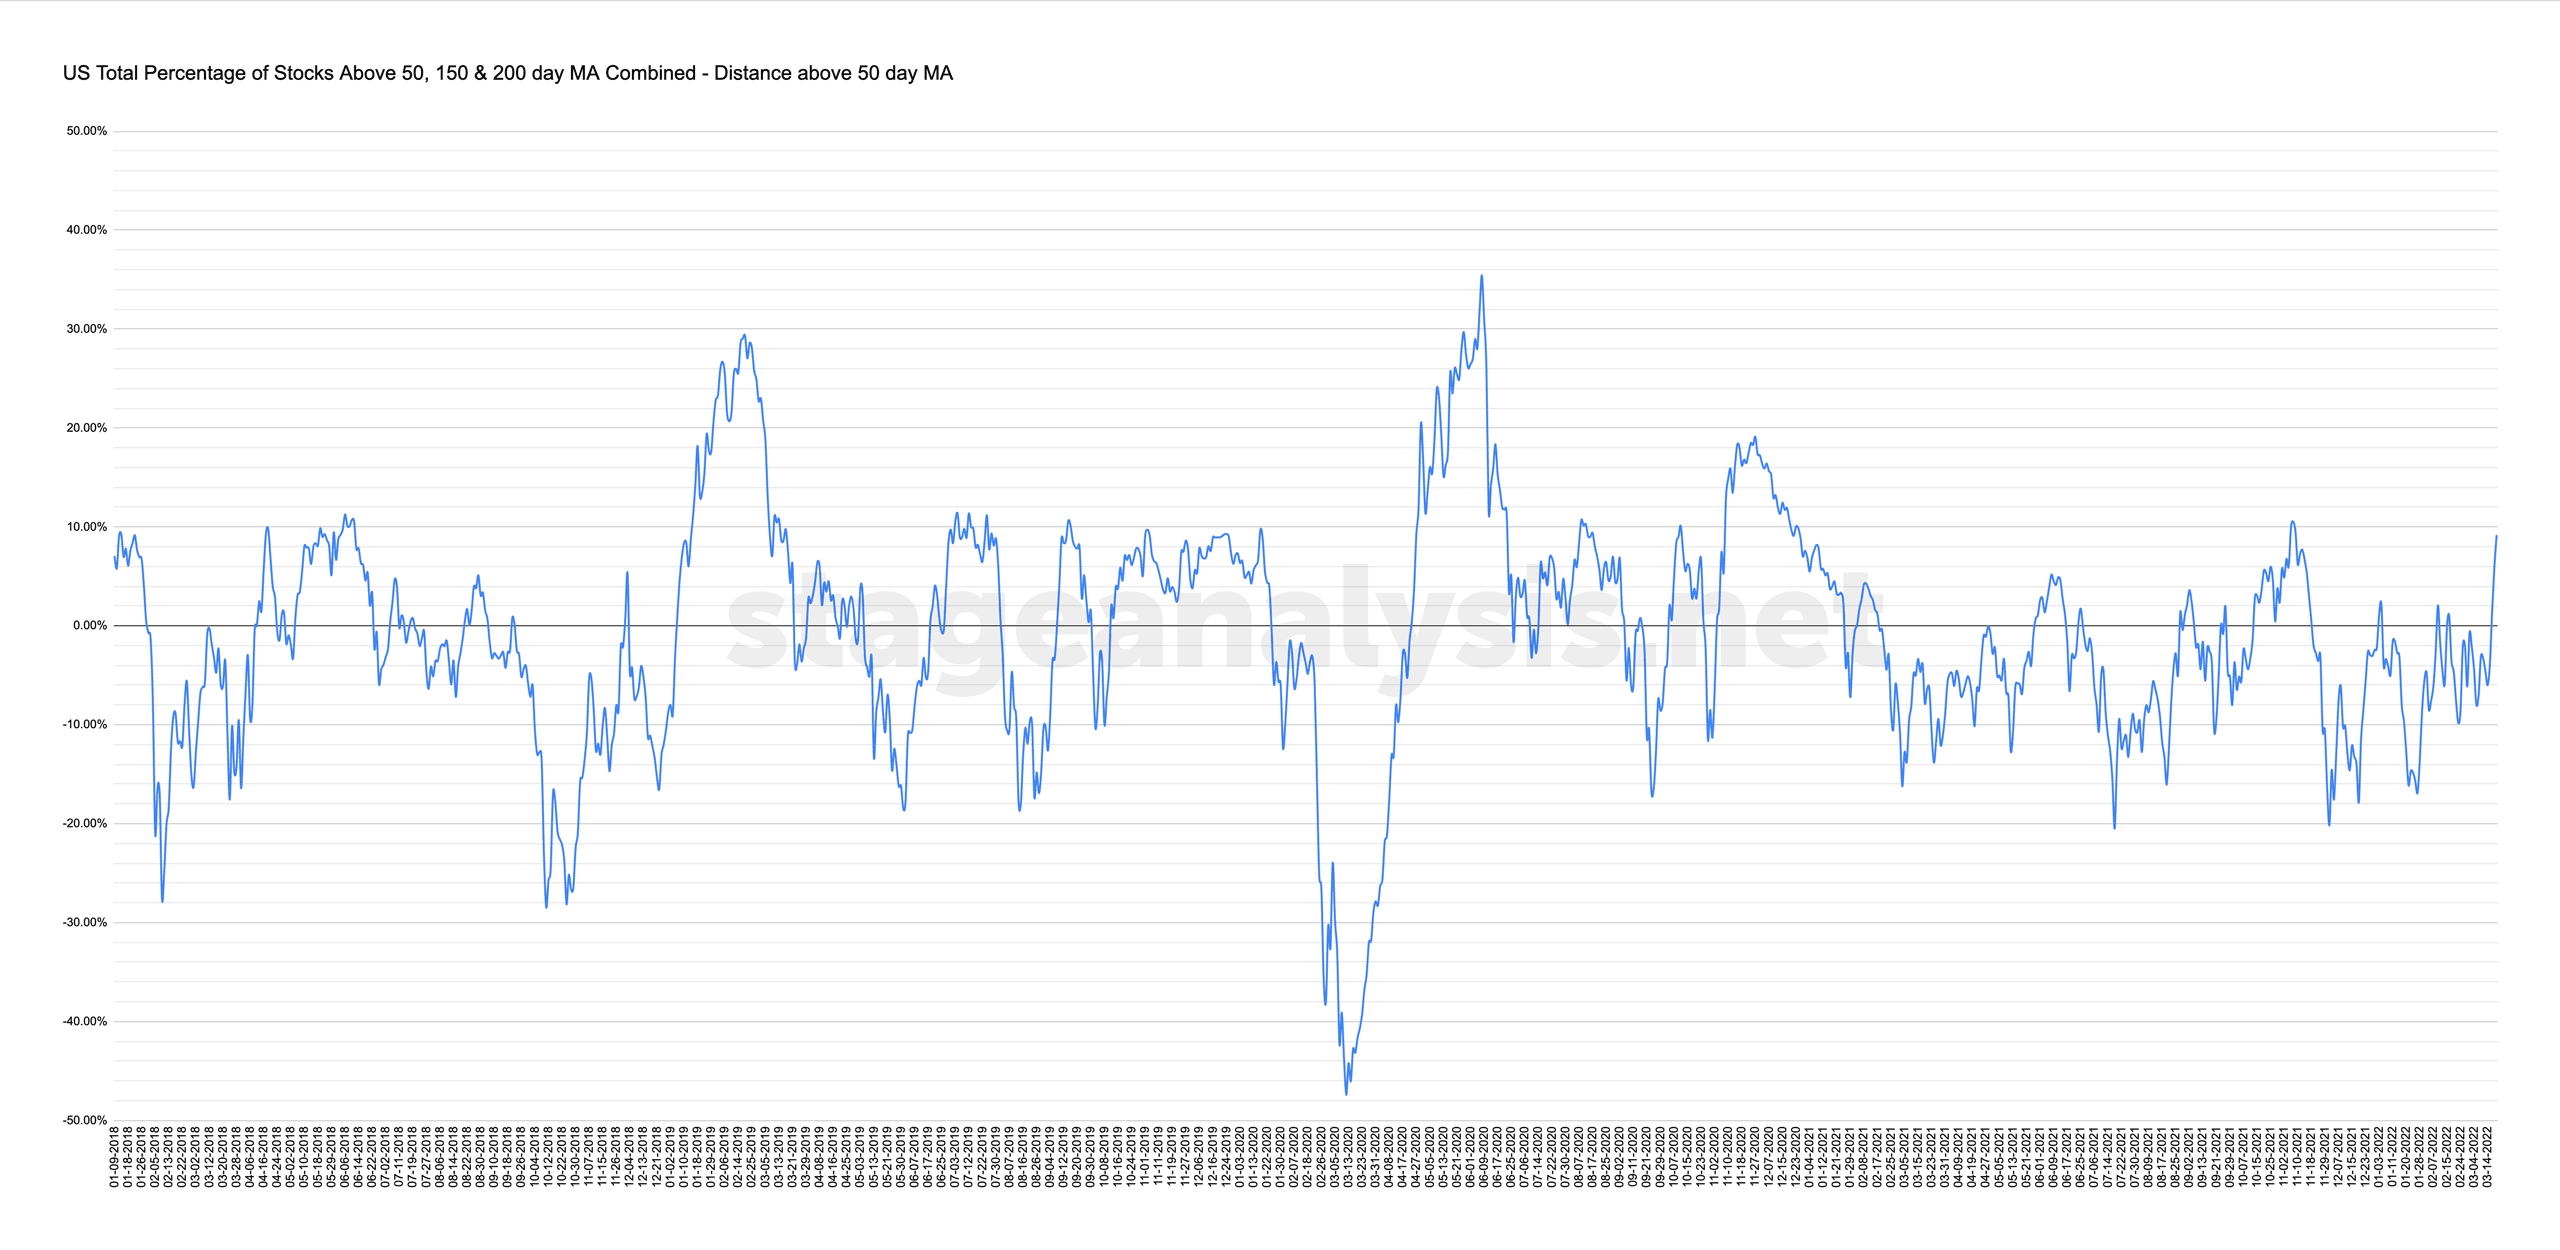
The US Total Percentage of Stocks Above their 50 Day, 150 Day & 200 Day Moving Averages Combined chart moved strongly back above its 50 day MA – which I use as the signal line for it. So changes the players on the field from defense to offense, although it's quickly gotten extended at around +10% above the MA, which you will see on the relative chart further down the post, that it's the upper edge of the "normal" range. It does get further than that during strong periods, so it will give a further clue of a potential change of character "if" it does progress further before the next pullback begins. But suggests caution, as testing of the move by larger operators is an expected behaviour. So be careful of extended areas.
Also world events continue to add volatility into the mix in the near term, so risk management is even more key, as it could easily flip back towards a difficult environment again. So I plan on taking it day by day, as is just a potential first step that needs further confirmation.
Strategy:
- Changed to Offensive Posture
- Focus on strong RS stocks in strong / improving groups
- Progressive Exposure – only increase exposure if making progress – i.e. if you aren't making progress 25% invested, then don't get more exposed than that
- Buy on pullbacks
- Sell laggard stocks on rallies
- ETFs could be a way to get some exposure if individual stock setups aren't ready
- Group themes with money flow
- Avoid extended and near to resistance
- Focus on risk management
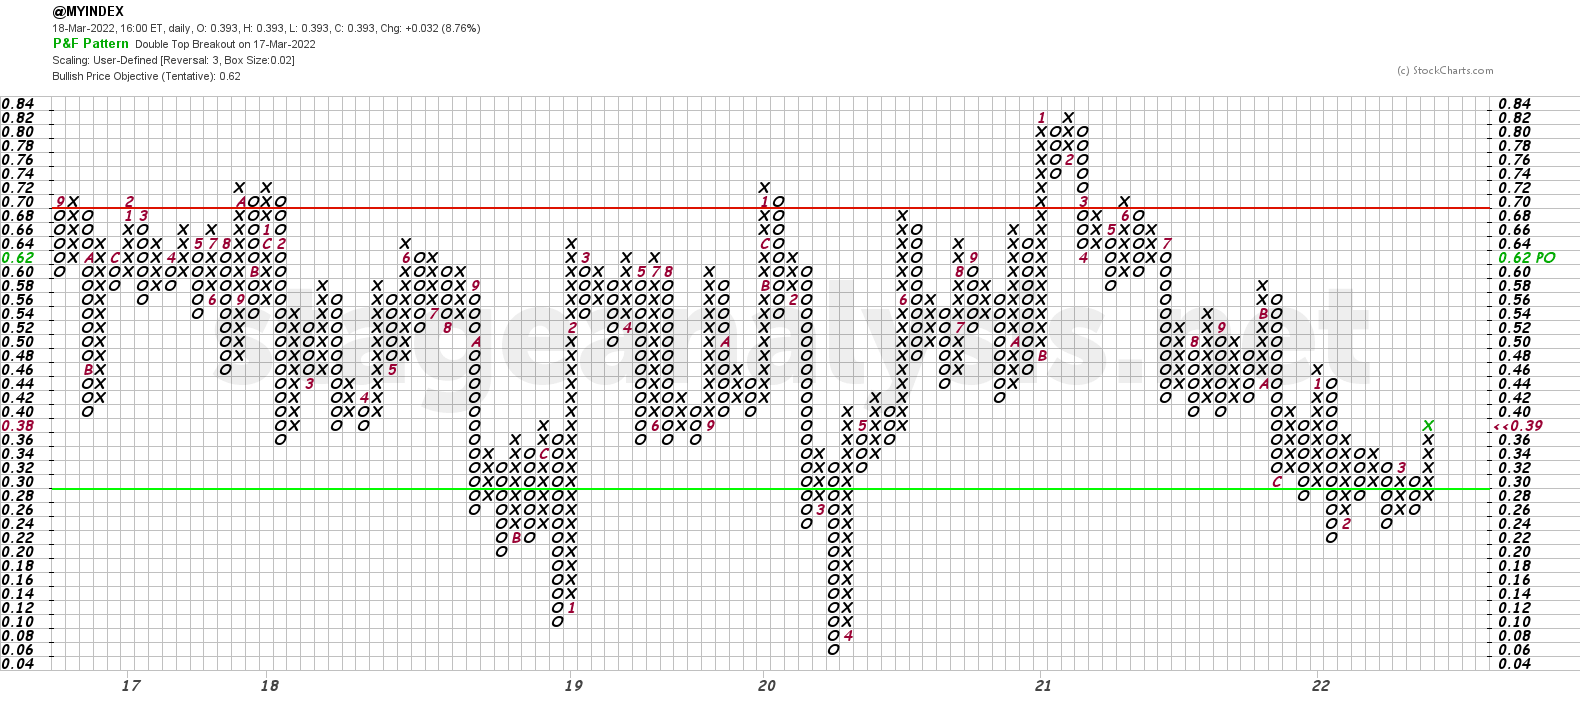
The point and figure chart above made a double top breakout this week, and so changes to Bull Confirmed status (See the bullish percent page for examples of the statuses).
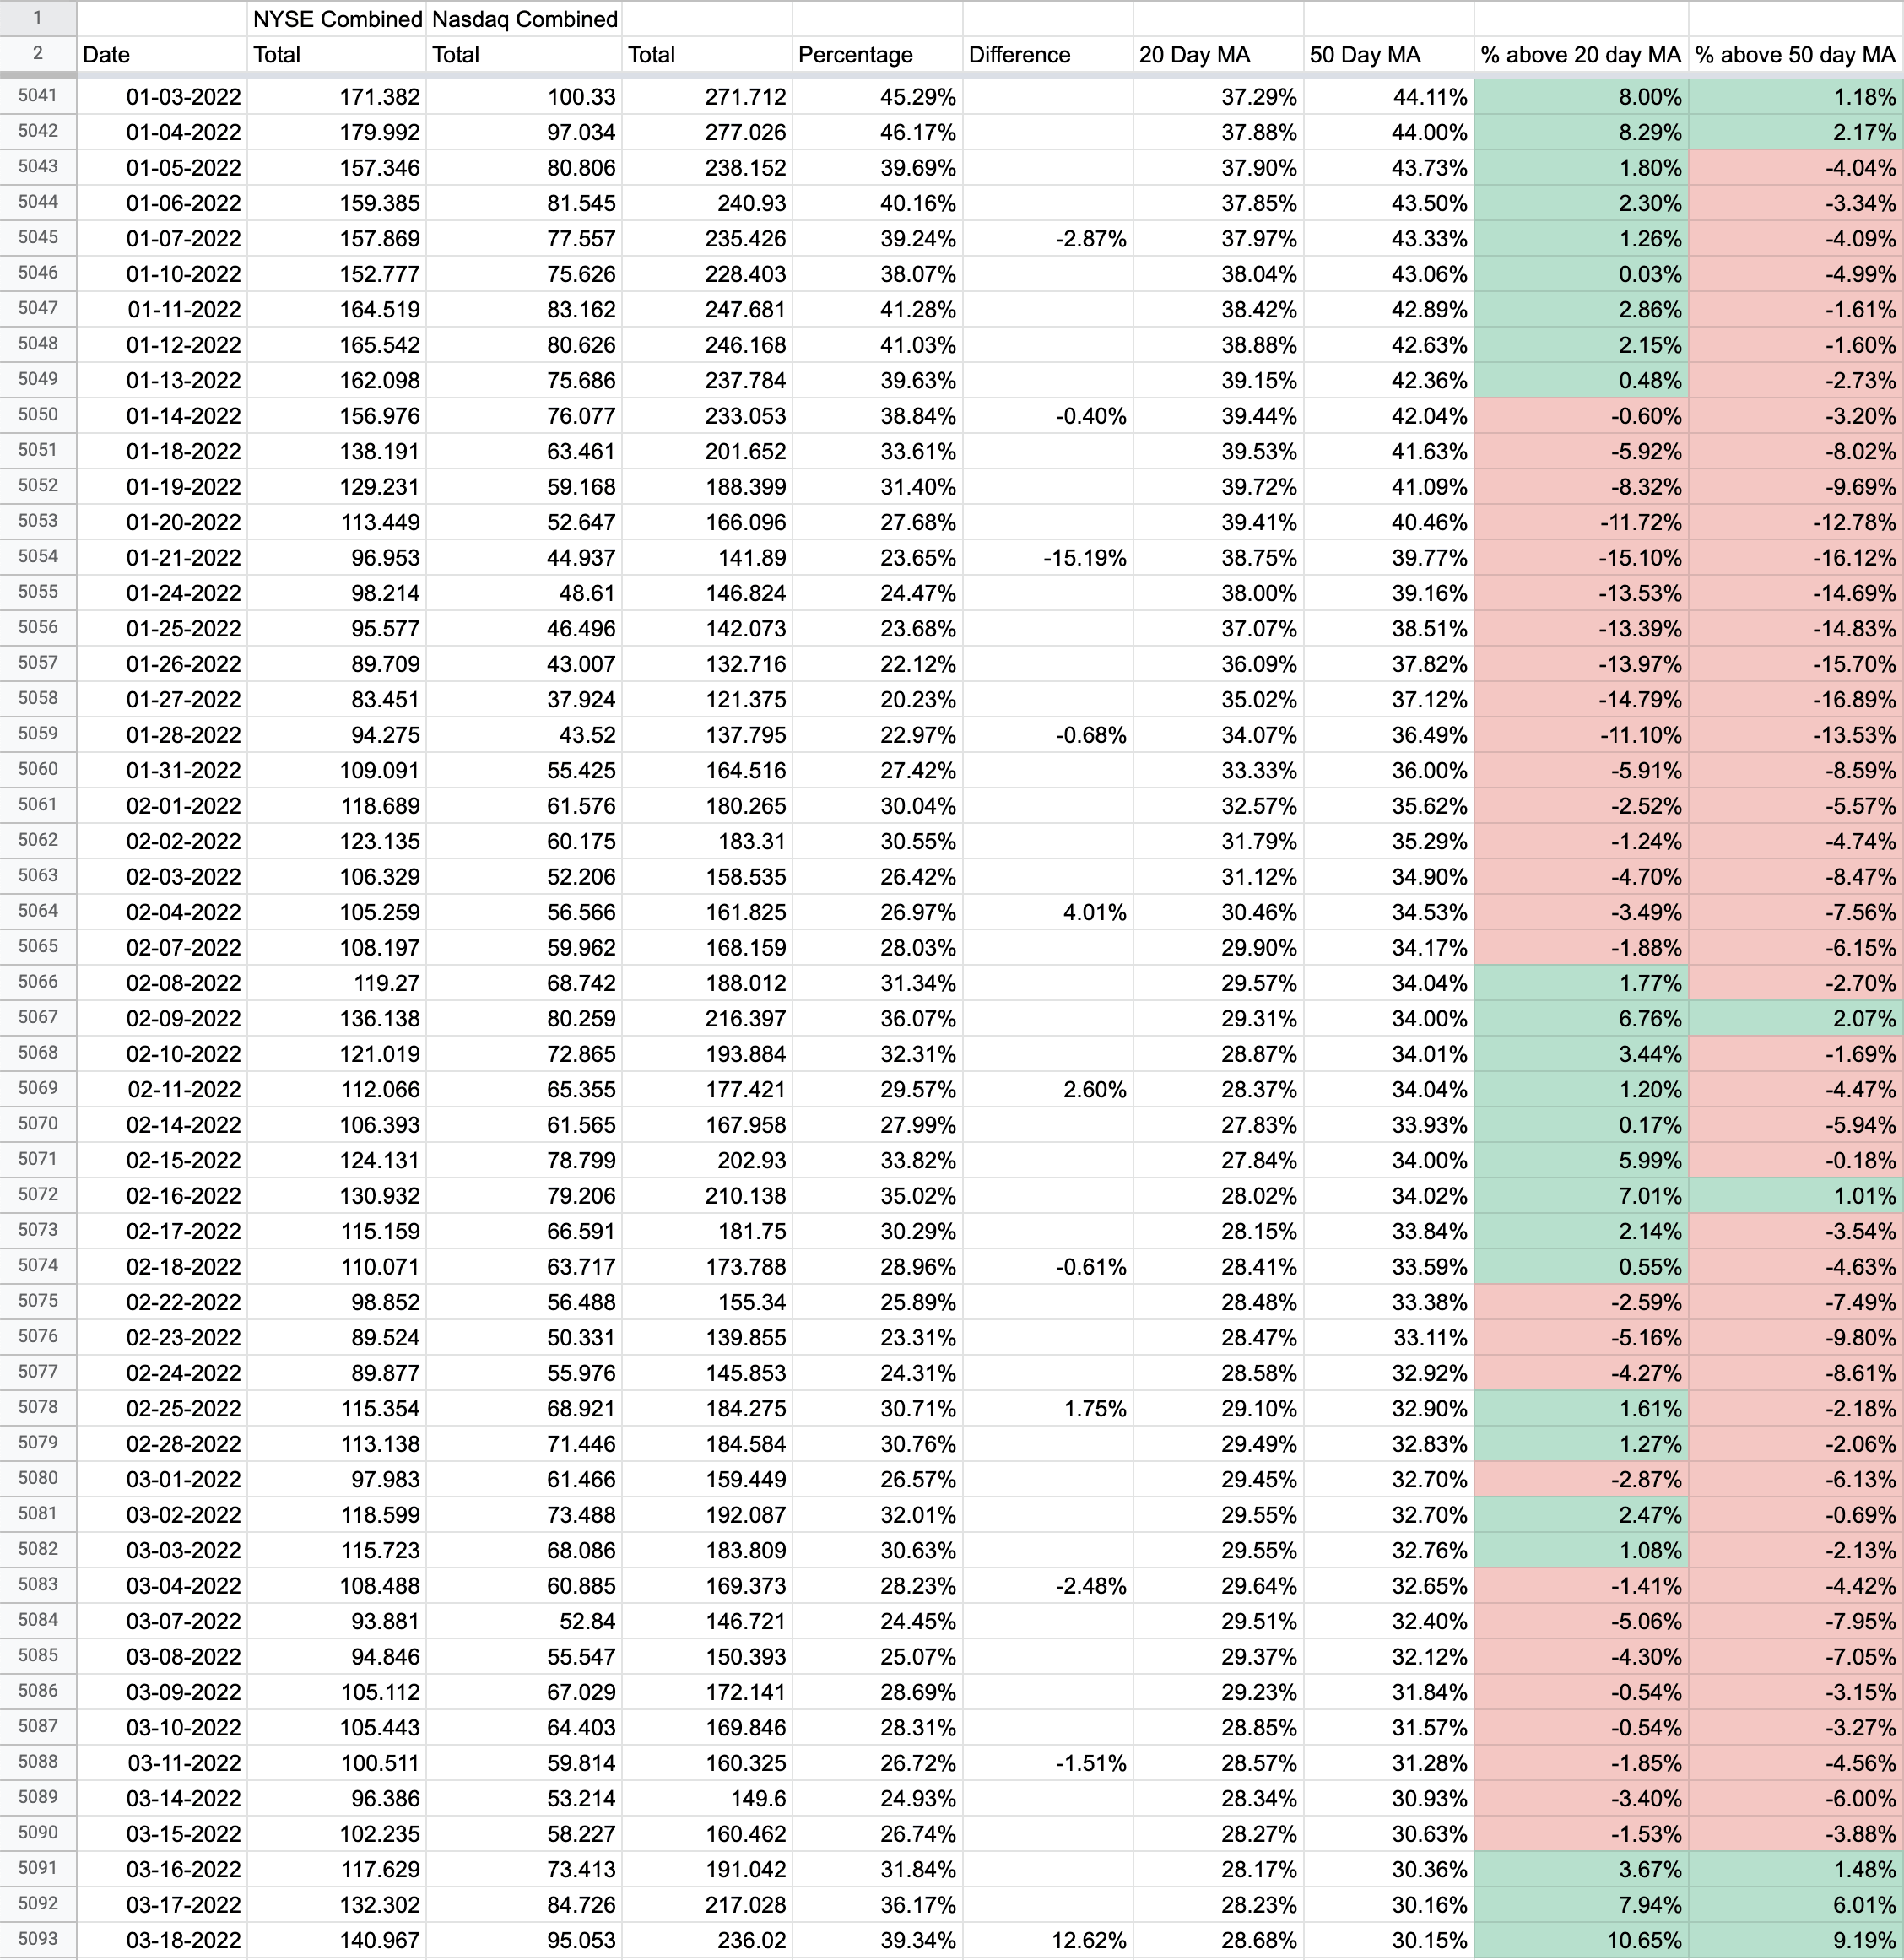
The data table below shows the year to date data. So you can see that this is the furthest move above the 50 day MA year to date, as the early January move above only made it +2.17% above the 50 day MA, whereas this week closed at +9.19% above the 50 day MA. So it highlights the change in behaviour, and we now need to see it hold above the 50 day MA on any pullback in the market to not switch back to a defensive mode again.
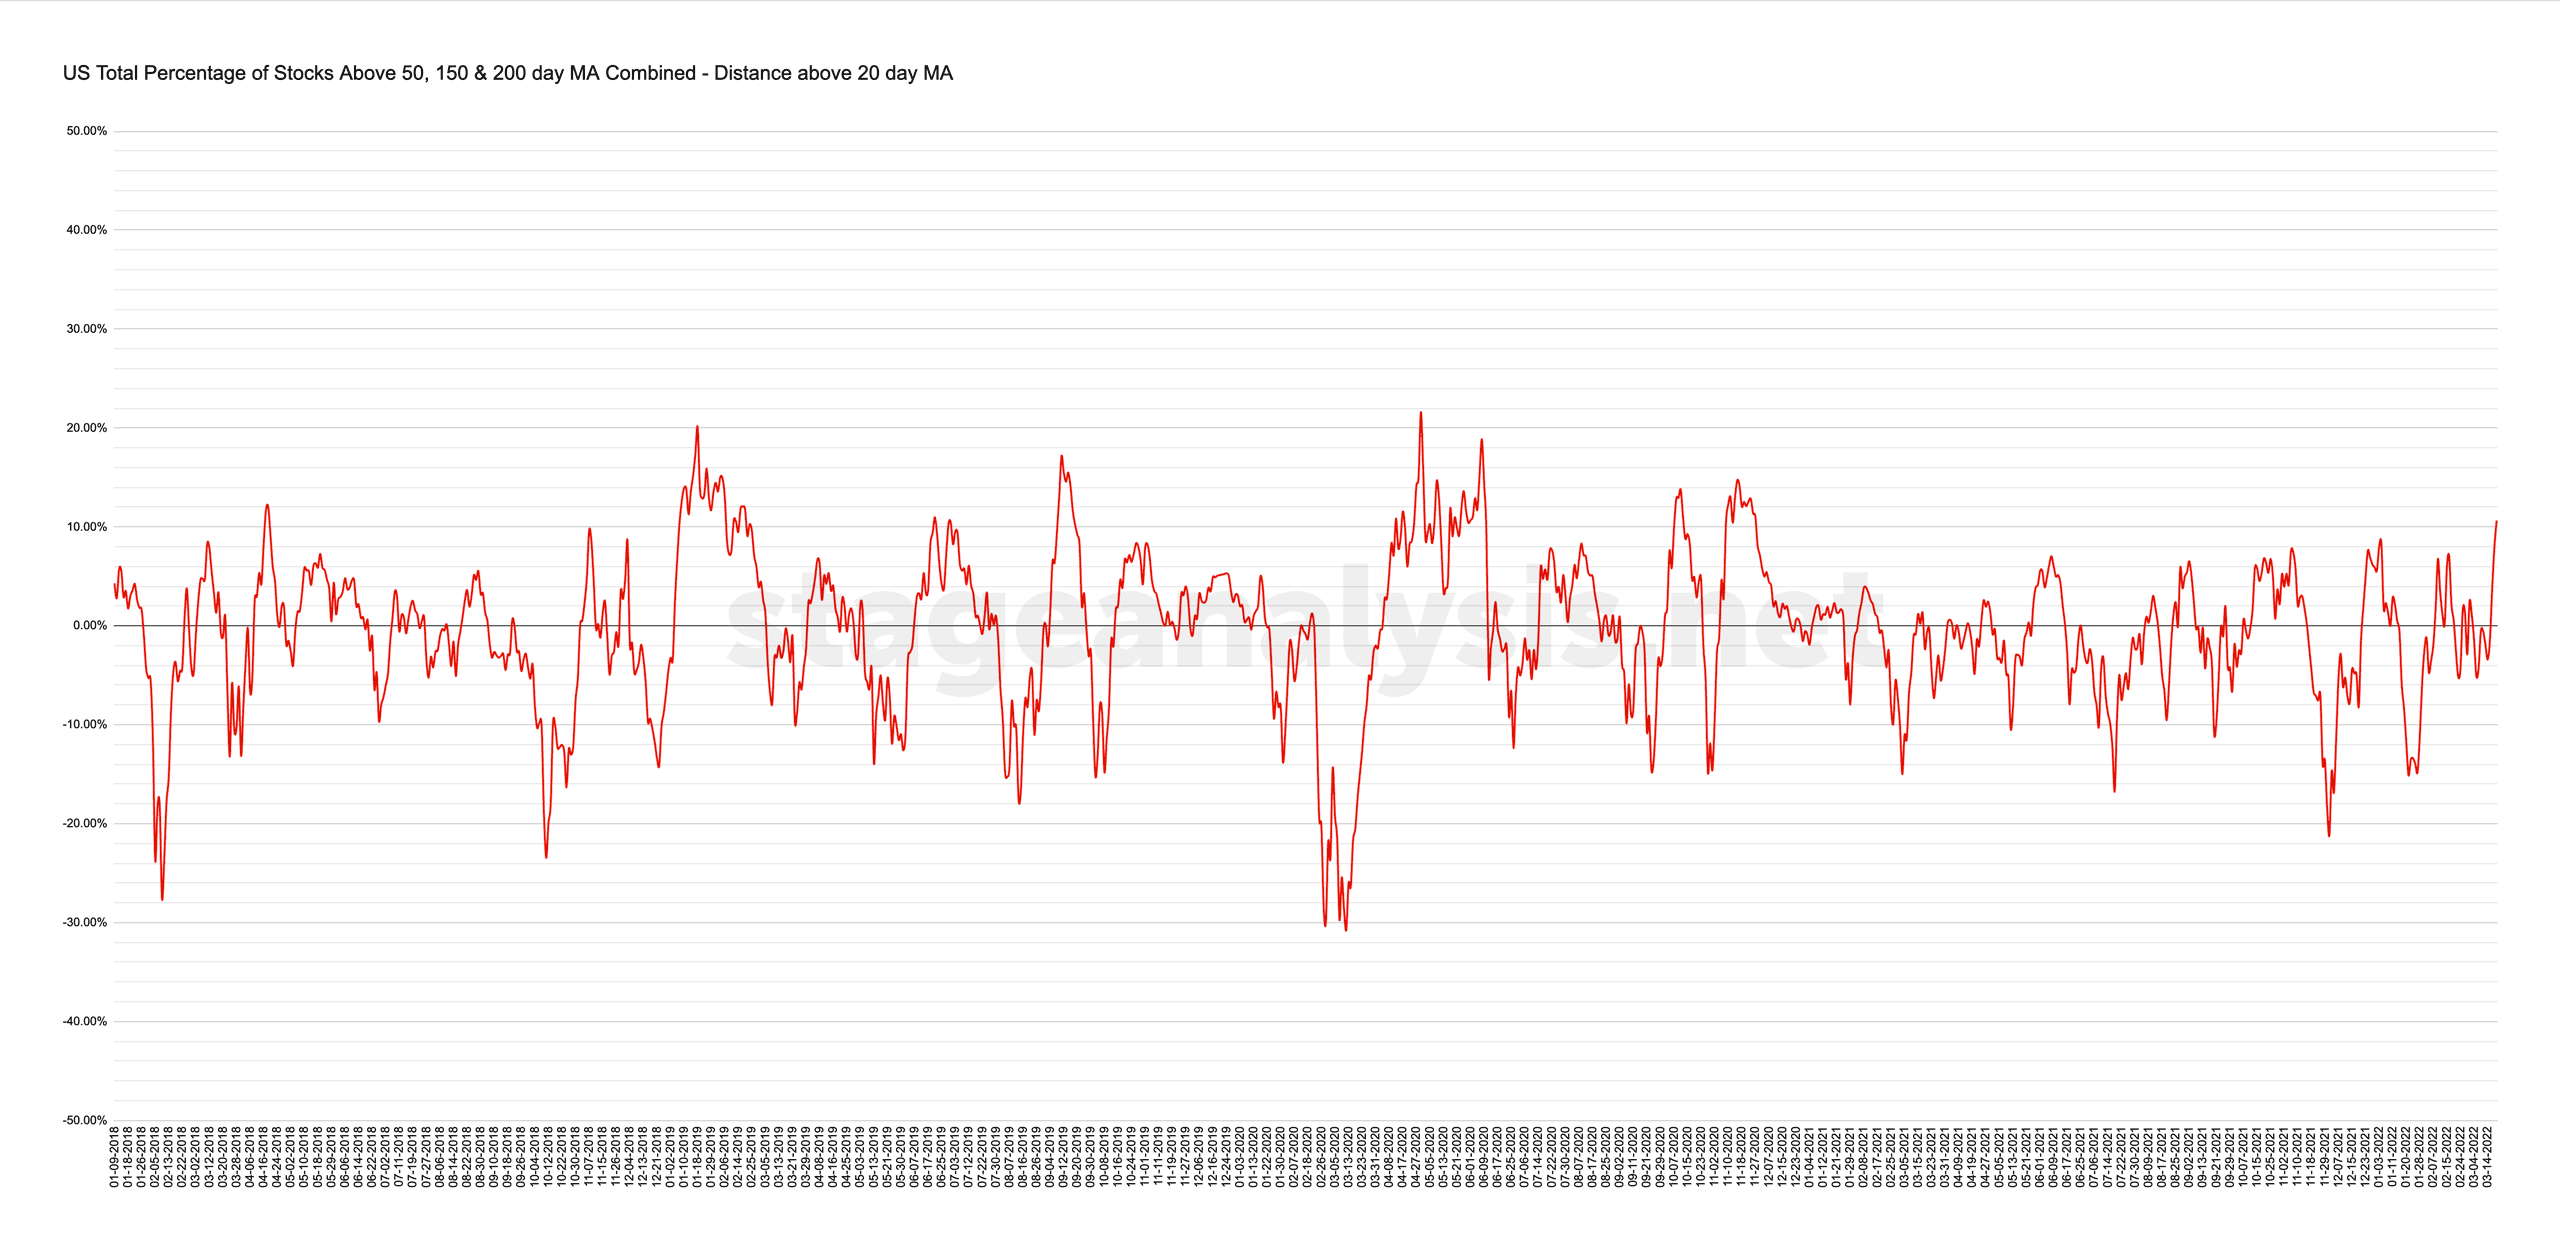
20 and 50 day Oscillator
These show the distance that the combined chart is from the 20 day MA and 50 day MA on the chart. Above the zero is positive environment and below is a difficult / negative environment
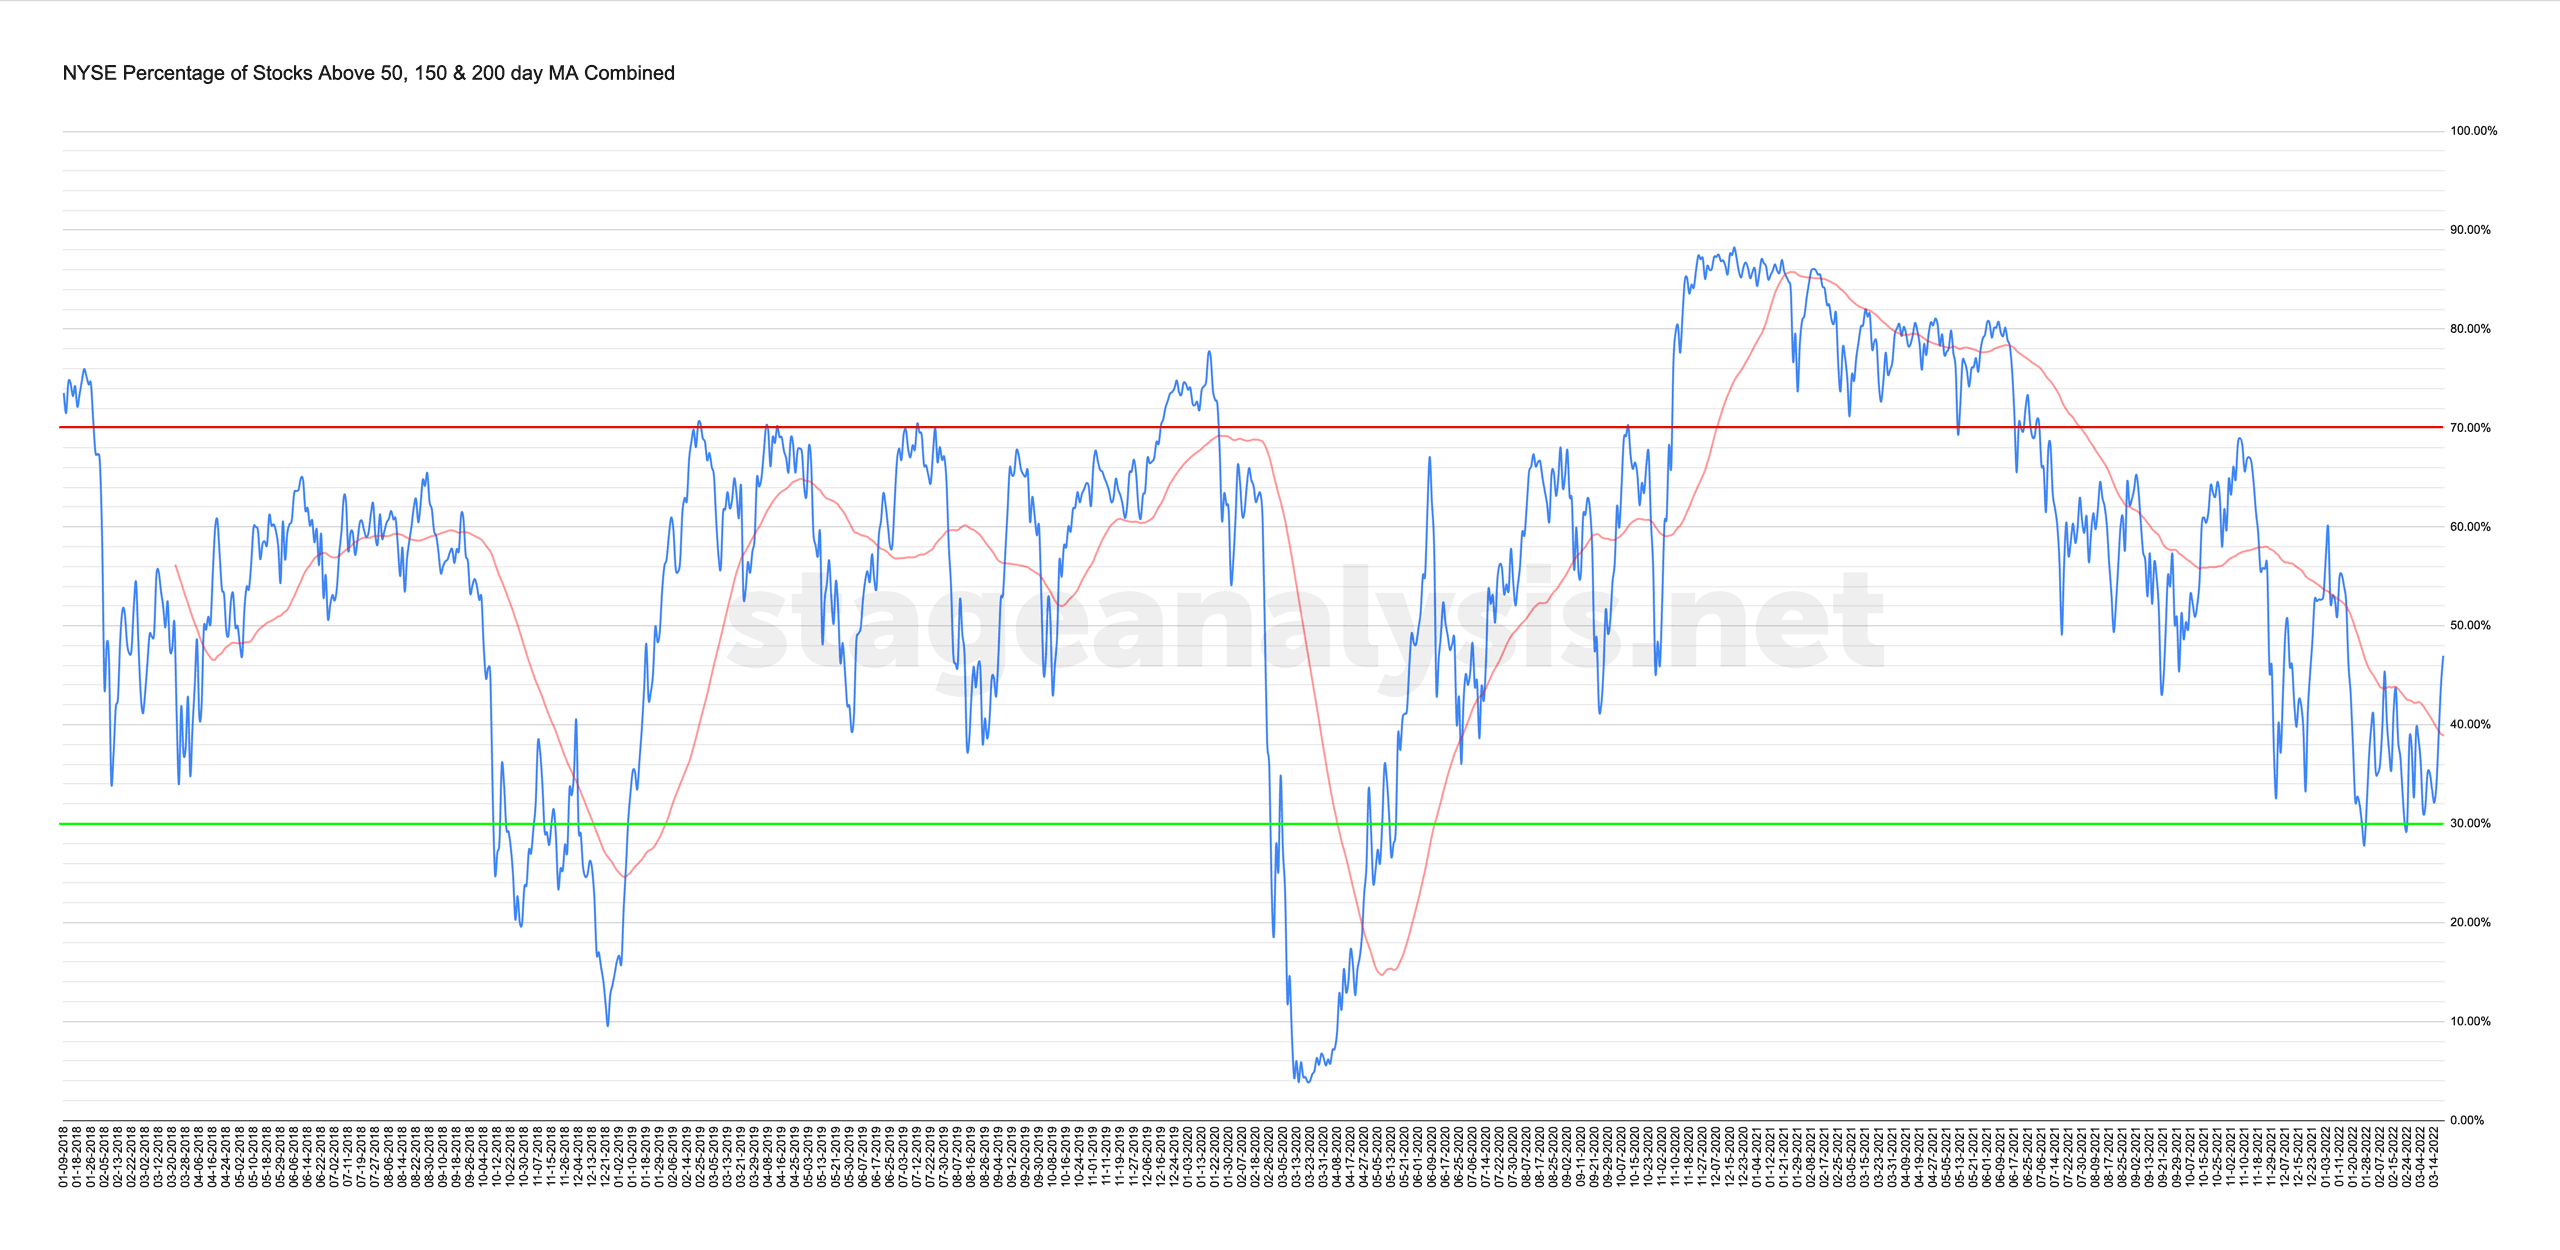
NYSE Total % Stocks Above their 50 Day, 150 Day & 200 Day Moving Averages Combined
46.99% (+13.49% 1wk)
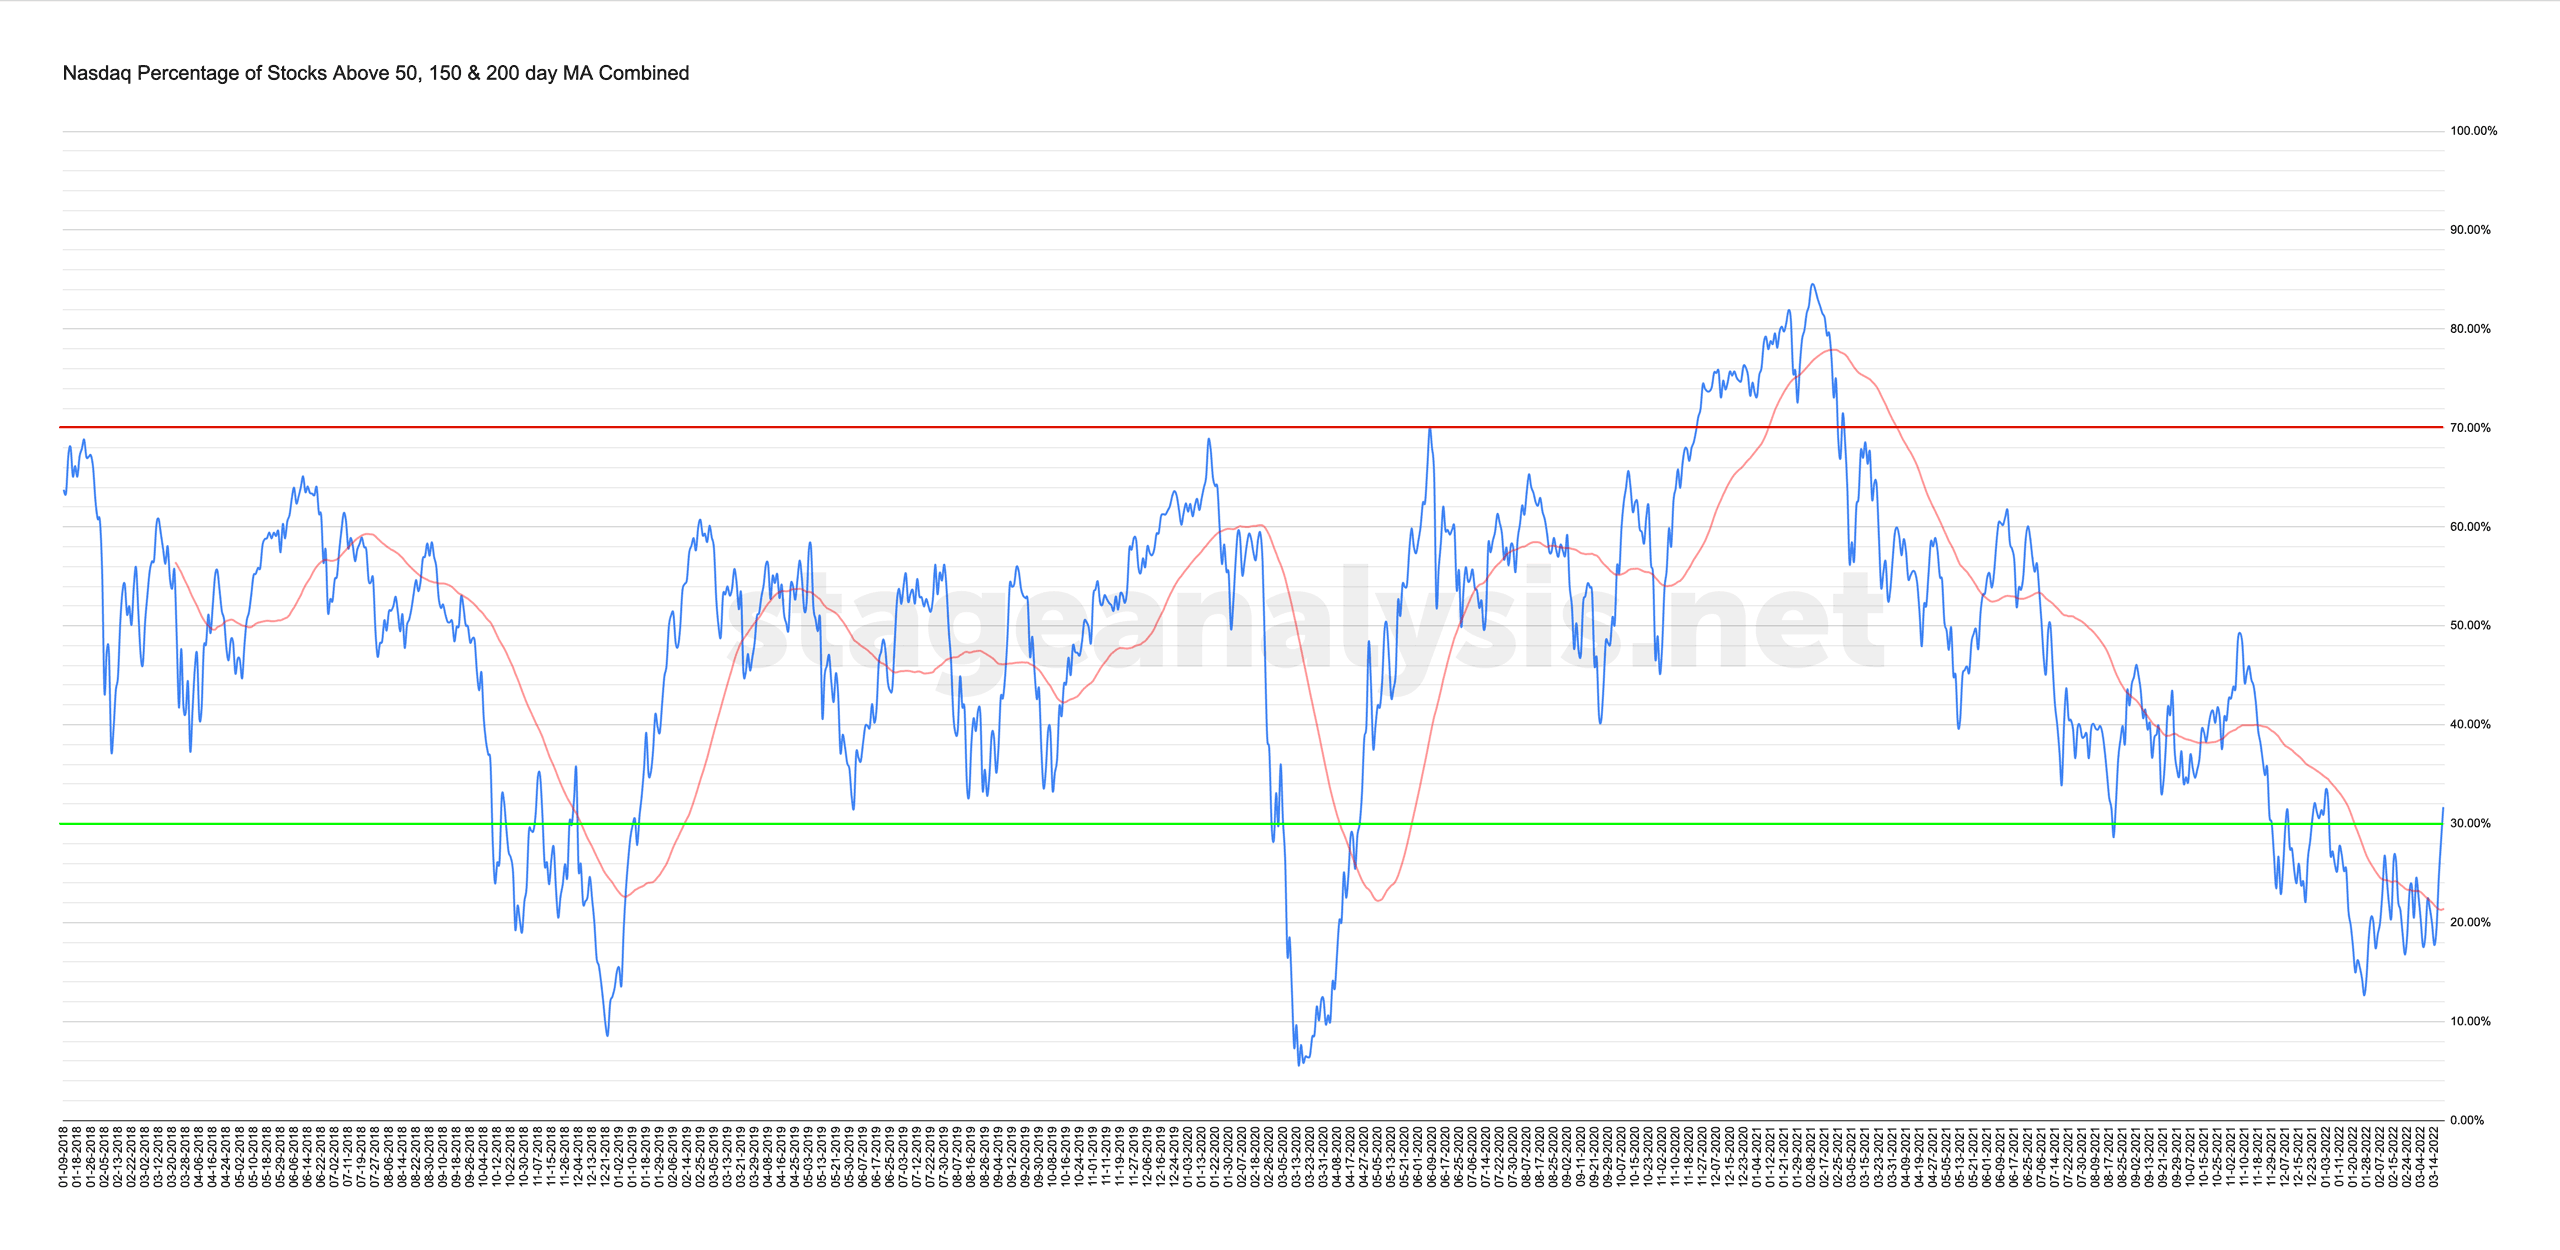
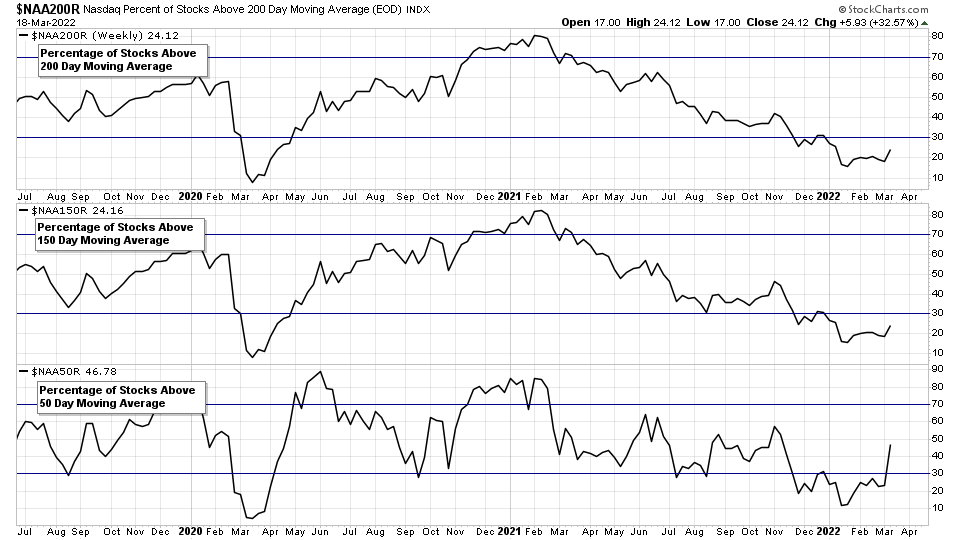
Nasdaq Total % Stocks Above their 50 Day, 150 Day & 200 Day Moving Averages Combined
31.68% (+11.75% 1wk)
Become a Stage Analysis Member:
To see more like this – US Stocks watchlist posts, detailed videos each weekend, use our unique Stage Analysis tools, such as the US Stocks & ETFs Screener, Charts, Market Breadth, Group Relative Strength and more...
Join Today
Disclaimer: For educational purpose only. Not investment advice. Seek professional advice from a financial advisor before making any investing decisions.