
Market Breadth: Percentage of Stocks Above their 50 Day, 150 Day & 200 Day Moving Averages Combined
The full post is available to view by members only. For immediate access:
16.82% (+1.79% 1wk)
Status: Difficult Environment
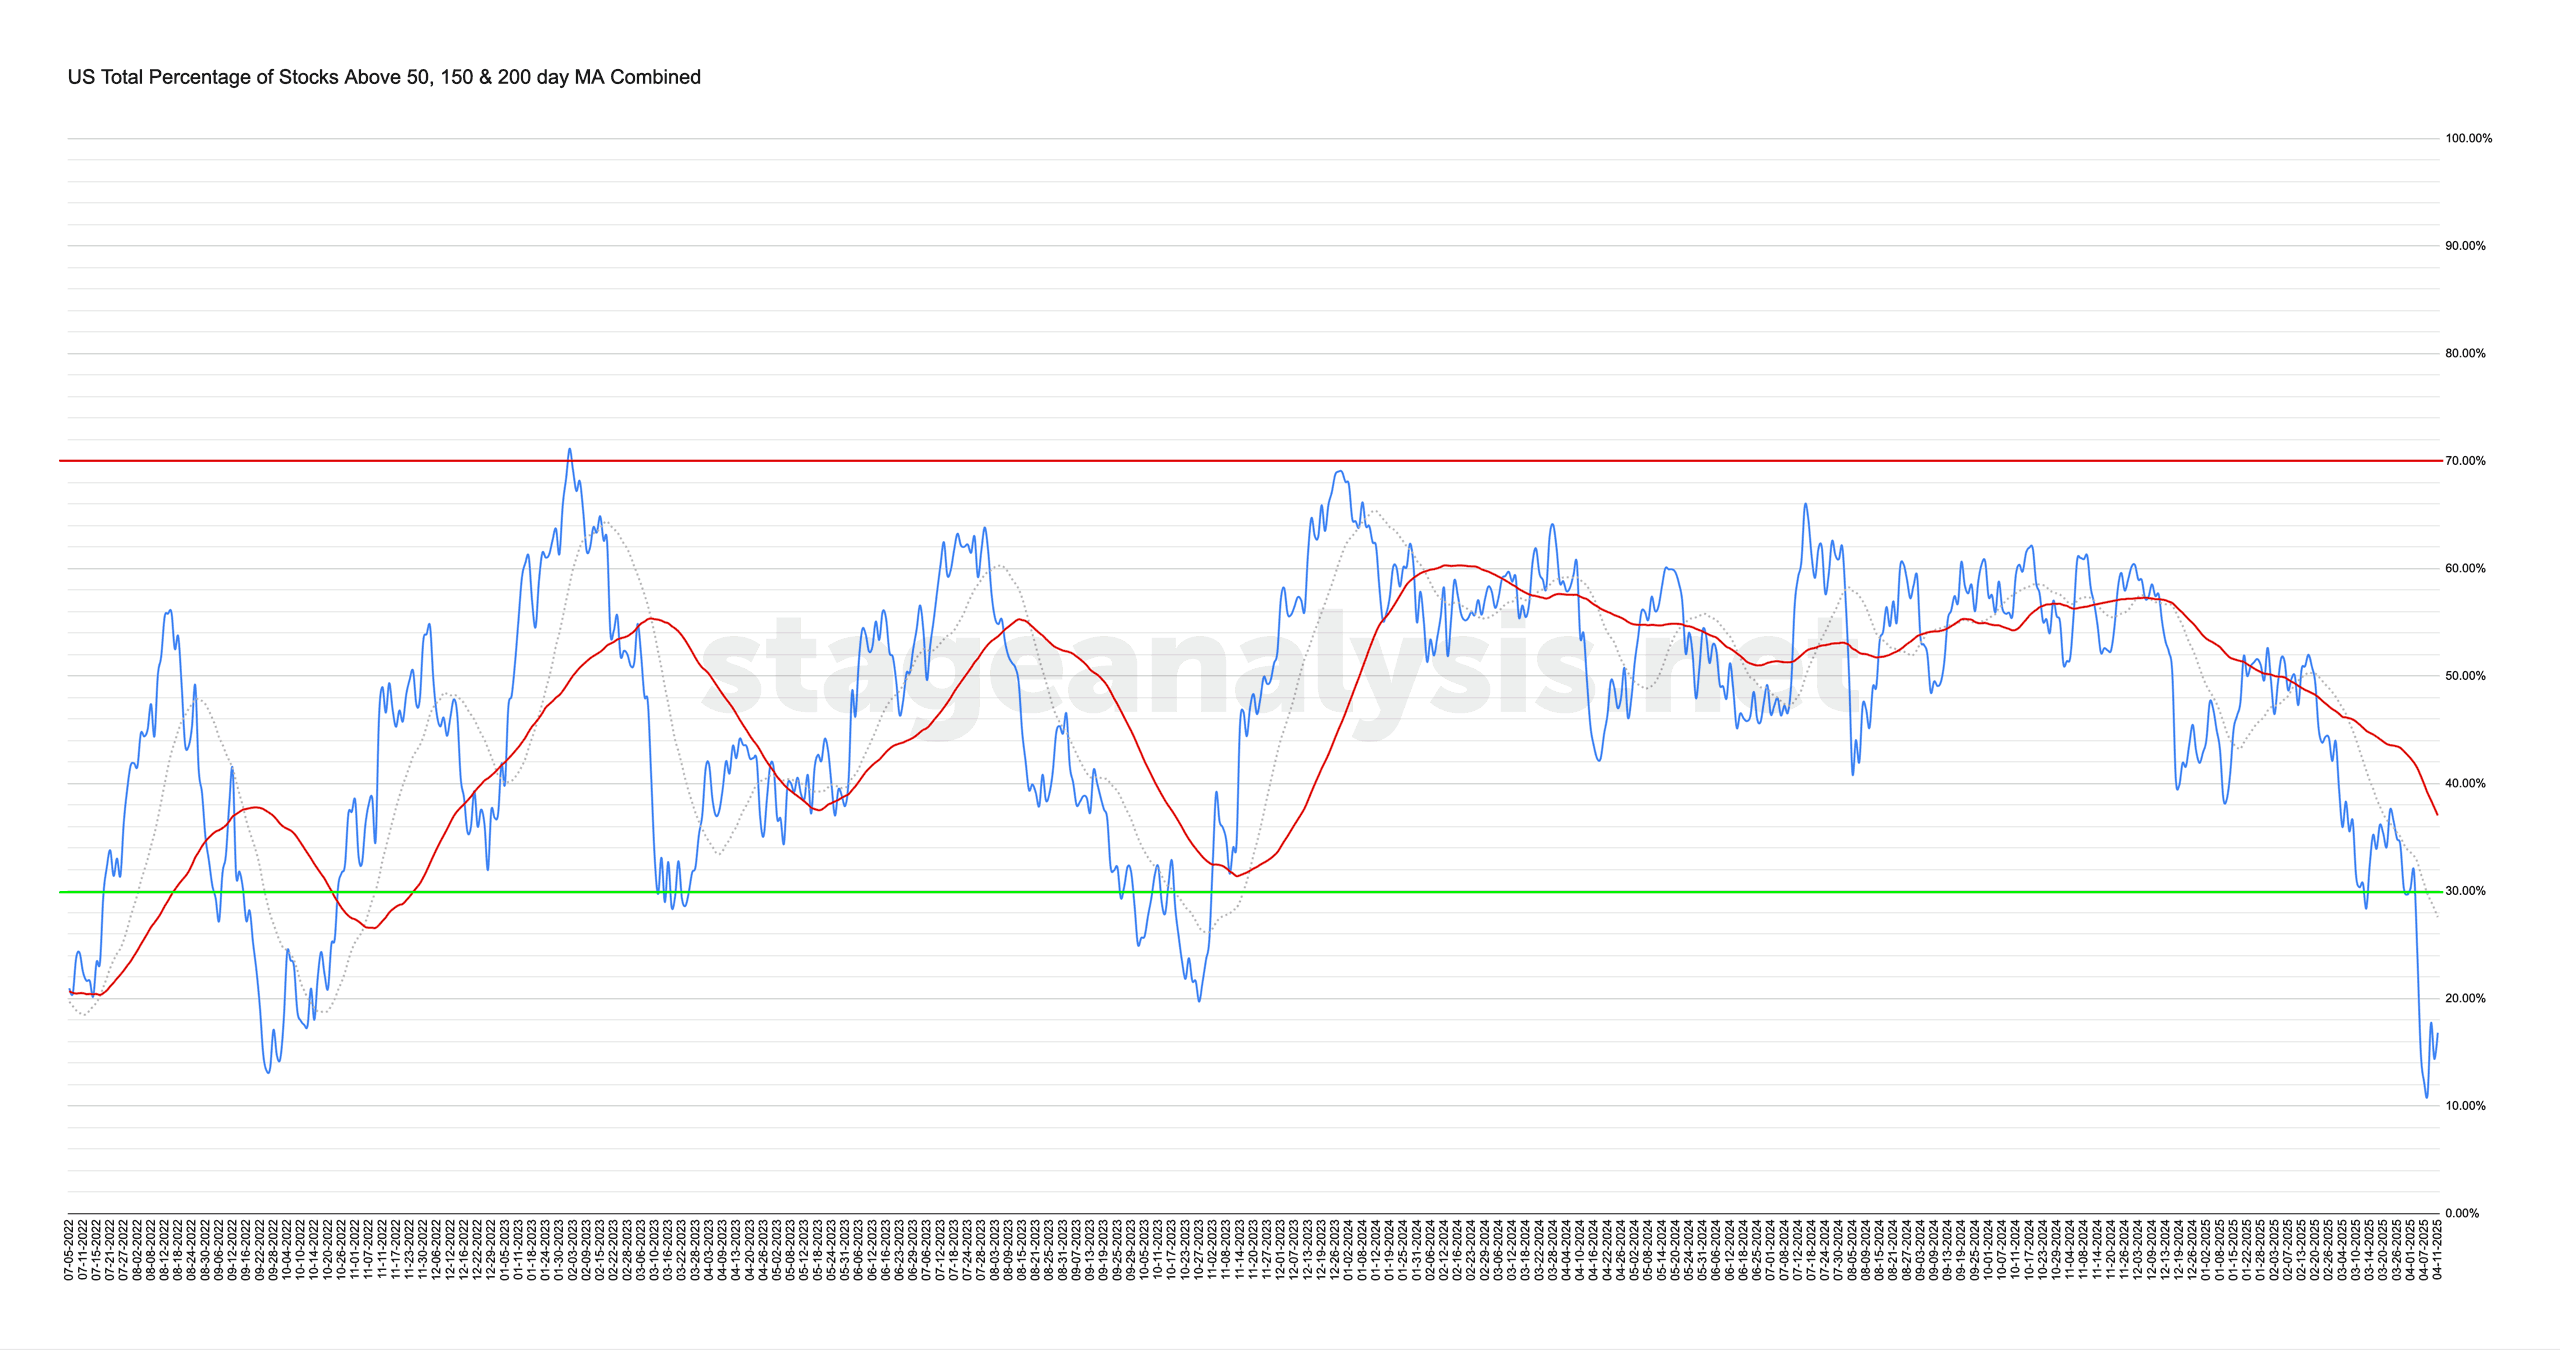
The US Total Percentage of Stocks above their 50 Day, 150 Day & 200 Day Moving Averages (shown above) increased by +1.79% this week.
Therefore, the overall combined average is at 16.82% in the US market (NYSE and Nasdaq markets combined) above their short, medium and long term moving averages.
The combined average continued towards the lower extremes early in the week before Wednesdays strong rebound, which then consolidated into the end of the week, closing slightly higher than the previous weeks close. So an attempt to stop the decline with the distance from the moving averages at -10.75% below its 20 day MA, and -20.22% below its 50 day MA (signal line). So it remains on Difficult Environment status to start the new week. So extreme caution remains prudent.
However, the moving average breadth is a contrarian breadth measure. So with it consolidating in the lower zone, at levels only seen during significant past Stage 4 declines. We need to be alert for signs of improvement in the data, i.e. recovering back out of the lower zone. As that is when this breadth tool gives a longer term signal, in the exact same way as we see in the bullish percent indexes.
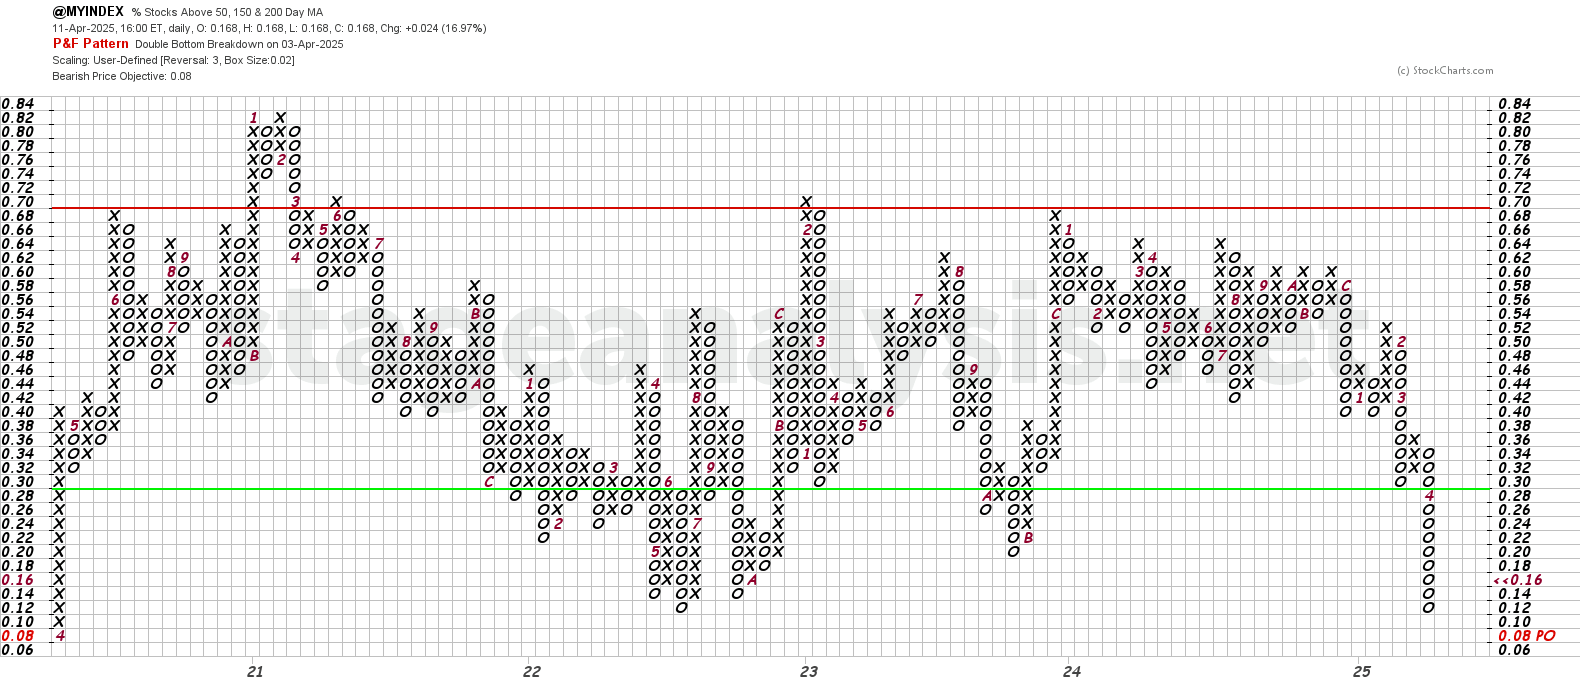
The Point and Figure (P&F) chart (shown above) added a further 2 Os to the its current column early in the week, and the rebound wasn't enough for a reversal. So the P&F strategy remains on Defense (as it is in a column of Os), and P&F Bear Confirmed status.
A close above 18% would reverse it to a column of Xs (offense) and a tentative Bull Alert status. So there's a chance that could happen next week, as it's very close to that level.
See the Bullish Percent article for more information on the P&F statuses.
Become a Stage Analysis Member:
To see more like this and other premium content, such as the regular US Stocks watchlist, detailed videos and intraday posts, become a Stage Analysis member.
Join Today
Disclaimer: For educational purpose only. Not investment advice. Seek professional advice from a financial advisor before making any investing decisions.