
Market Breadth: Percentage of Stocks Above their 50 Day, 150 Day & 200 Day Moving Averages Combined
The full post is available to view by members only. For immediate access:
30.32% (-3.77% 1wk)
Status: Difficult Environment
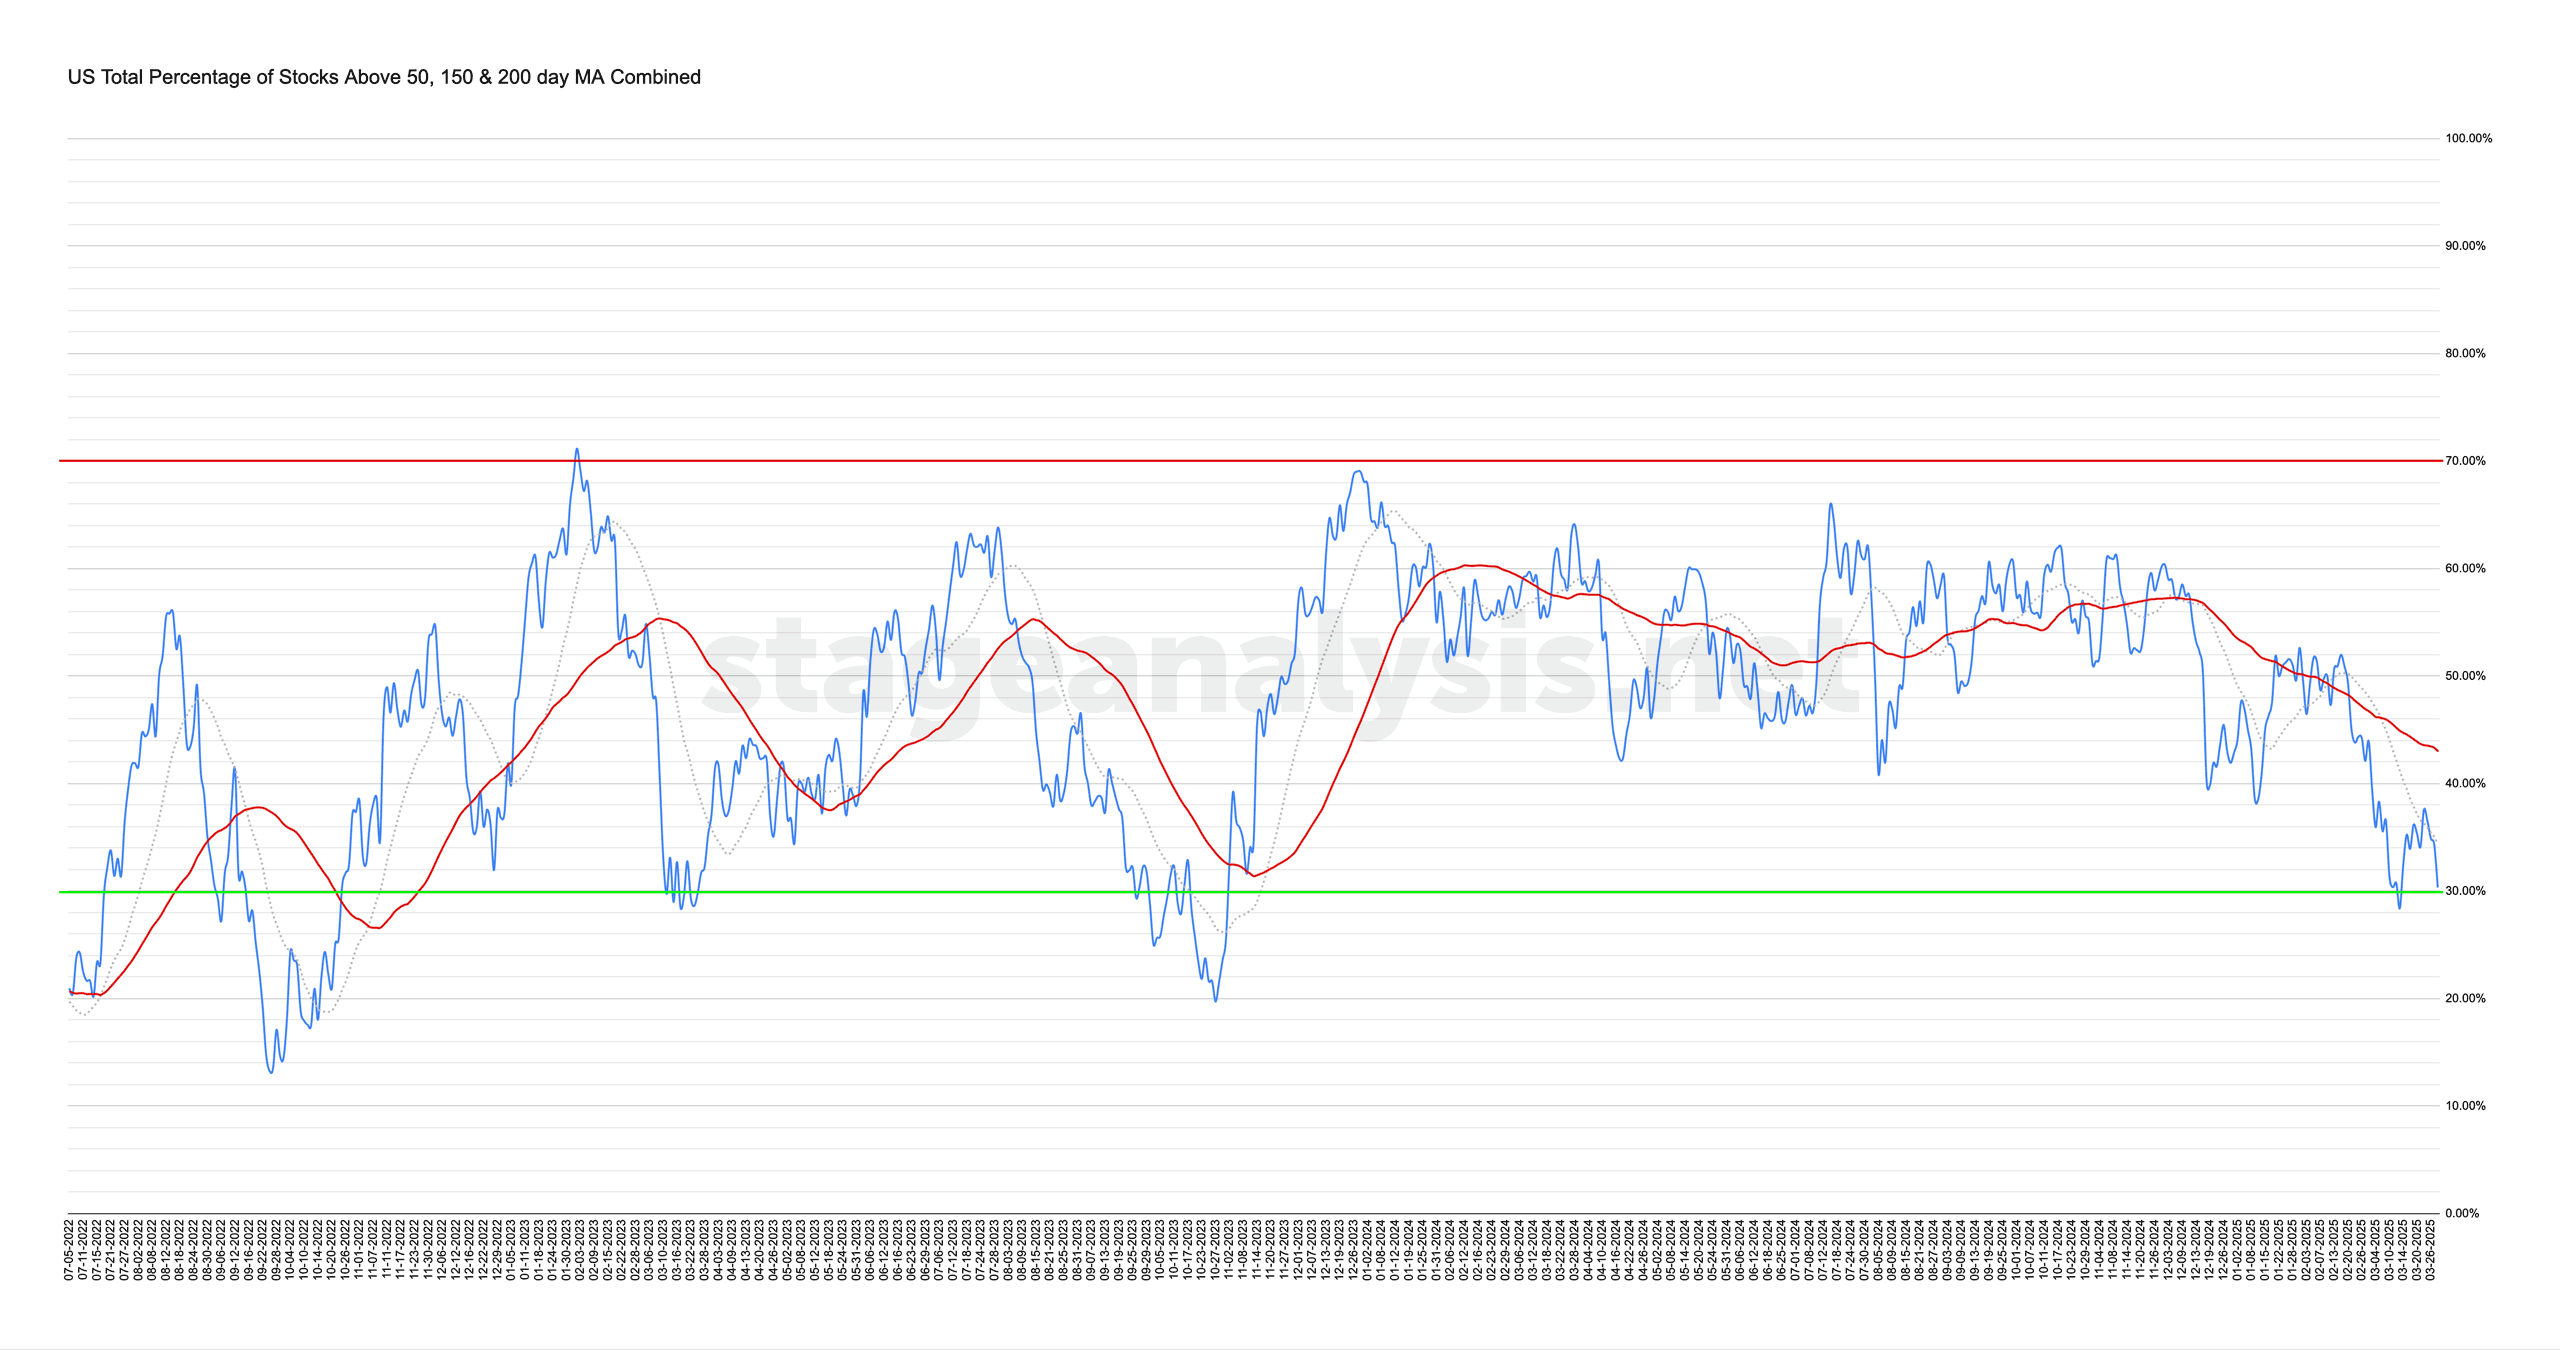
The US Total Percentage of Stocks above their 50 Day, 150 Day & 200 Day Moving Averages (shown above) decreased by -3.77% this week.
Therefore, the overall combined average is at 30.32% in the US market (NYSE and Nasdaq markets combined) above their short, medium and long term moving averages.
The combined average failed to hold onto Mondays strength and deteriorated throughout the week, to close back near the recent lows and -4.04% below its 20 day MA, and -12.70% below its 50 day MA (signal line). So it remains on a Difficult Environment status to start the new week. Hence, caution remains prudent, as the moving average breadth trend remains lower since mid December.
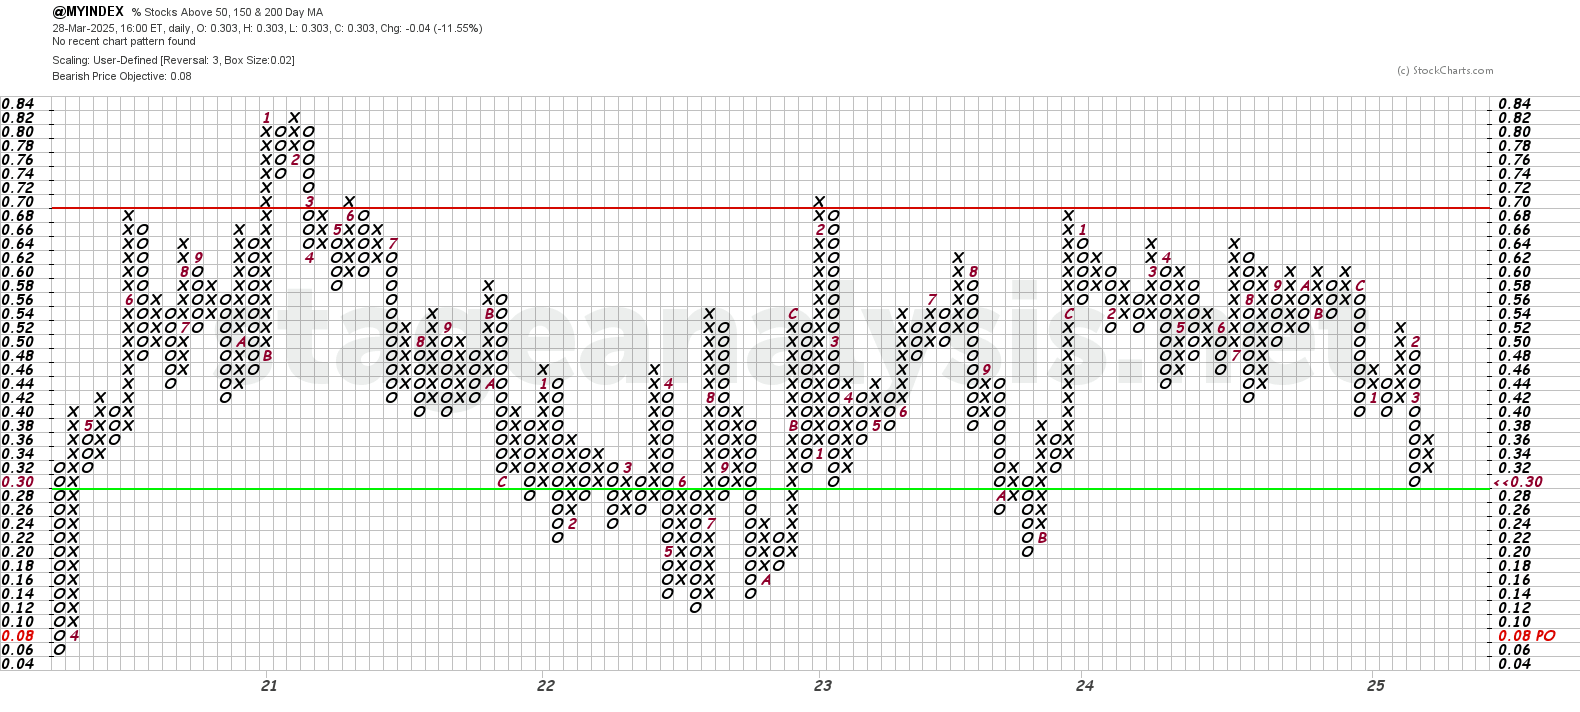
The Point and Figure (P&F) chart (shown above) was unchanged this week, and so the P&F strategy remains on Offense (as it is in a column of Xs), and P&F Bear Correction status in the lower half of the field. However, it is very close to a potential reversal to Os once more, if it closes below the 30% level.
See the Bullish Percent article for more information on the P&F statuses.
Become a Stage Analysis Member:
To see more like this and other premium content, such as the regular US Stocks watchlist, detailed videos and intraday posts, become a Stage Analysis member.
Join Today
Disclaimer: For educational purpose only. Not investment advice. Seek professional advice from a financial advisor before making any investing decisions.