
Market Breadth: Percentage of Stocks Above their 50 Day, 150 Day & 200 Day Moving Averages Combined
The full post is available to view by members only. For immediate access:
34.10% (+1.69% 1wk)
Status: Difficult Environment
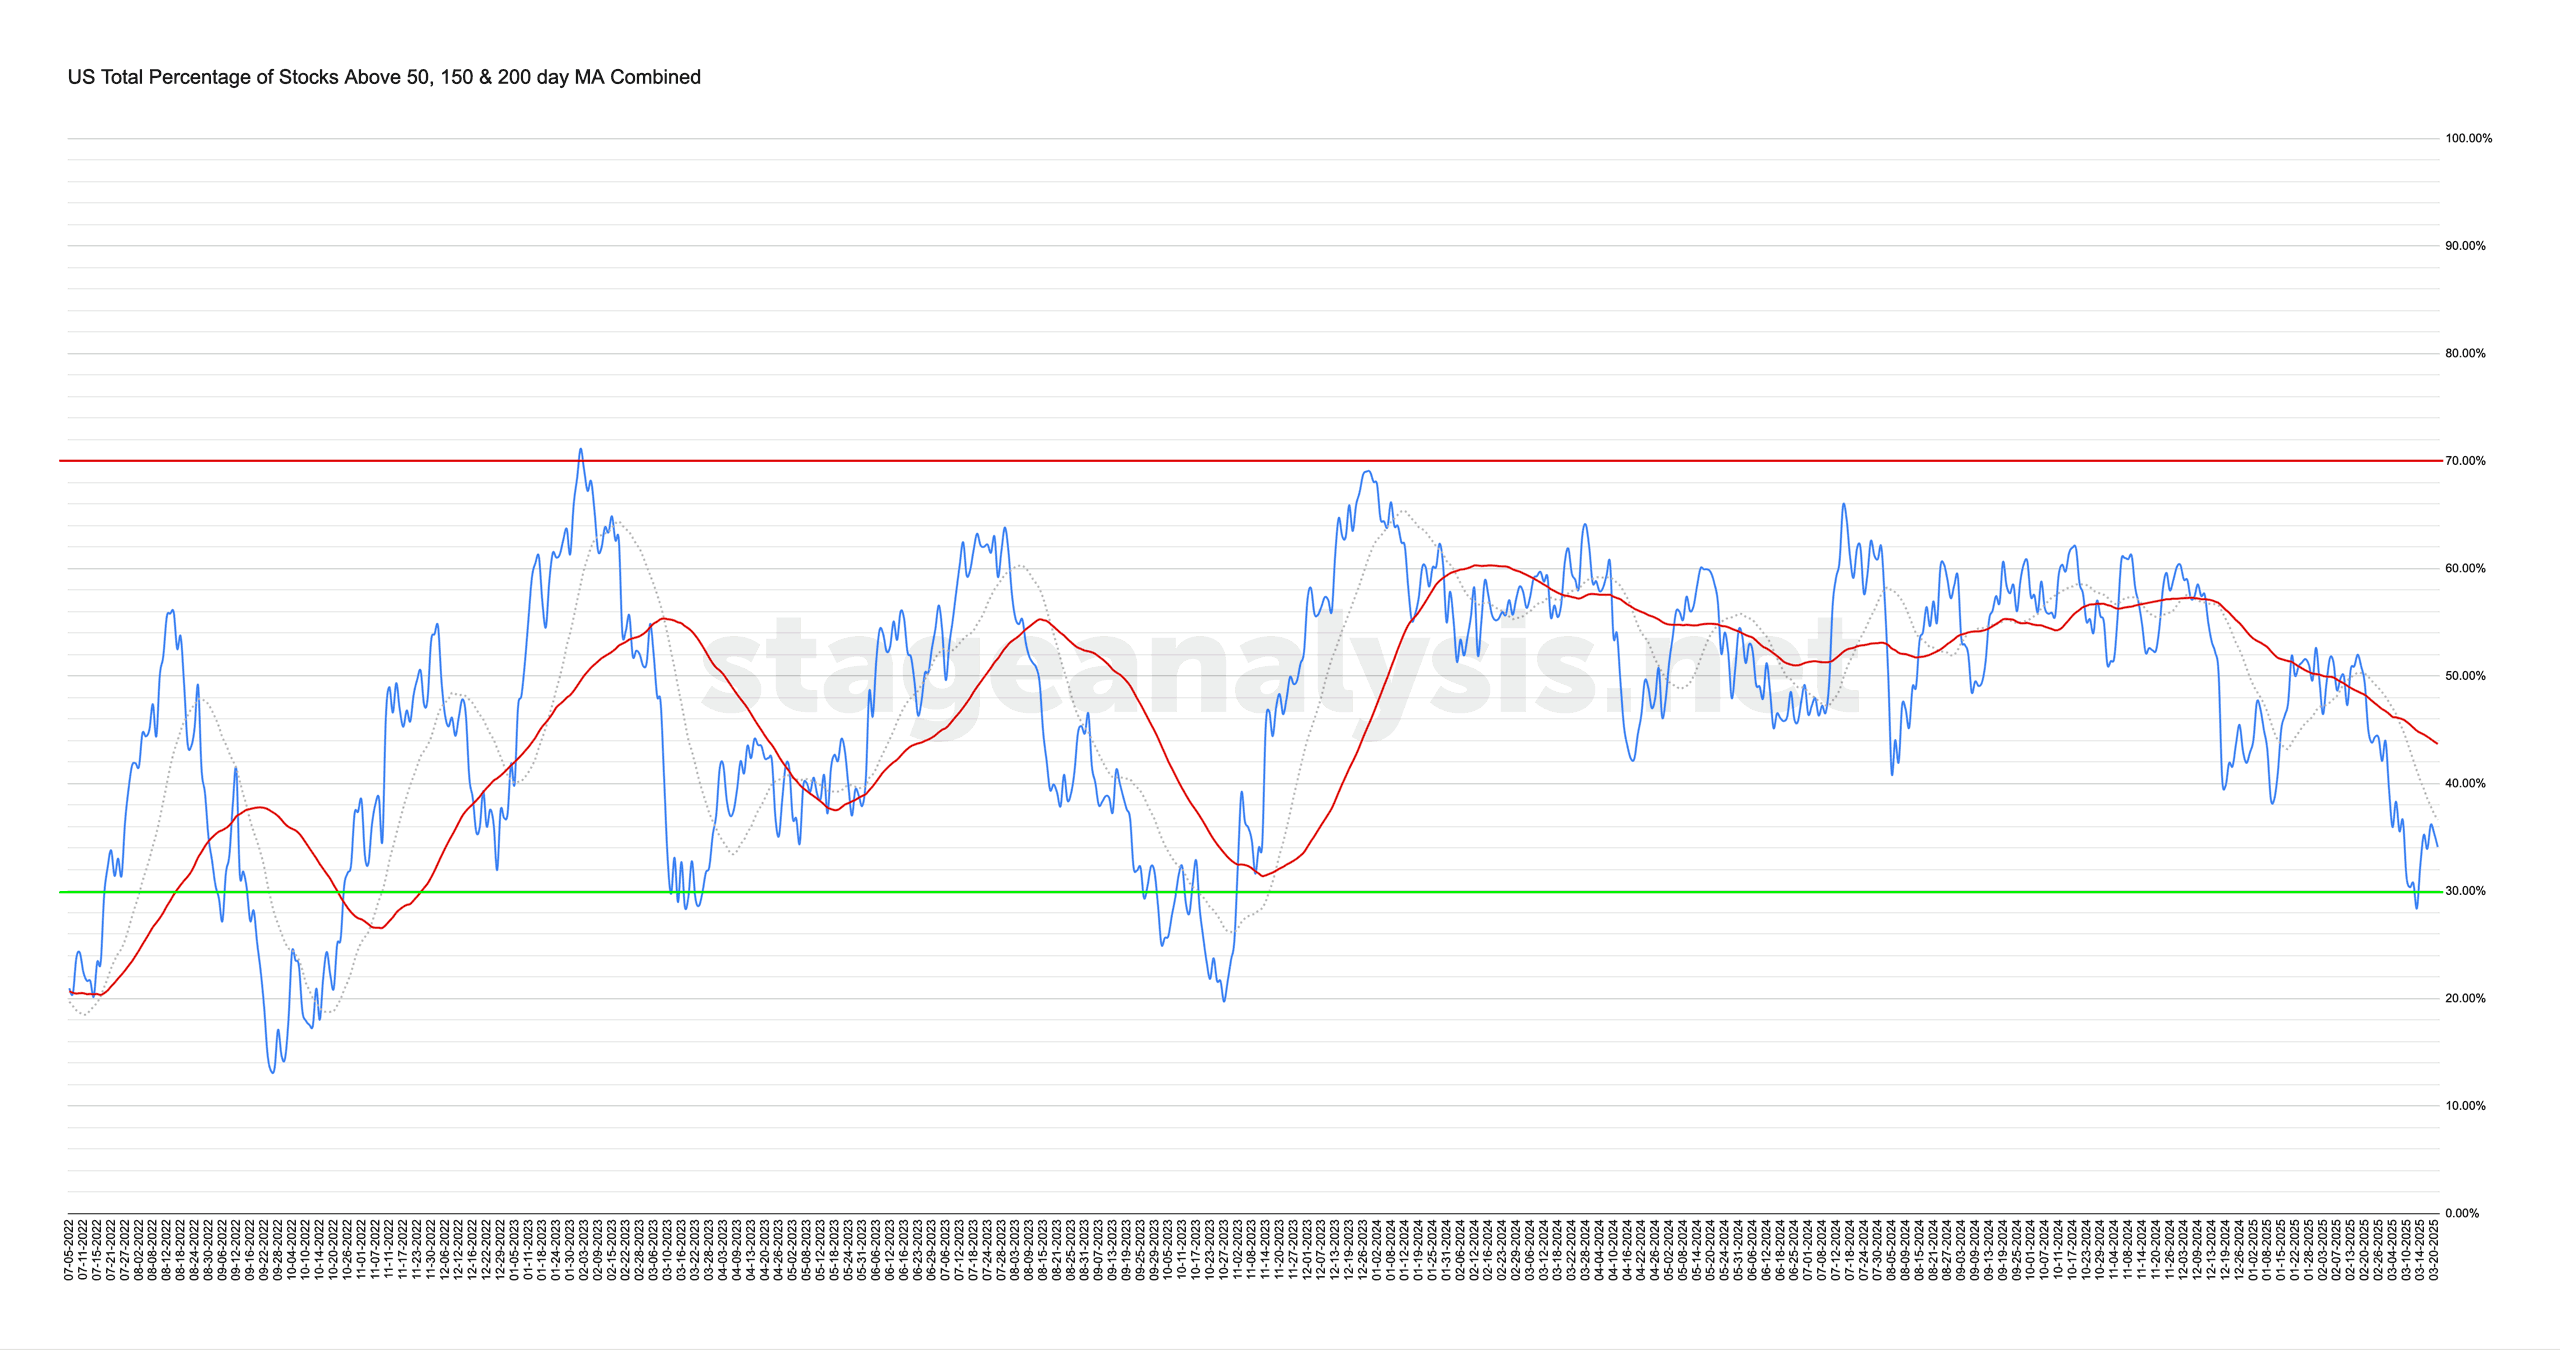
The US Total Percentage of Stocks above their 50 Day, 150 Day & 200 Day Moving Averages (shown above) increased by +1.69% this week.
Therefore, the overall combined average is at 34.10% in the US market (NYSE and Nasdaq markets combined) above their short, medium and long term moving averages.
The combined average consolidated this week, ending with a minor increase, taking it to within -2.51% of its 20 day MA. But still a long way below its 50 day MA signal line at -9.58%. So it remains on a Difficult Environment status to start the new week. Hence, a cautious approach on the long side remains prudent.
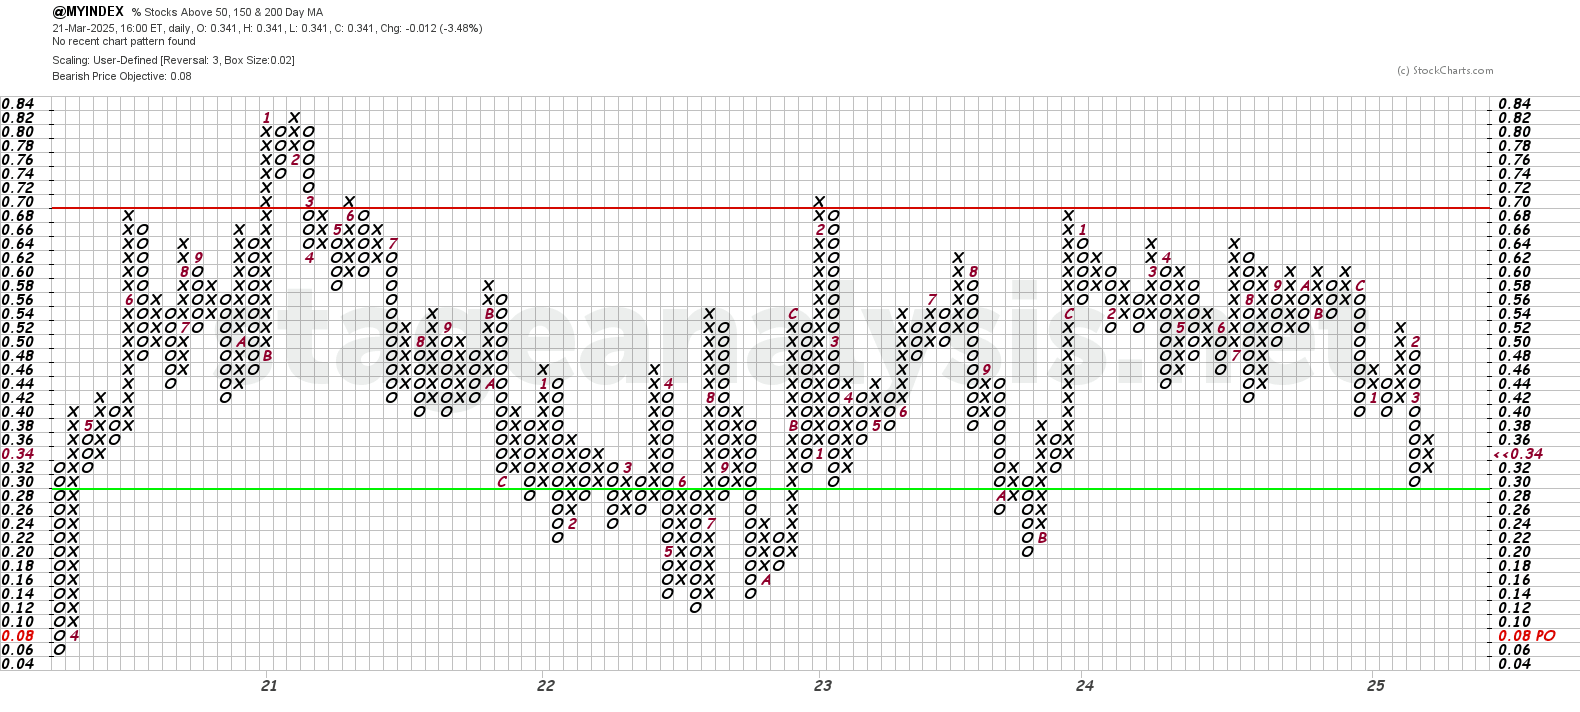
The Point and Figure (P&F) chart (shown above) reversed to a column of Xs on the 19th, and so the P&F strategy changed to Offense (as it is in a column of Xs), and P&F Bear Correction status in the lower half of the field.
See the Bullish Percent article for more information on the P&F statuses.
Become a Stage Analysis Member:
To see more like this and other premium content, such as the regular US Stocks watchlist, detailed videos and intraday posts, become a Stage Analysis member.
Join Today
Disclaimer: For educational purpose only. Not investment advice. Seek professional advice from a financial advisor before making any investing decisions.