
Market Breadth: Percentage of Stocks Above their 50 Day, 150 Day & 200 Day Moving Averages Combined
The full post is available to view by members only. For immediate access:
32.41% (-4.13% 1wk)
Status: Difficult Environment
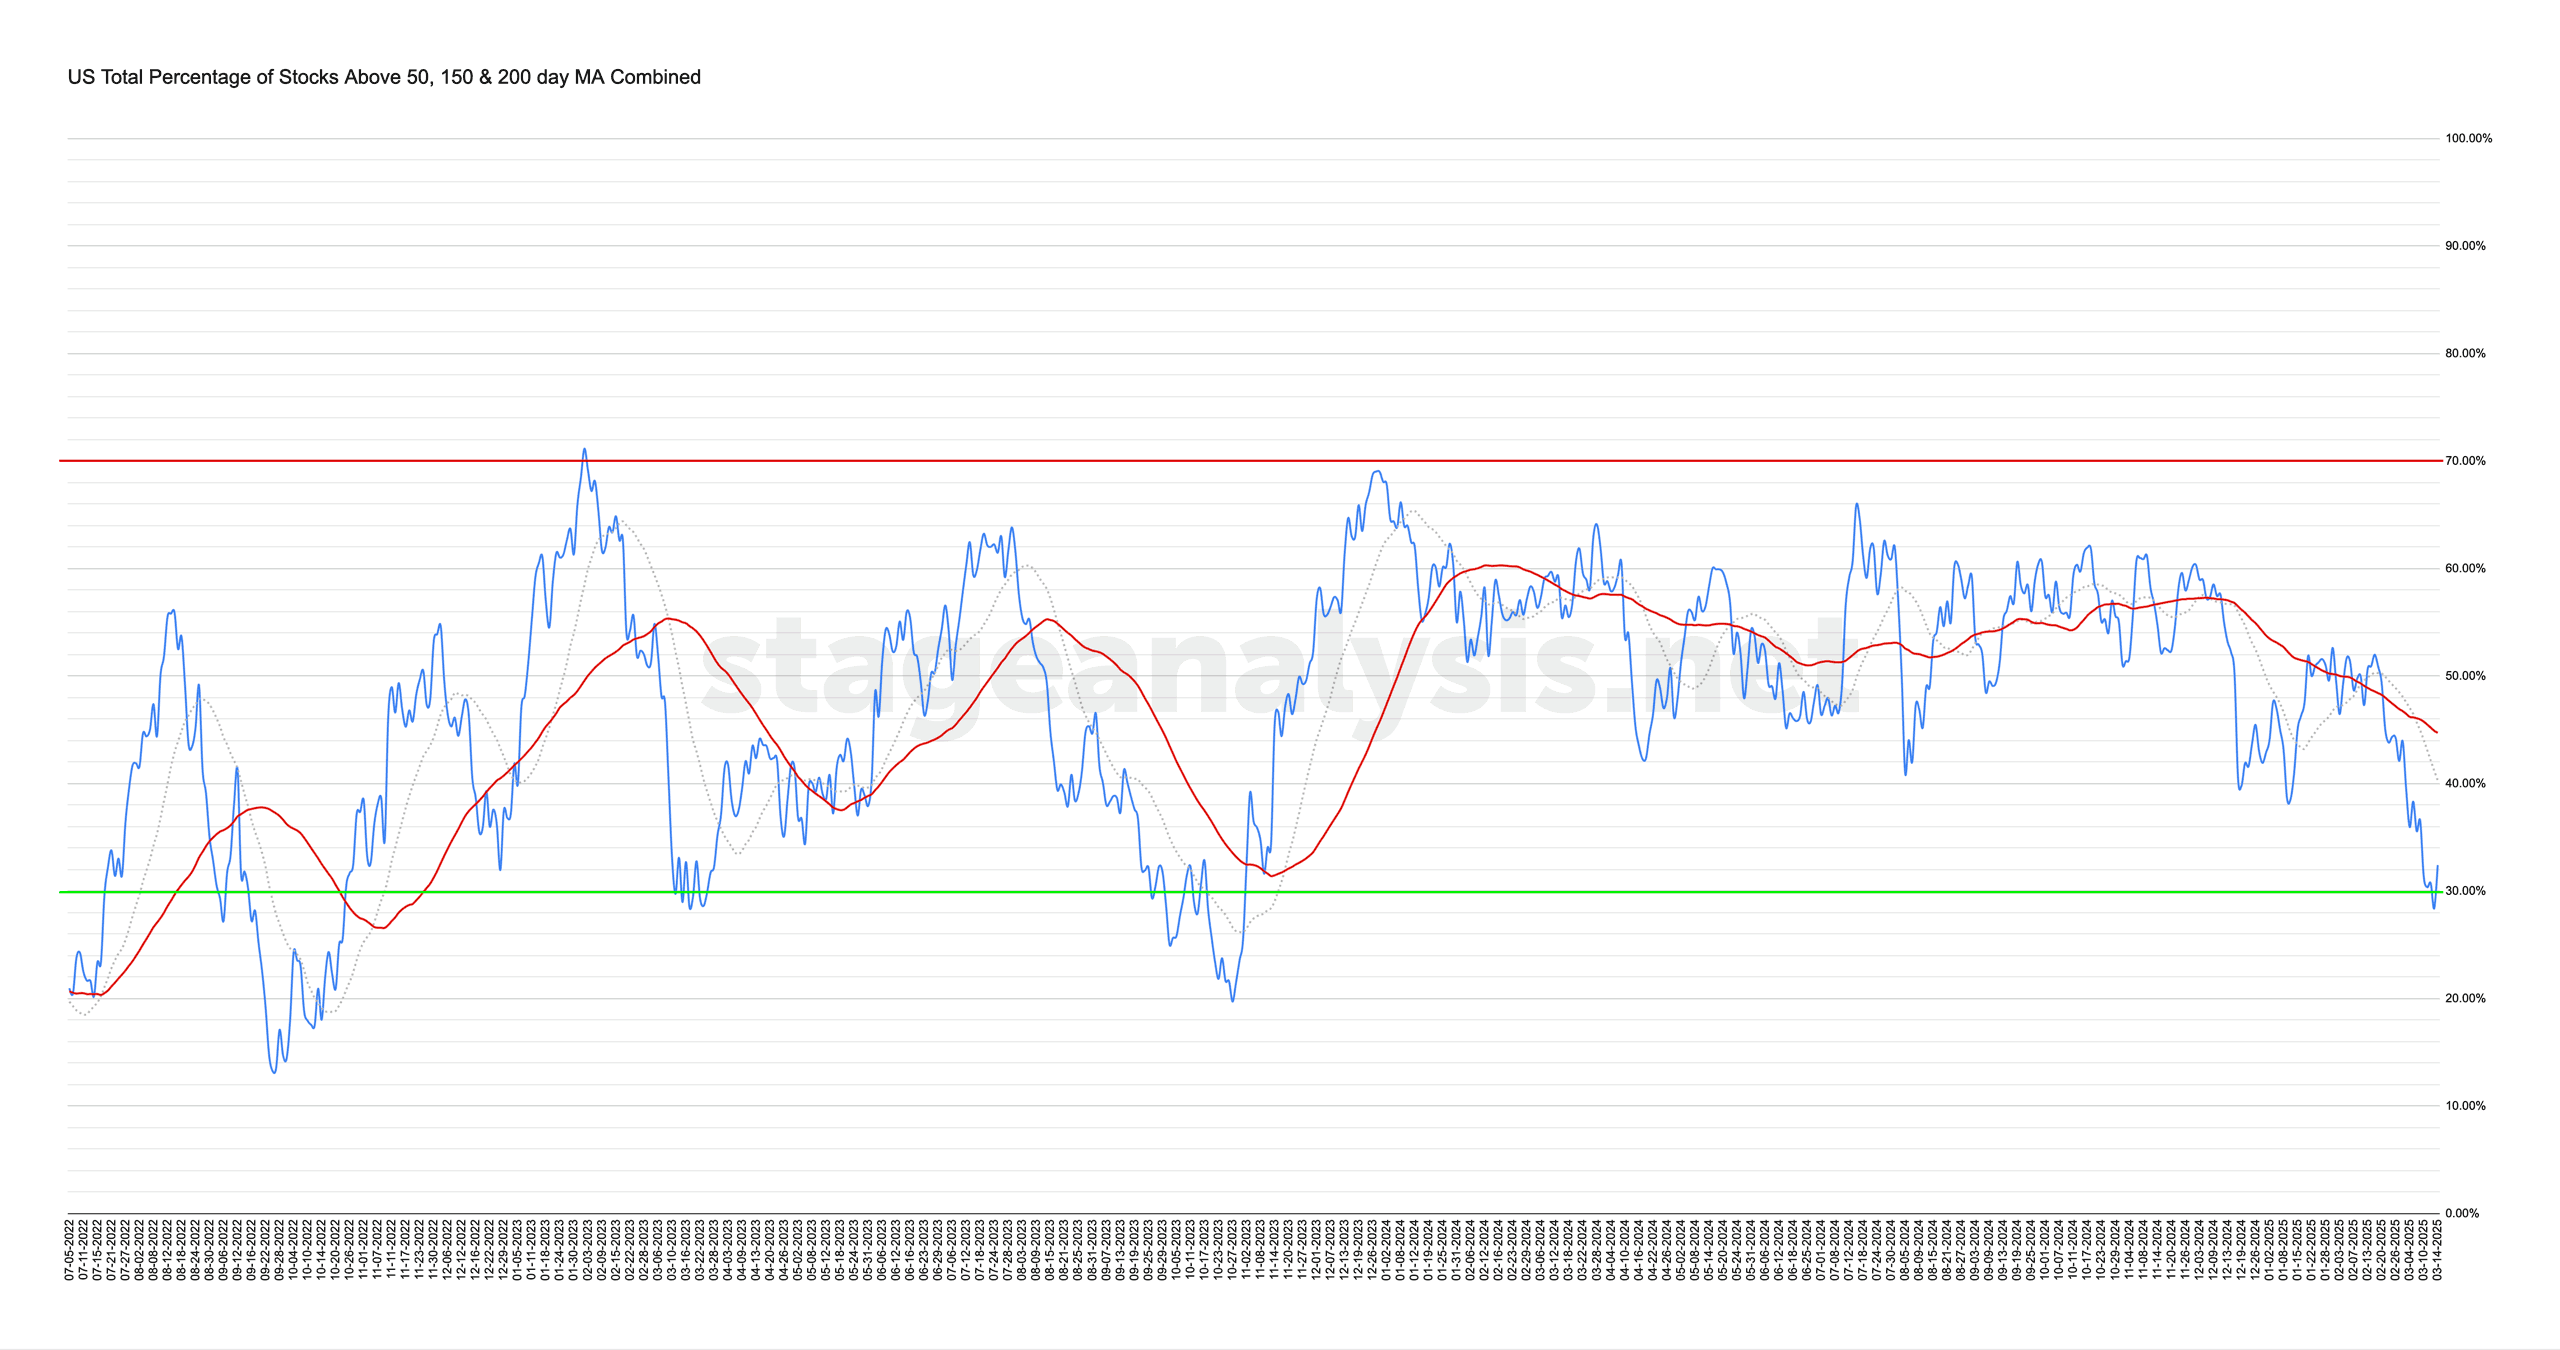
The US Total Percentage of Stocks above their 50 Day, 150 Day & 200 Day Moving Averages (shown above) decreased by -4.13% this week.
Therefore, the overall combined average is at 32.41% in the US market (NYSE and Nasdaq markets combined) above their short, medium and long term moving averages.
The combined average continued its decline lower this week, and even managed to drop into the lower zone (below 30%) for the first time since the late 2023 decline. But rebounded on Friday to close back above it again. So will the short-term strength follow through with a short-covering rally, or will it quickly fizzle out before another leg lower that takes the market into the lower zone properly?
So it's a dangerous spot in the market either way. Hence, caution remains prudent.
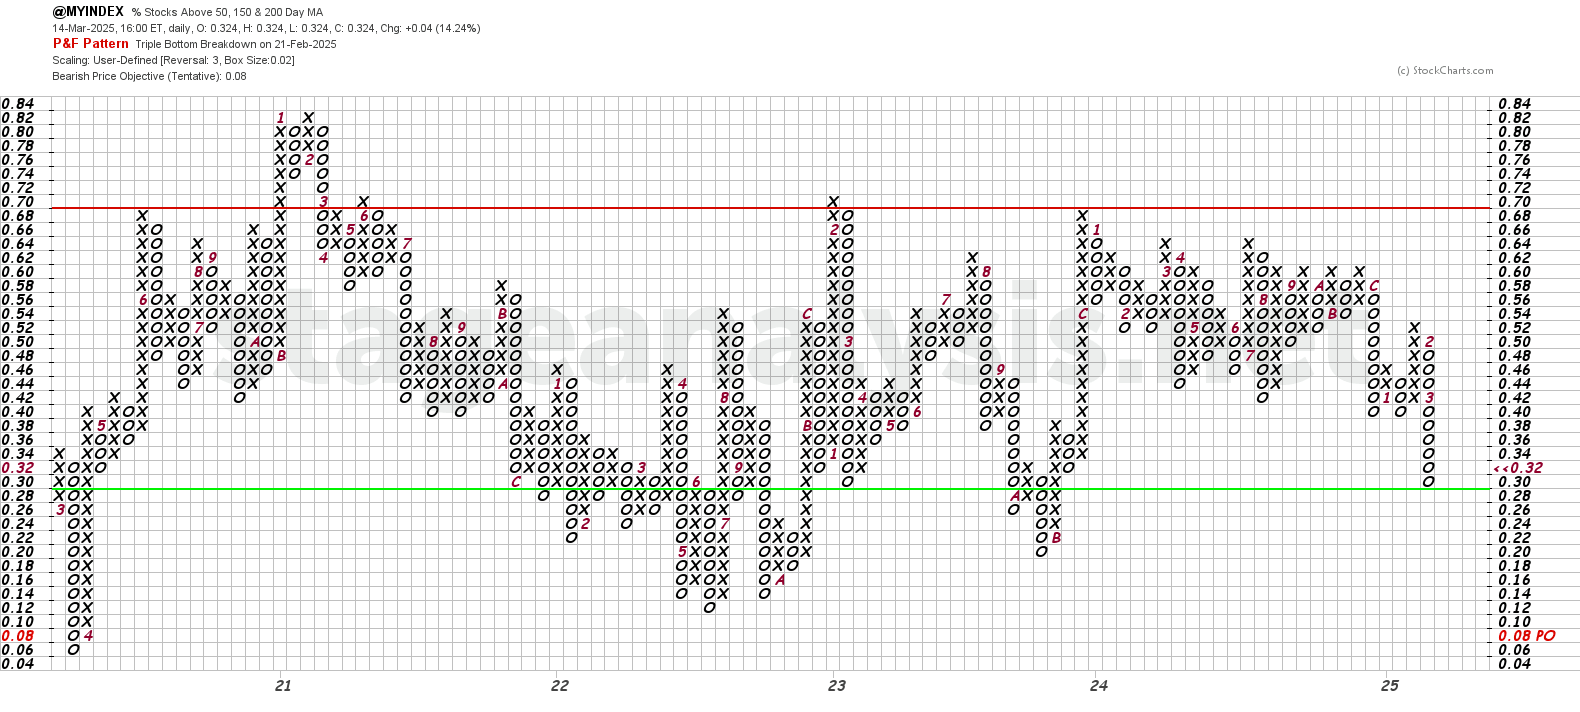
The Point and Figure (P&F) chart (shown above) added an additional 3 Os to its current column, and so the P&F strategy remains on Defense (as it is in a column of Os), and also remained on P&F Bear Confirmed status in the lower half of the field.
See the Bullish Percent article for more information on the P&F statuses.
Become a Stage Analysis Member:
To see more like this and other premium content, such as the regular US Stocks watchlist, detailed videos and intraday posts, become a Stage Analysis member.
Join Today
Disclaimer: For educational purpose only. Not investment advice. Seek professional advice from a financial advisor before making any investing decisions.