
Market Breadth: Percentage of Stocks Above their 50 Day, 150 Day & 200 Day Moving Averages Combined
The full post is available to view by members only. For immediate access:
43.94% (-1.14% 1wk)
Status: Difficult Environment
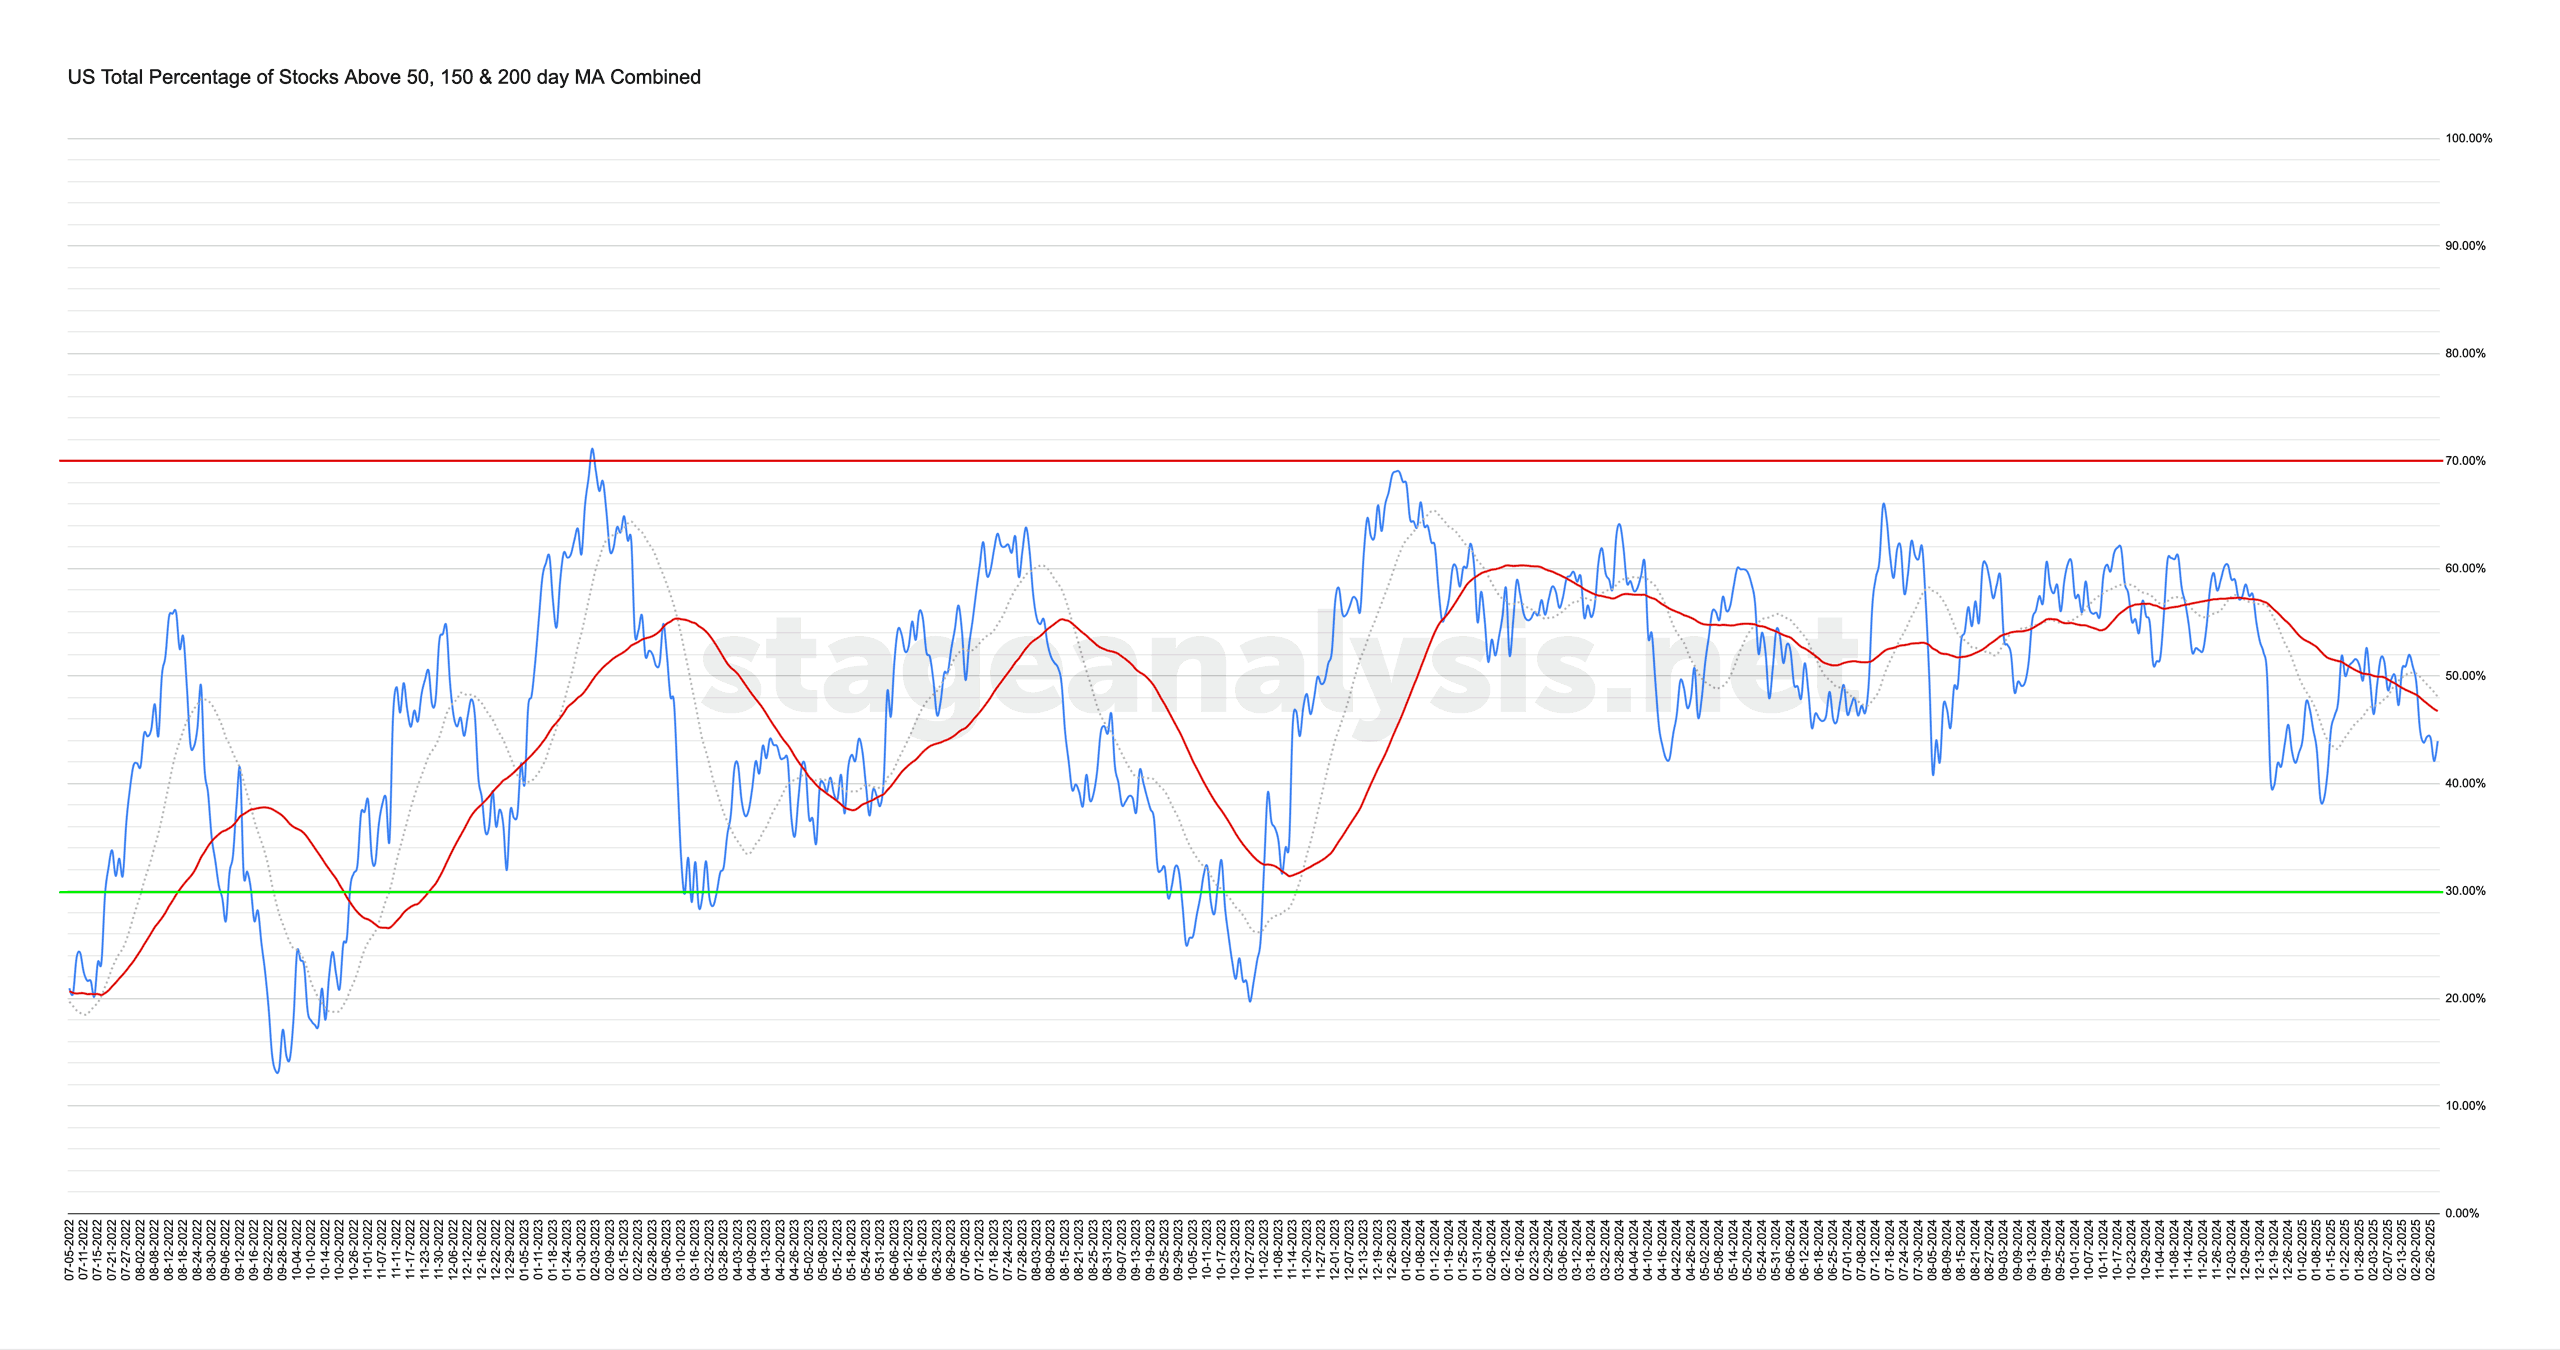
The US Total Percentage of Stocks above their 50 Day, 150 Day & 200 Day Moving Averages (shown above) decreased by -1.14% this week.
Therefore, the overall combined average is at 43.94% in the US market (NYSE and Nasdaq markets combined) above their short, medium and long term moving averages.
The overall combined average continued lower this week, but ended the week with a slight rebound to -4.12% below its 20 day MA and -2.80% below its 50 day MA (signal line). So the status remained on a Difficult Environment.
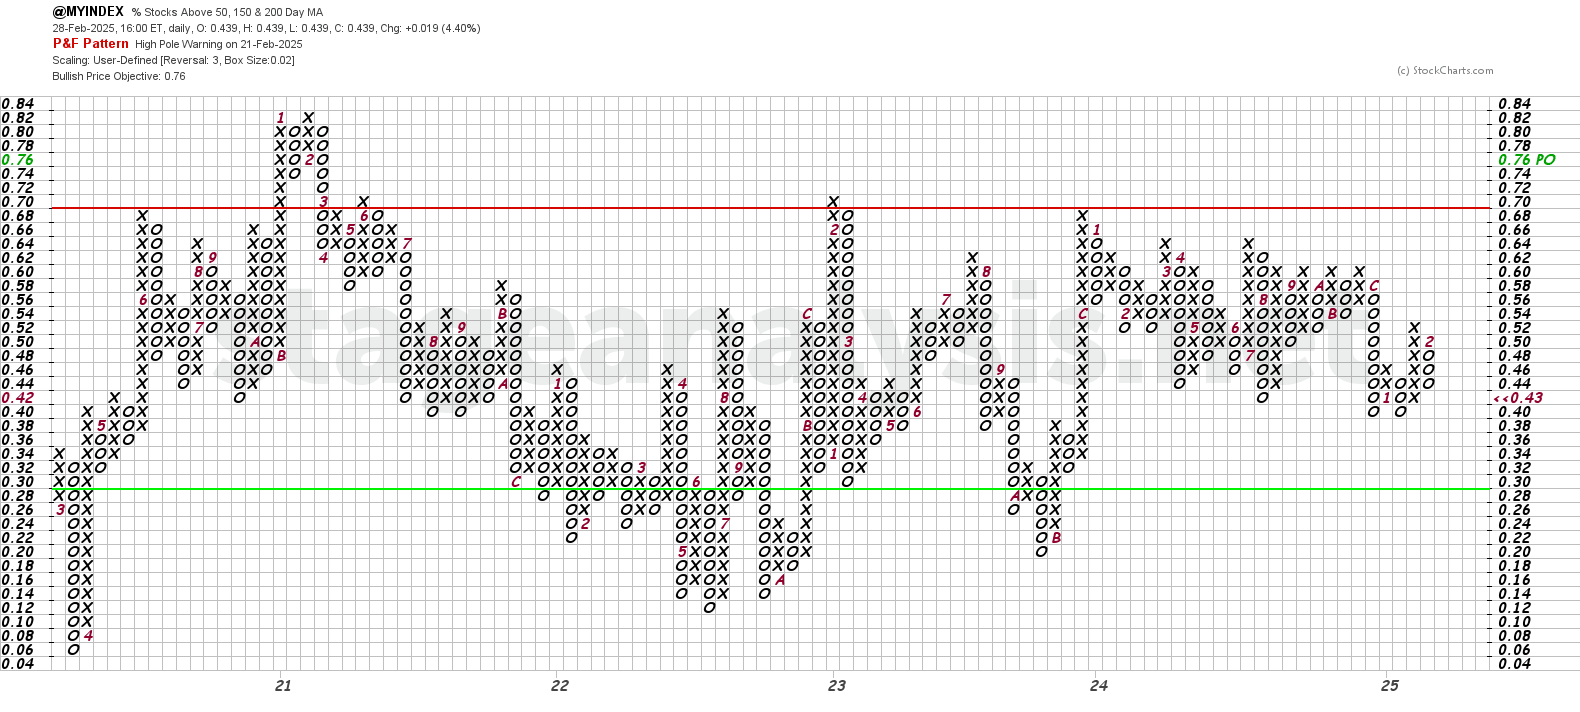
The Point and Figure (P&F) chart (shown above) added an additional O to it's current column, and so the P&F strategy remains on Defense (as it is in a column of Os), and P&F Bull Correction status – but with a high pole warning in a neutral- overall field position.
See the Bullish Percent article for more information on the P&F statuses.
Become a Stage Analysis Member:
To see more like this and other premium content, such as the regular US Stocks watchlist, detailed videos and intraday posts, become a Stage Analysis member.
Join Today
Disclaimer: For educational purpose only. Not investment advice. Seek professional advice from a financial advisor before making any investing decisions.