
Market Breadth: Percentage of Stocks Above their 50 Day, 150 Day & 200 Day Moving Averages Combined
The full post is available to view by members only. For immediate access:
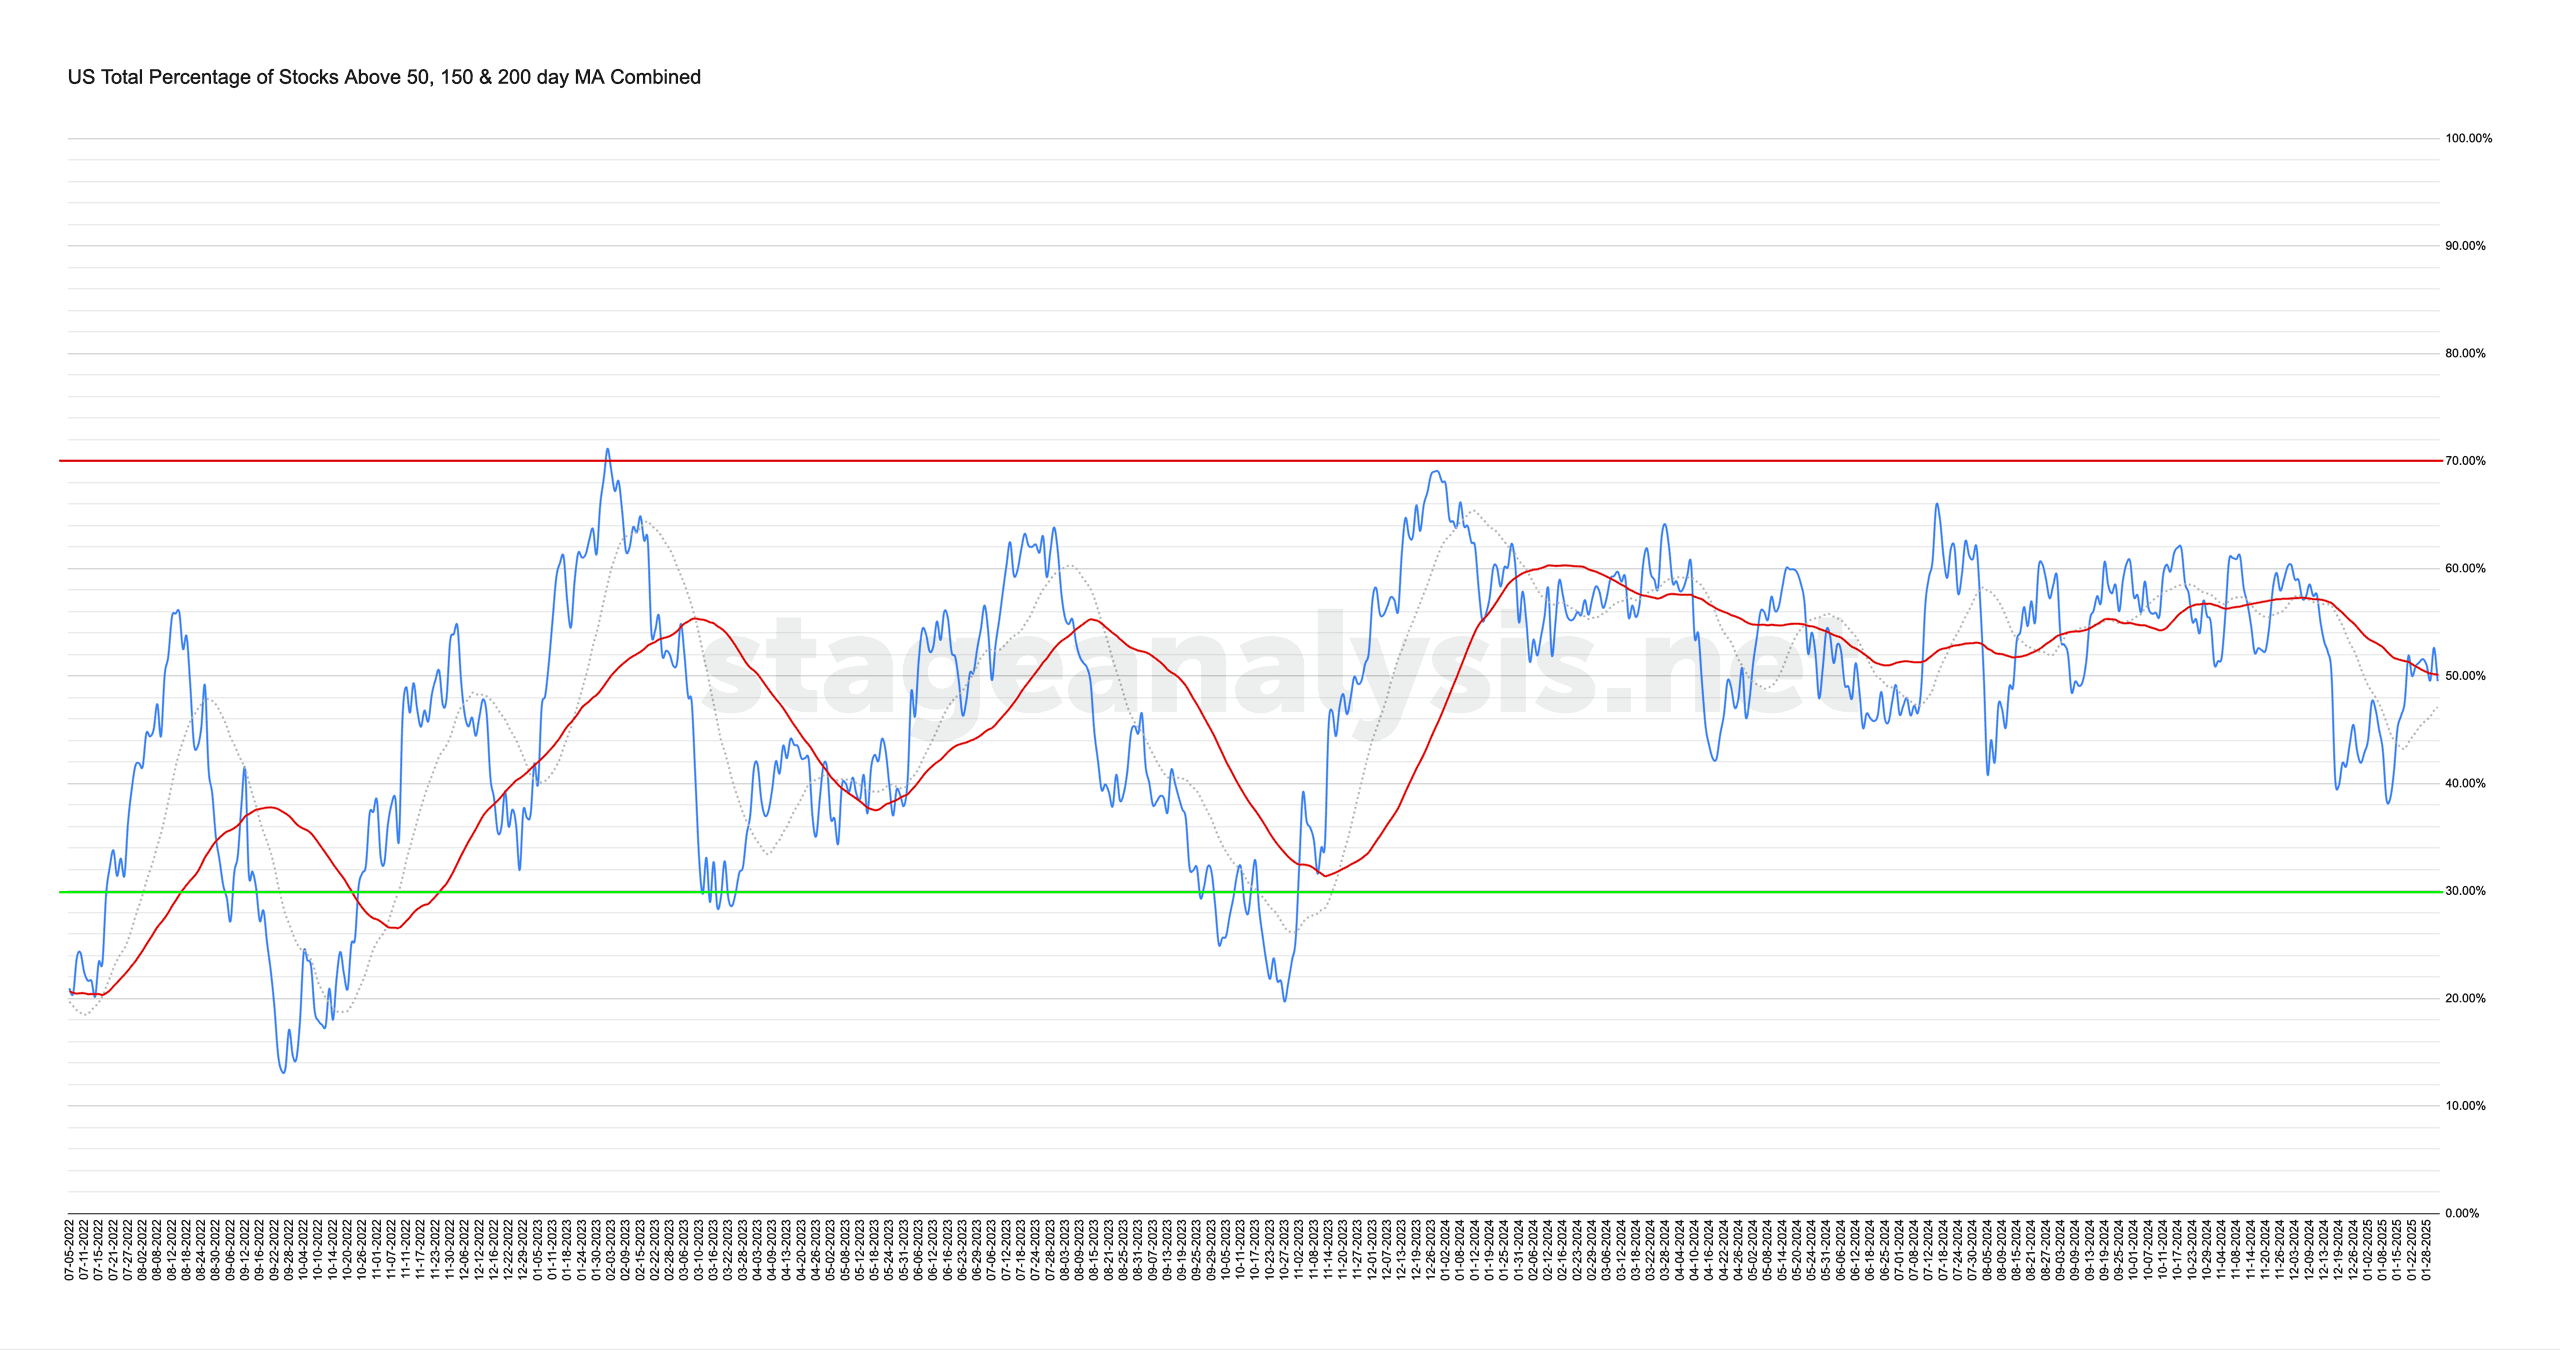
49.52% (-1.76% 1wk)
Status: Neutral Environment
The US Total Percentage of Stocks above their 50 Day, 150 Day & 200 Day Moving Averages (shown above) decreased by -1.76% this week.
Therefore, the overall combined average is at 49.52% in the US market (NYSE and Nasdaq markets combined) above their short, medium and long term moving averages.
The overall combined average consolidated around its 50 day MA (signal line) this week, crossing it multiple times and ending the week slightly below it, by -0.61%. The 20 day MA is moving up closer too, with the average +2.42% above it currently. So the status remains on a Neutral Environment to start the new week.
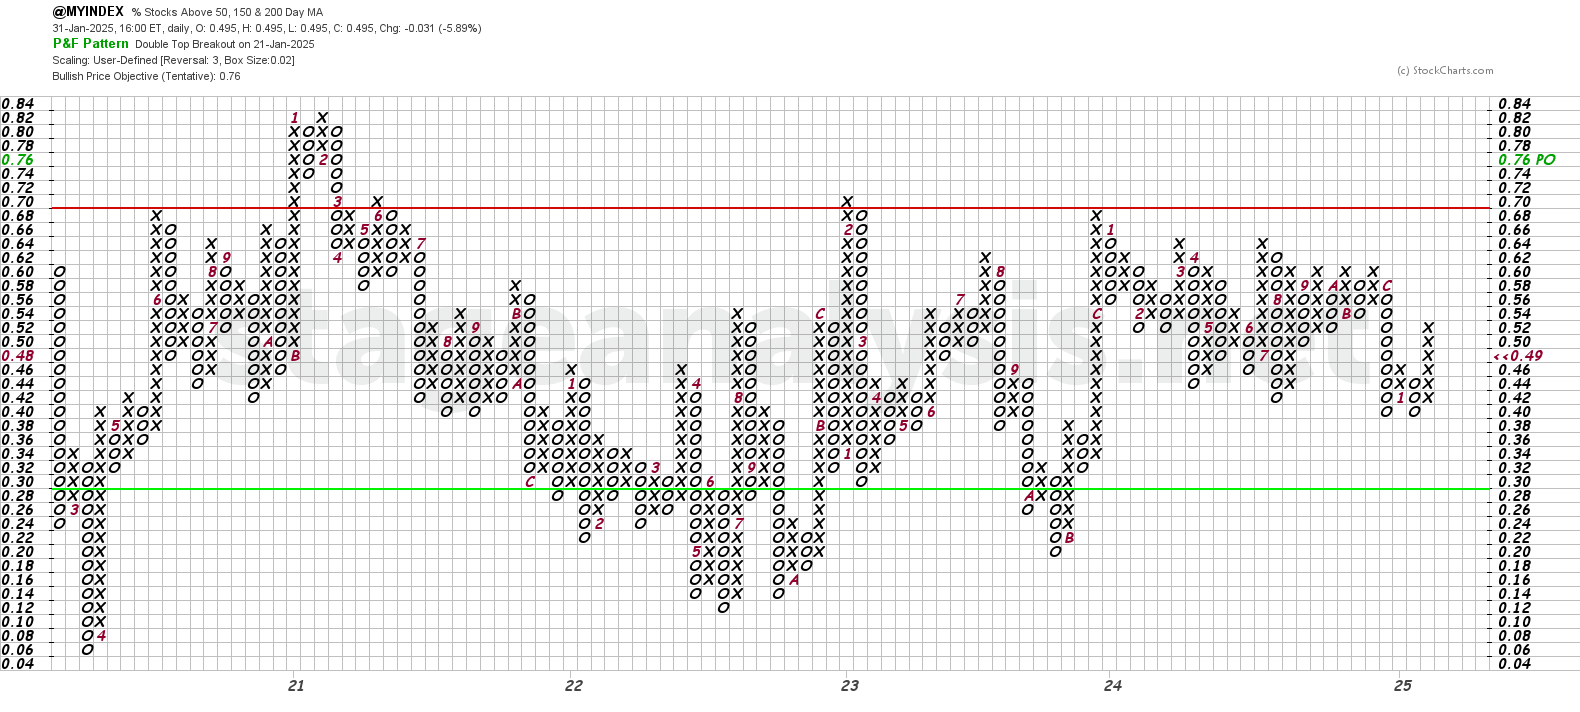
The Point and Figure (P&F) chart (shown above) was unchanged and remains in a column of Xs, and so the P&F strategy remains on Offense (as it is in a column of Xs), and on P&F Bull Confirmed status in a very neutral overall field position.
To reverse to a column of Os and change status, it would need to close below 46%.
See the Bullish Percent article for more information on the P&F statuses.
Become a Stage Analysis Member:
To see more like this and other premium content, such as the regular US Stocks watchlist, detailed videos and intraday posts, become a Stage Analysis member.
Join Today
Disclaimer: For educational purpose only. Not investment advice. Seek professional advice from a financial advisor before making any investing decisions.