
Market Breadth: Percentage of Stocks Above their 50 Day, 150 Day & 200 Day Moving Averages Combined
The full post is available to view by members only. For immediate access:
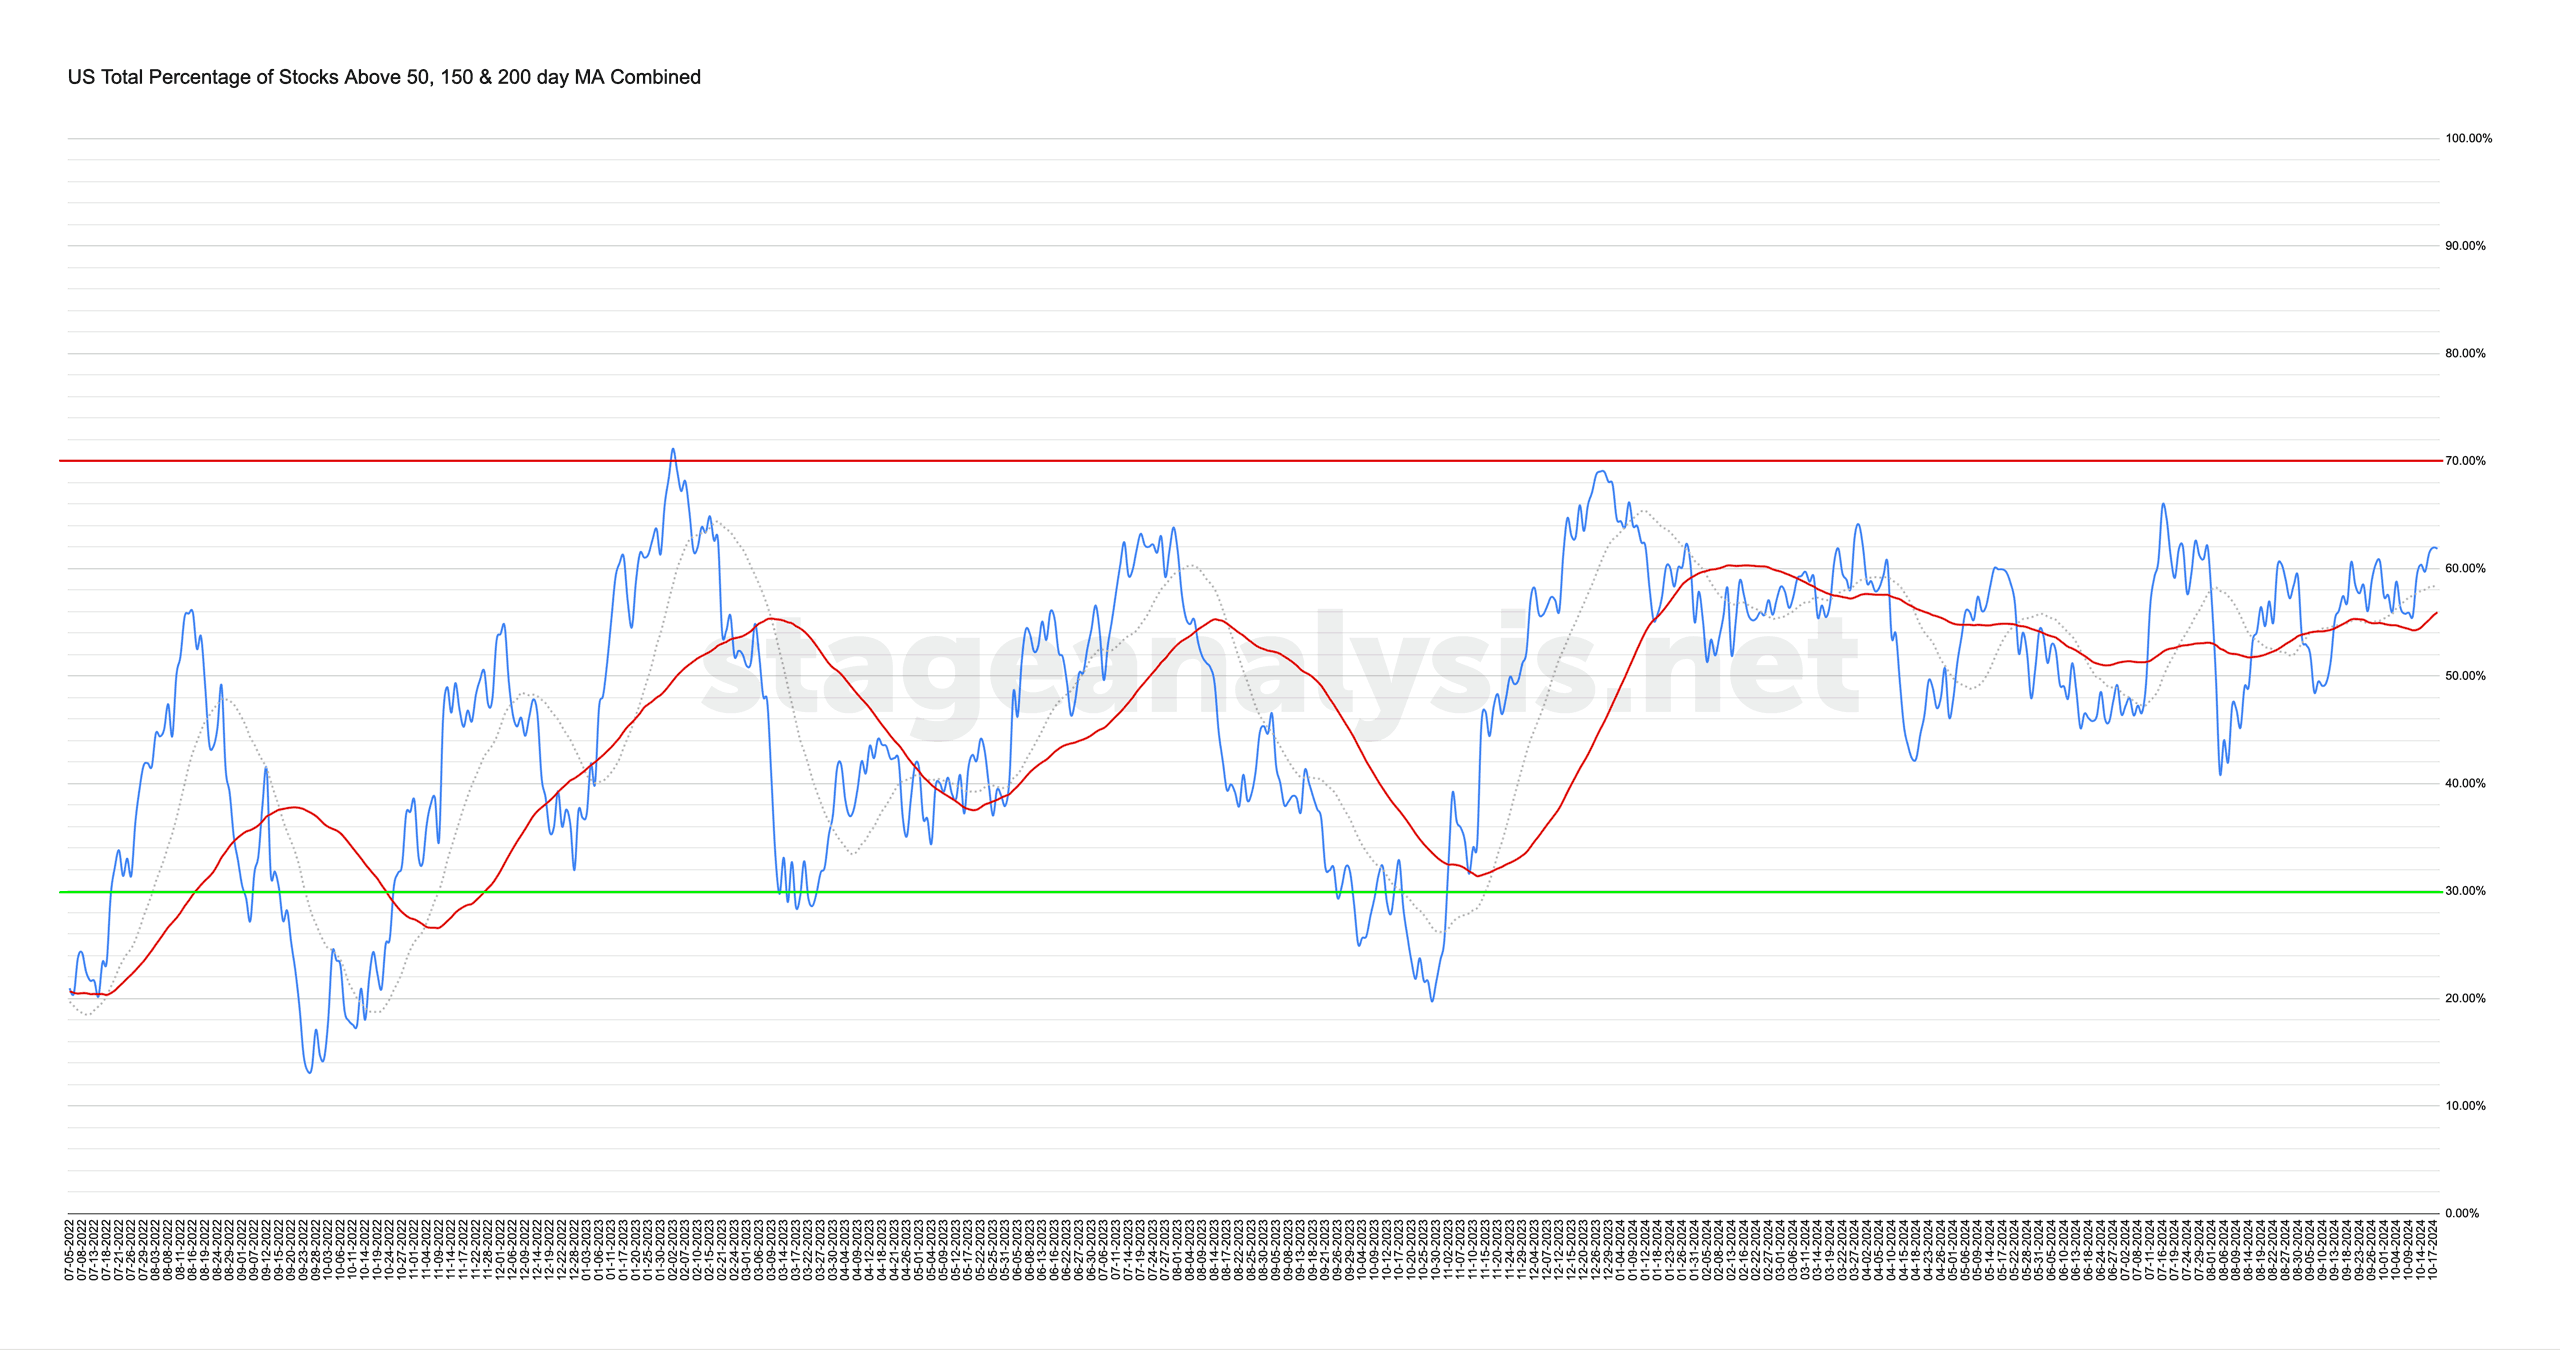
61.84% (+2.46% 1wk)
Status: Tentative Positive Environment
The US Total Percentage of Stocks above their 50 Day, 150 Day & 200 Day Moving Averages (shown above) decreased by +2.46% this week.
Therefore, the overall combined average is at 61.84% in the US market (NYSE and Nasdaq markets combined) above their short, medium and long term moving averages.
The overall combined average edged higher this week, moving above the three most recent pivot highs, but not with a lot of conviction as yet. So the status has changed from Neutral to a Positive Environment, but with the word Tentative attached until it's a clear of the range, as it could easily drop back into the neutral range from the current level still.
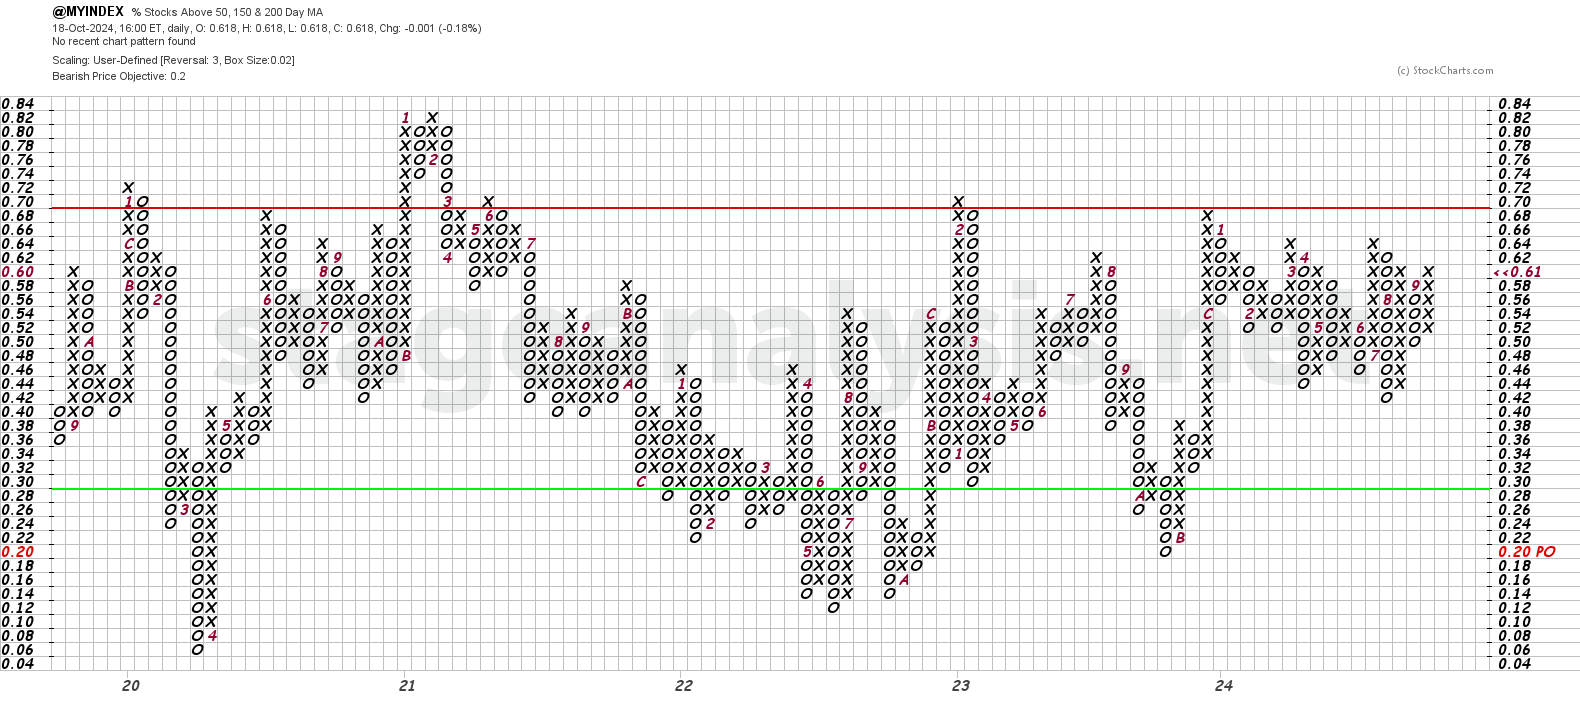
The Point and Figure (P&F) chart (shown above) was once again unchanged this week as the price hovered just below the key 62% level, that is needed for it to close above in order to make the breakout, and so the P&F strategy remains on Offense (as it is in a column of Xs), and P&F Bear Correction status in the middle of the field.
So it still needs a close above the 62% level to make a double top breakout, and change to Bull Confirmed, and a reversal would occur on a close below the 54% level.
See the Bullish Percent article for more information on the P&F statuses.
Become a Stage Analysis Member:
To see more like this and other premium content, such as the regular US Stocks watchlist, detailed videos and intraday posts, become a Stage Analysis member.
Join Today
Disclaimer: For educational purpose only. Not investment advice. Seek professional advice from a financial advisor before making any investing decisions.