
Market Breadth: Percentage of Stocks Above their 50 Day, 150 Day & 200 Day Moving Averages Combined
The full post is available to view by members only. For immediate access:
60.44% (+2.00% 1wk)
Status: Neutral Environment
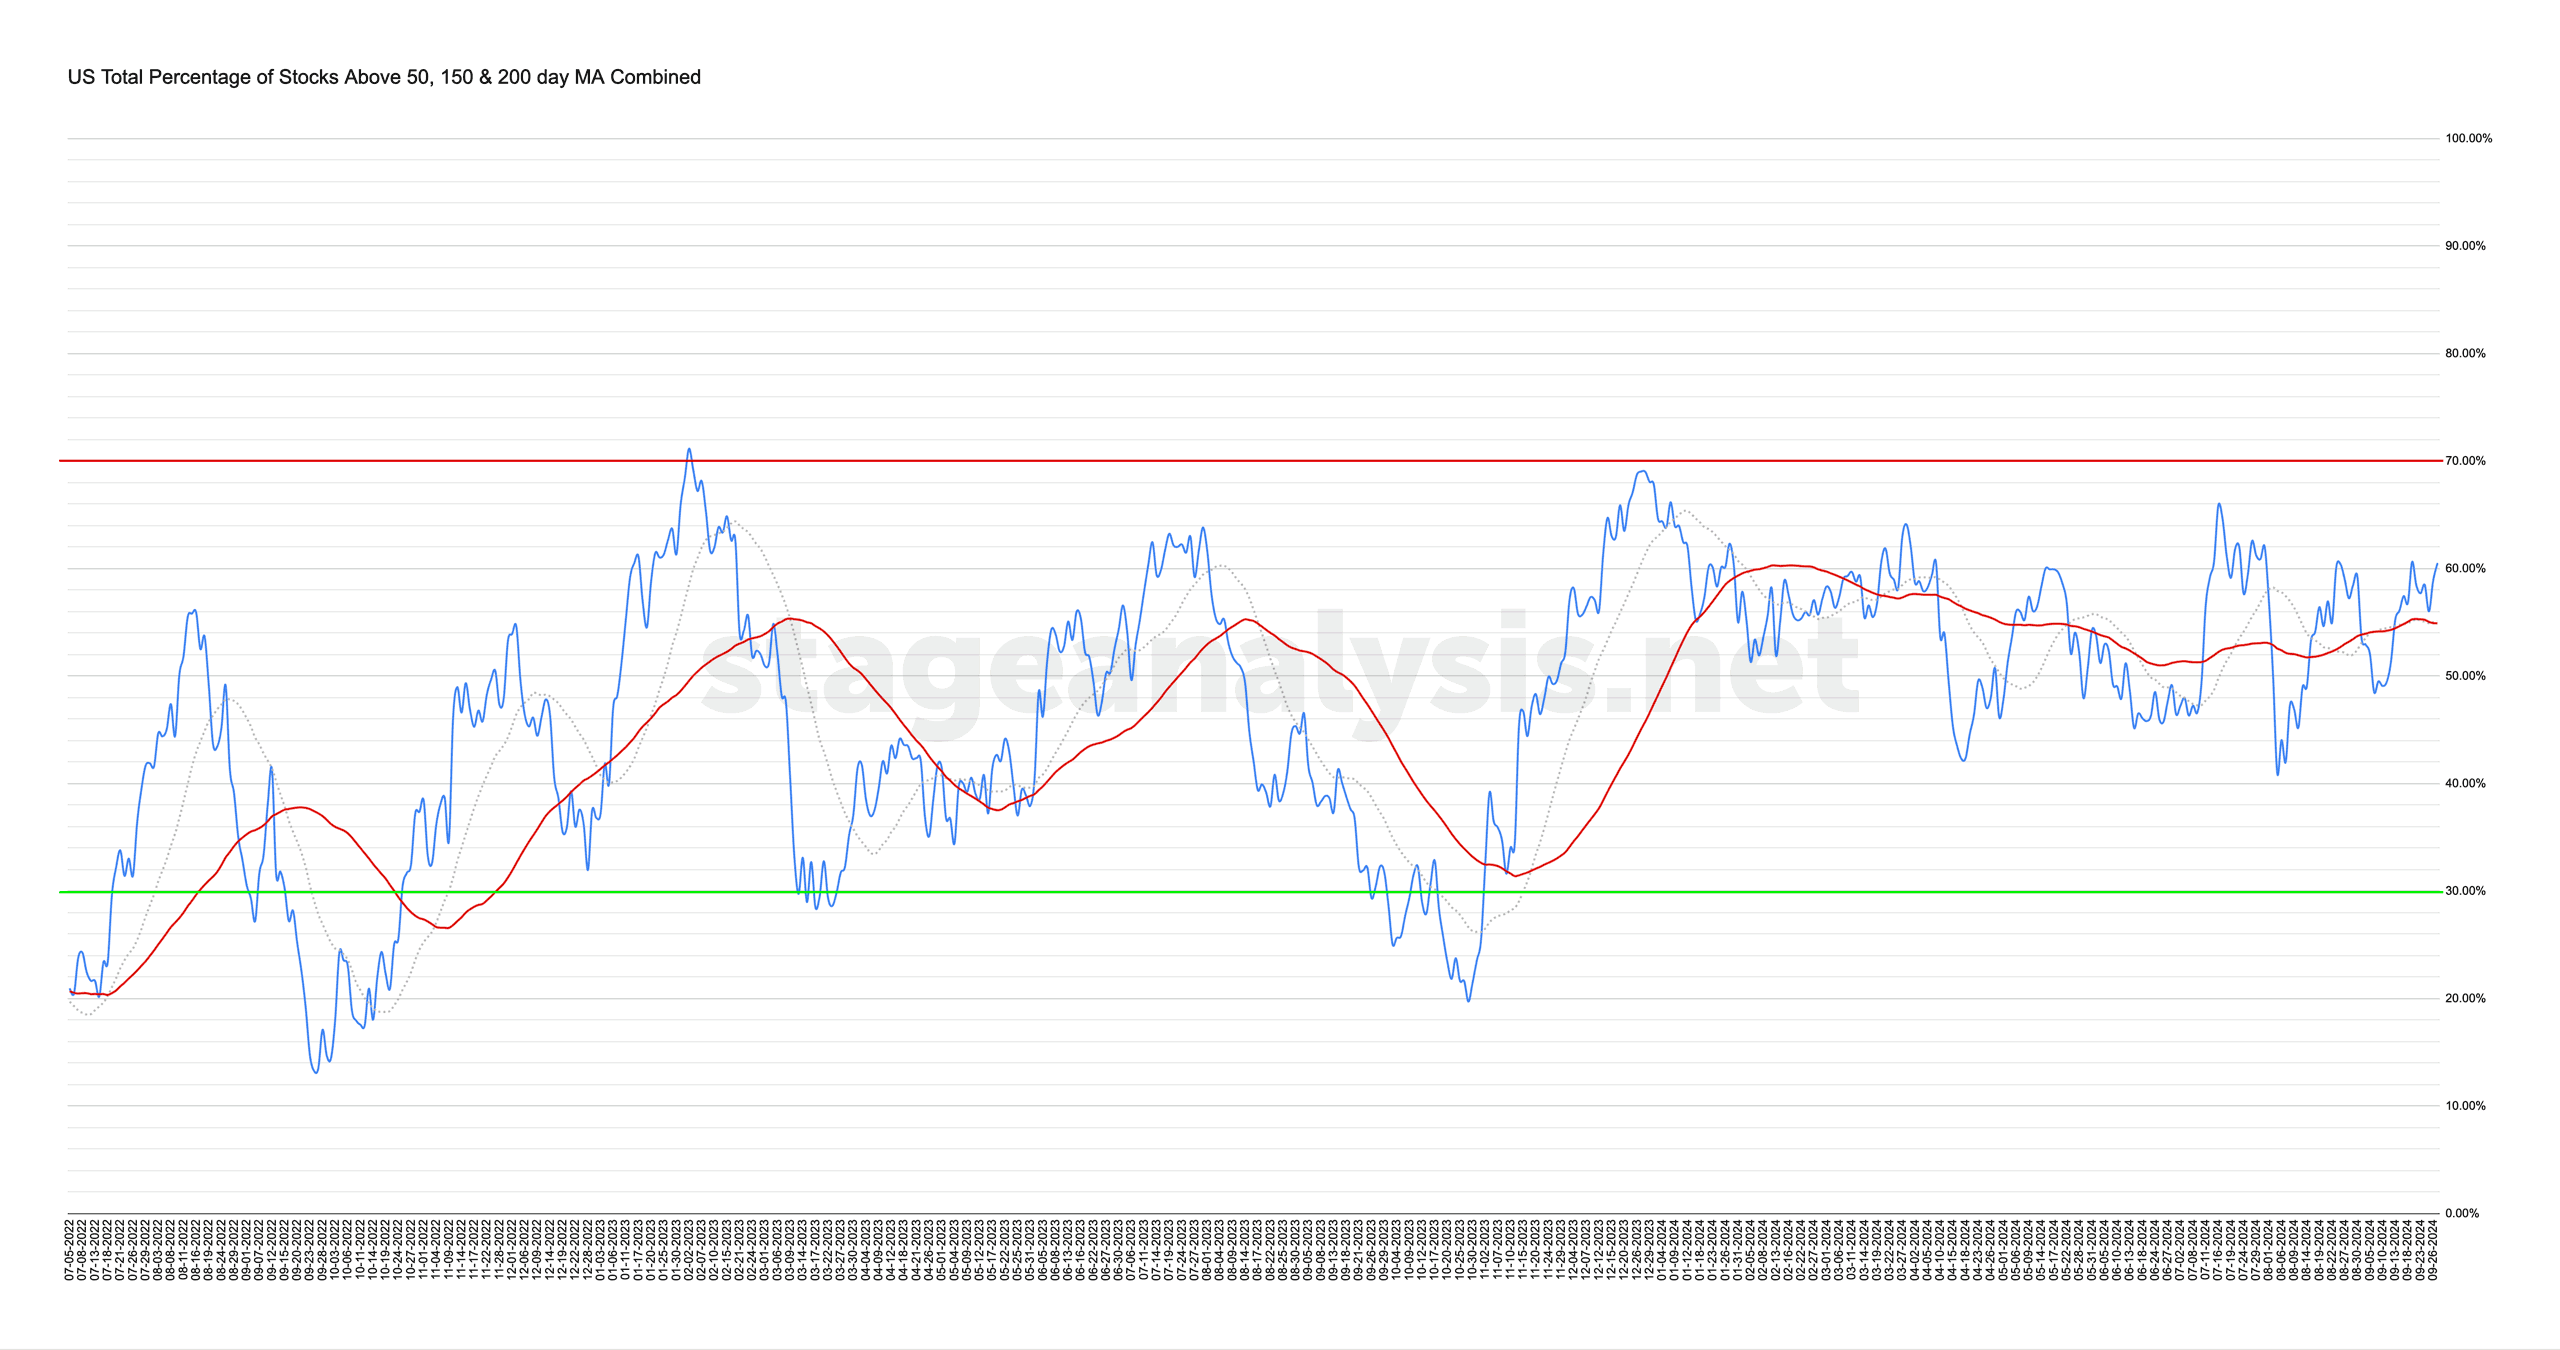
The US Total Percentage of Stocks above their 50 Day, 150 Day & 200 Day Moving Averages (shown above) increased by +2.00% this week.
Therefore, the overall combined average is at 60.44% in the US market (NYSE and Nasdaq markets combined) above their short, medium and long term moving averages.
The overall combined average edged higher this week towards the top of the recent range, which is well defined, with this being the third test of pivot highs in the last few months. Of note is the contraction in volatility in the moving average breadth data, with three contractions since the August breakdown, and the most recent low held above the 50 day MA. So there's potential for a breakout attempt in the coming week, as it only needs a 2% move higher, which if it occurs, would change it to a Positive environment status. But currently it remains on a Neutral Environment status
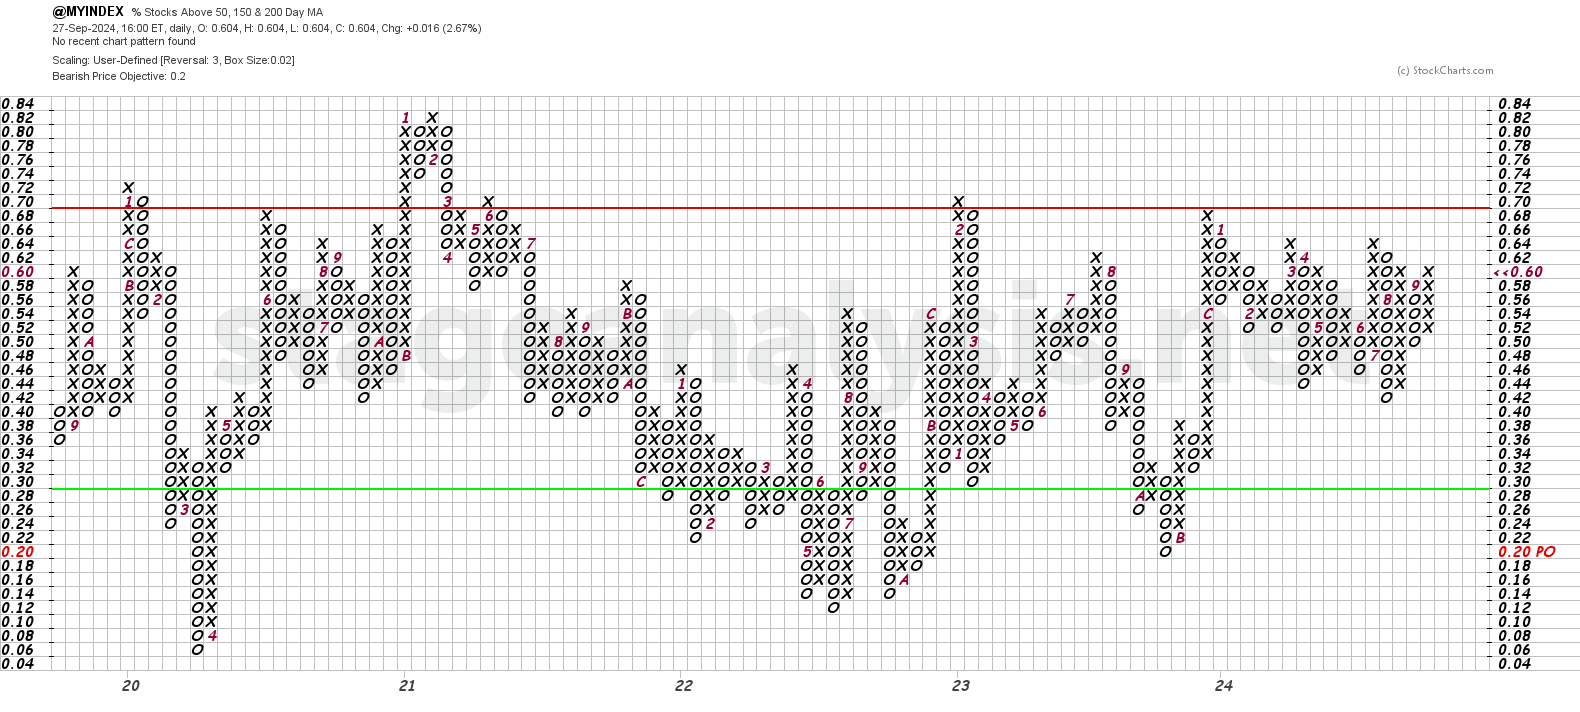
The Point and Figure (P&F) chart (shown above) was unchanged this week, and so the P&F strategy remains on Offense (as it is in a column of Xs), and P&F Bear Correction status in the middle of the field. But the price is sitting just under the prior pivot high. So a close above the 62% level would make a double top breakout, and hence would change it to Bull Confirmed. So any strength early in the week could potentially trigger that change.
See the Bullish Percent article for more information on the P&F statuses.
Become a Stage Analysis Member:
To see more like this and other premium content, such as the regular US Stocks watchlist, detailed videos and intraday posts, become a Stage Analysis member.
Join Today
Disclaimer: For educational purpose only. Not investment advice. Seek professional advice from a financial advisor before making any investing decisions.