
Market Breadth: Percentage of Stocks Above their 50 Day, 150 Day & 200 Day Moving Averages Combined
The full post is available to view by members only. For immediate access:
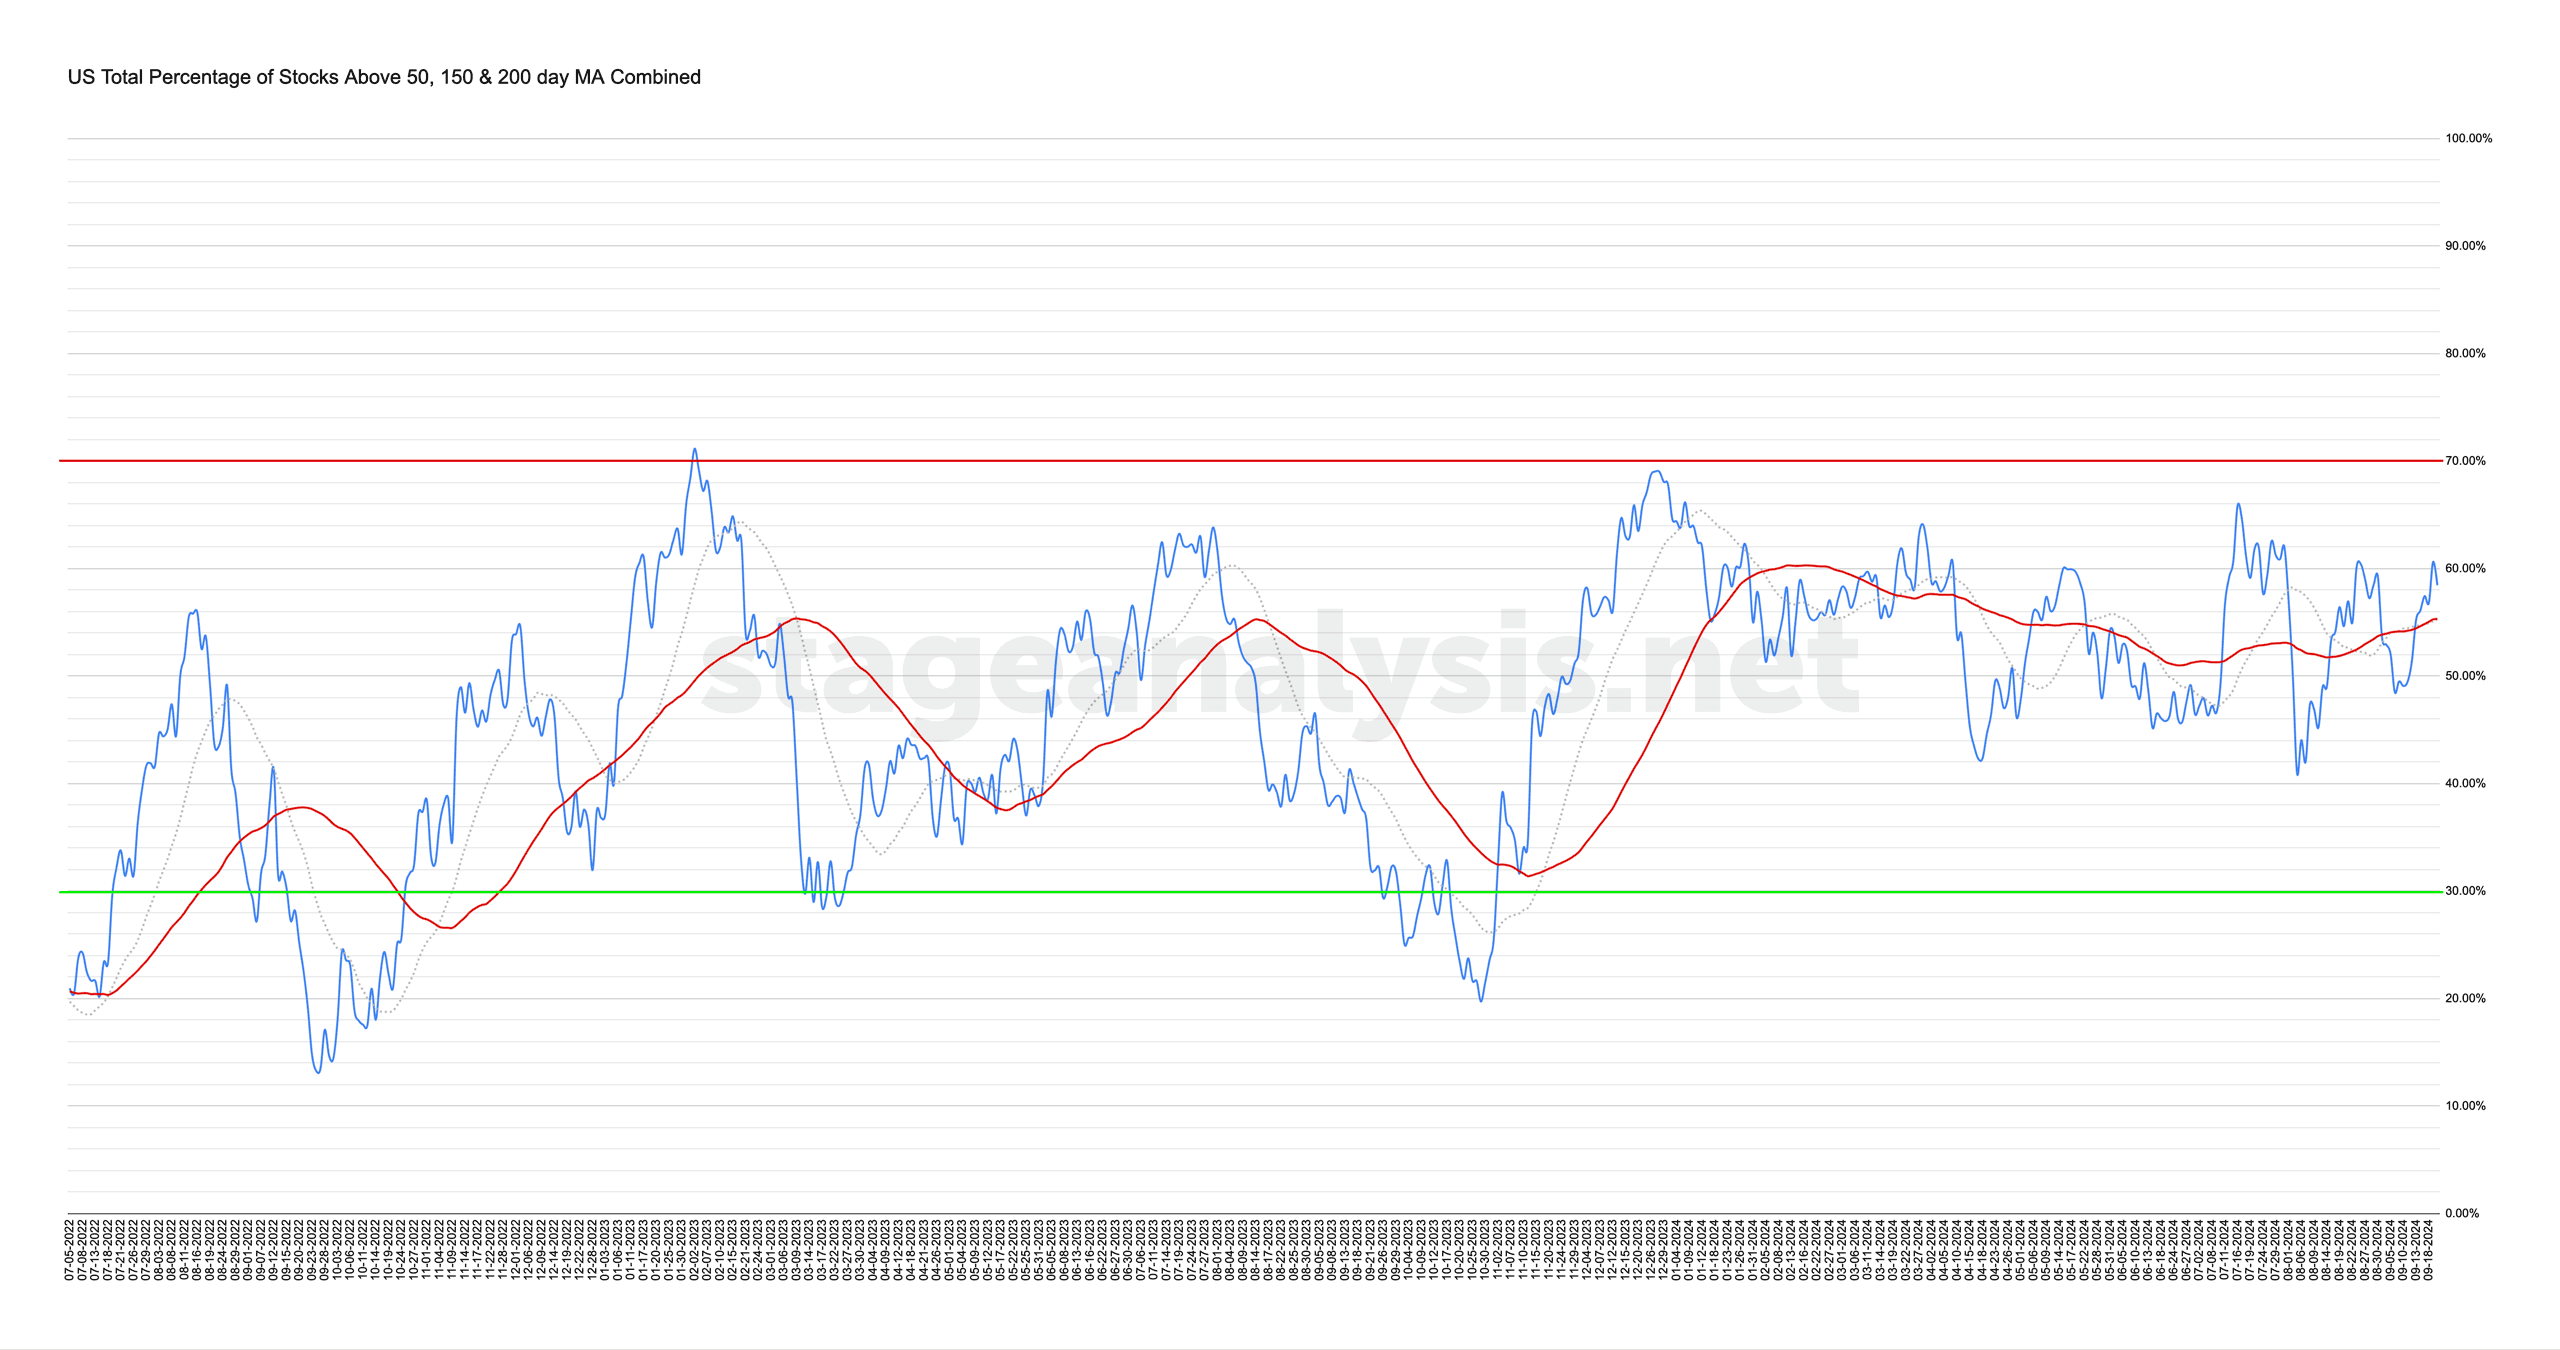
58.44% (+3.21% 1wk)
Status: Neutral Environment
The US Total Percentage of Stocks above their 50 Day, 150 Day & 200 Day Moving Averages (shown above) increased by +3.21% this week.
Therefore, the overall combined average is at 58.44% in the US market (NYSE and Nasdaq markets combined) above their short, medium and long term moving averages.
The overall combined average continued higher this week, briefly moving above the key 60% level and recent swing high on Thursday. But it pulled back below it again on Friday, and thus although it is above its 20 and 50 day moving averages, which is technically positive territory. It's yet to clear the recent pivot high, and so remains on a Neutral Environment status for now, with the more defensive sectors still leading overall.

The Point and Figure (P&F) chart (shown above) column reversed this week, rising by 5 Xs, but didn't manage to make a double top breakout – which would require a close above the 62% level, and so the P&F strategy moved to Offense (as it is in a column of Xs), and the P&F status has changed to Bear Correction status in the middle of the field. So remains fairly directionless still, which has been the case for the last few months.
See the Bullish Percent article for more information on the P&F statuses.
Become a Stage Analysis Member:
To see more like this – US Stocks watchlist posts, detailed videos each weekend, use our unique Stage Analysis tools, such as the US Stocks & ETFs Screener, Charts, Market Breadth, Group Relative Strength and more...
Join Today
Disclaimer: For educational purpose only. Not investment advice. Seek professional advice from a financial advisor before making any investing decisions.