
Market Breadth: Percentage of Stocks Above their 50 Day, 150 Day & 200 Day Moving Averages Combined
The full post is available to view by members only. For immediate access:
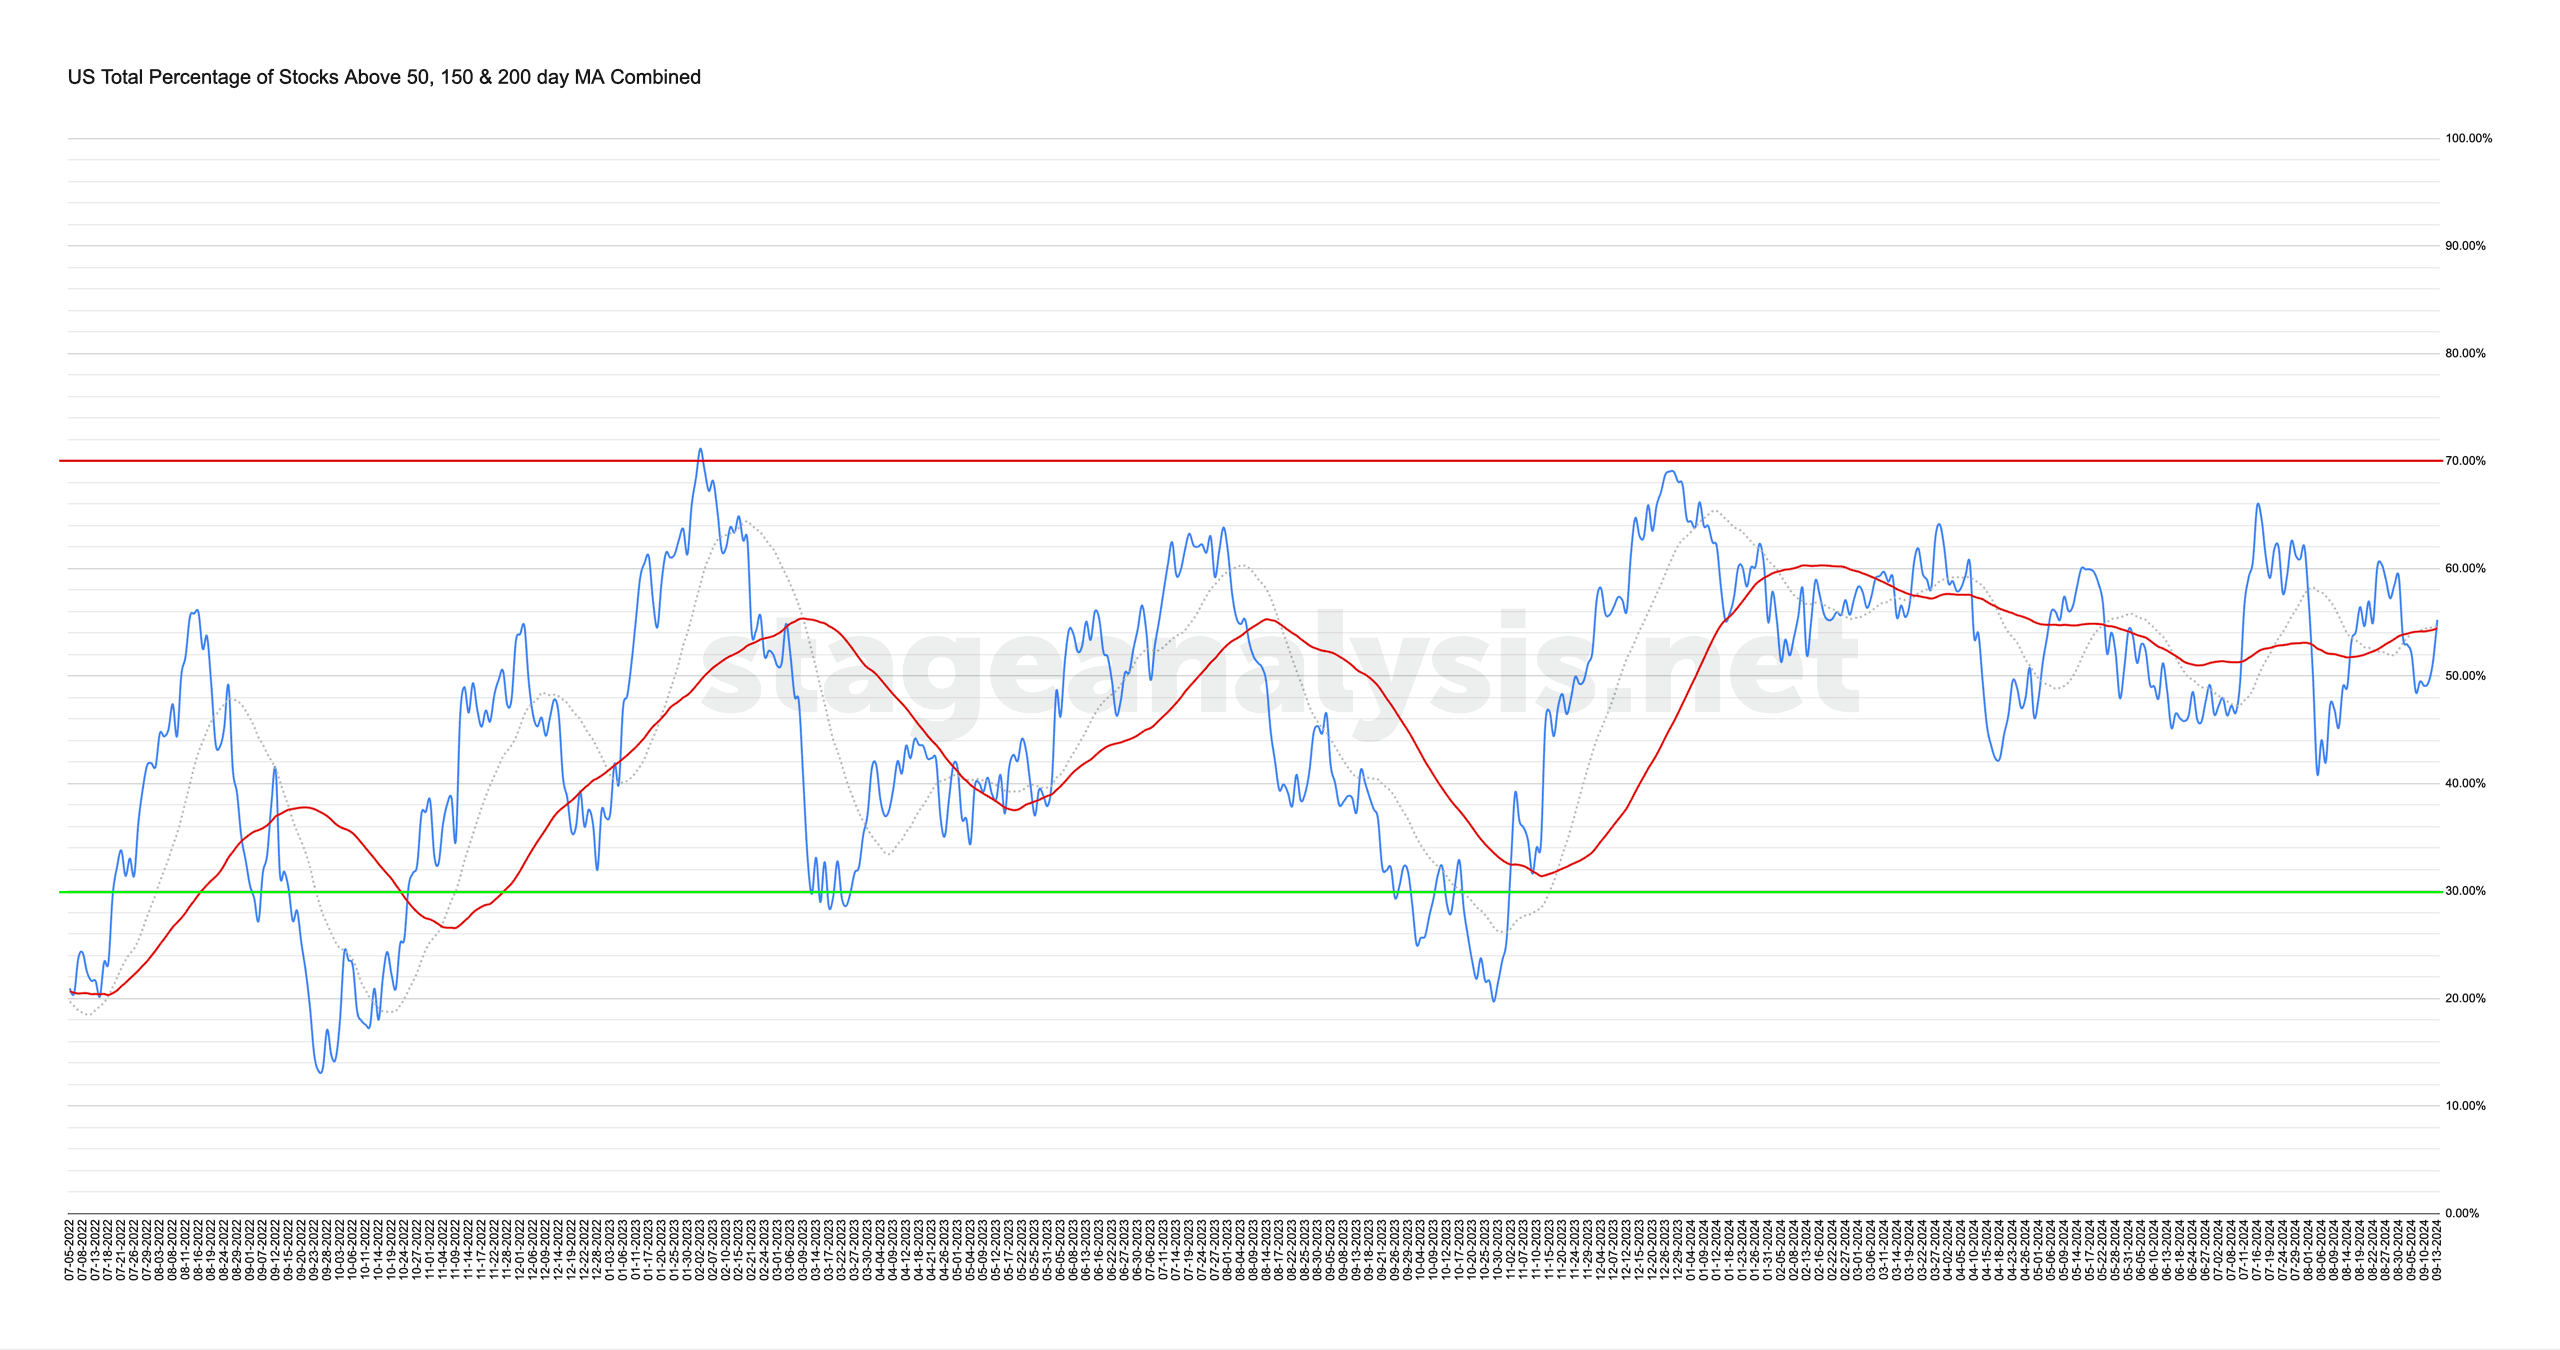
55.23% (+6.75% 1wk)
Status: Neutral Environment
The US Total Percentage of Stocks above their 50 Day, 150 Day & 200 Day Moving Averages (shown above) increased by +6.75% this week.
Therefore, the overall combined average is at 55.23% in the US market (NYSE and Nasdaq markets combined) above their short, medium and long term moving averages.
The market continued to whipsaw, with yet another reversal in the mid-range (five reversals since July) – mostly in the 40% to 60% neutral range. So the status has moved back to a Neutral Environment, with some strong rebound attempts in weaker areas such as Technology, But the defensive groups of Utilities and Real Estate continue to lead overall, with Energy being the major laggard.
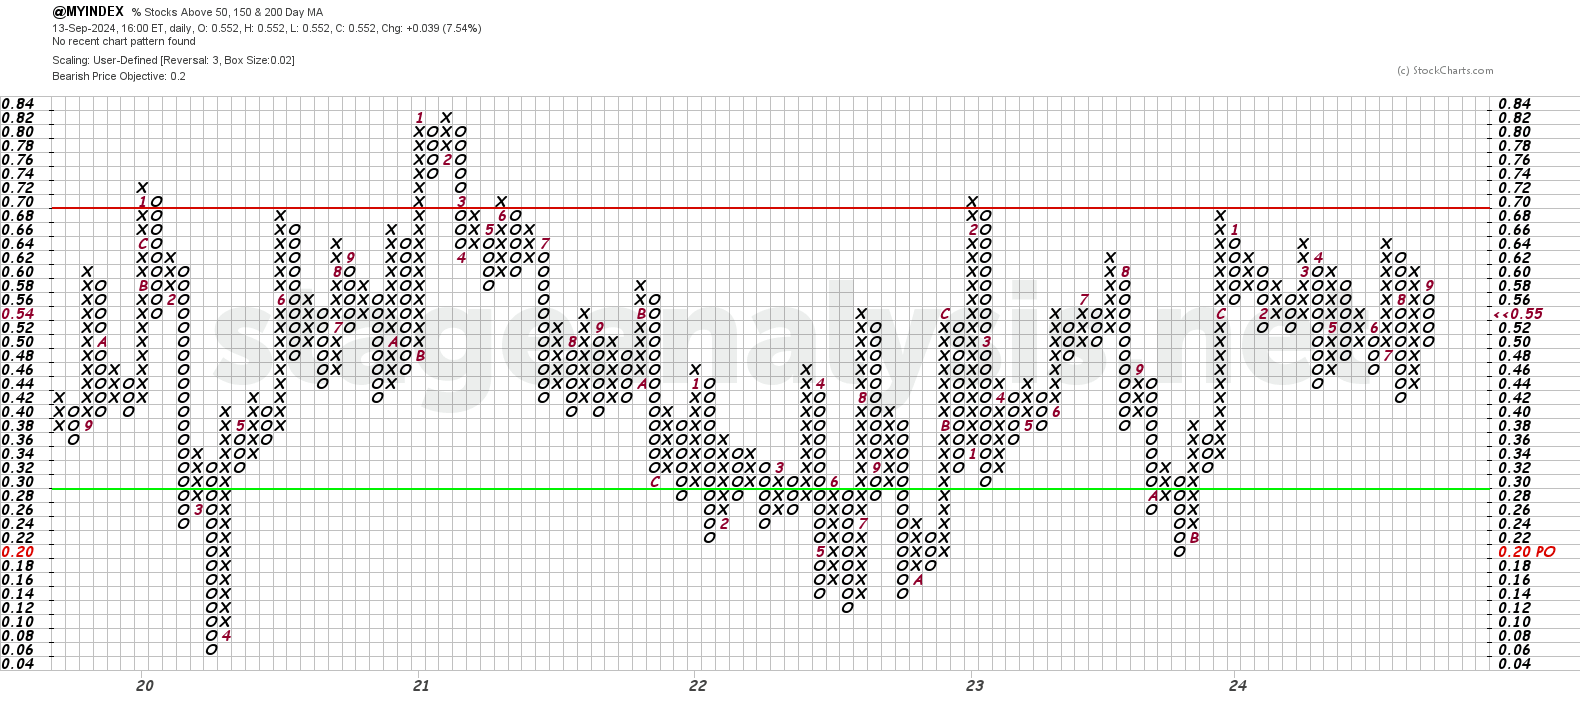
The Point and Figure (P&F) chart (shown above) column was unchanged this week, and so the P&F strategy remains on Defense (as it is in a column of Os), but close to a potential reversal point, which would require a close above 56%. Therefore the P&F status remains on Bear Confirmed status in the middle of the field.
See the Bullish Percent article for more information on the P&F statuses.
Become a Stage Analysis Member:
To see more like this – US Stocks watchlist posts, detailed videos each weekend, use our unique Stage Analysis tools, such as the US Stocks & ETFs Screener, Charts, Market Breadth, Group Relative Strength and more...
Join Today
Disclaimer: For educational purpose only. Not investment advice. Seek professional advice from a financial advisor before making any investing decisions.