
Market Breadth: Percentage of Stocks Above their 50 Day, 150 Day & 200 Day Moving Averages Combined
The full post is available to view by members only. For immediate access:
48.48% (-10.80% 1wk)
Status: Difficult Environment
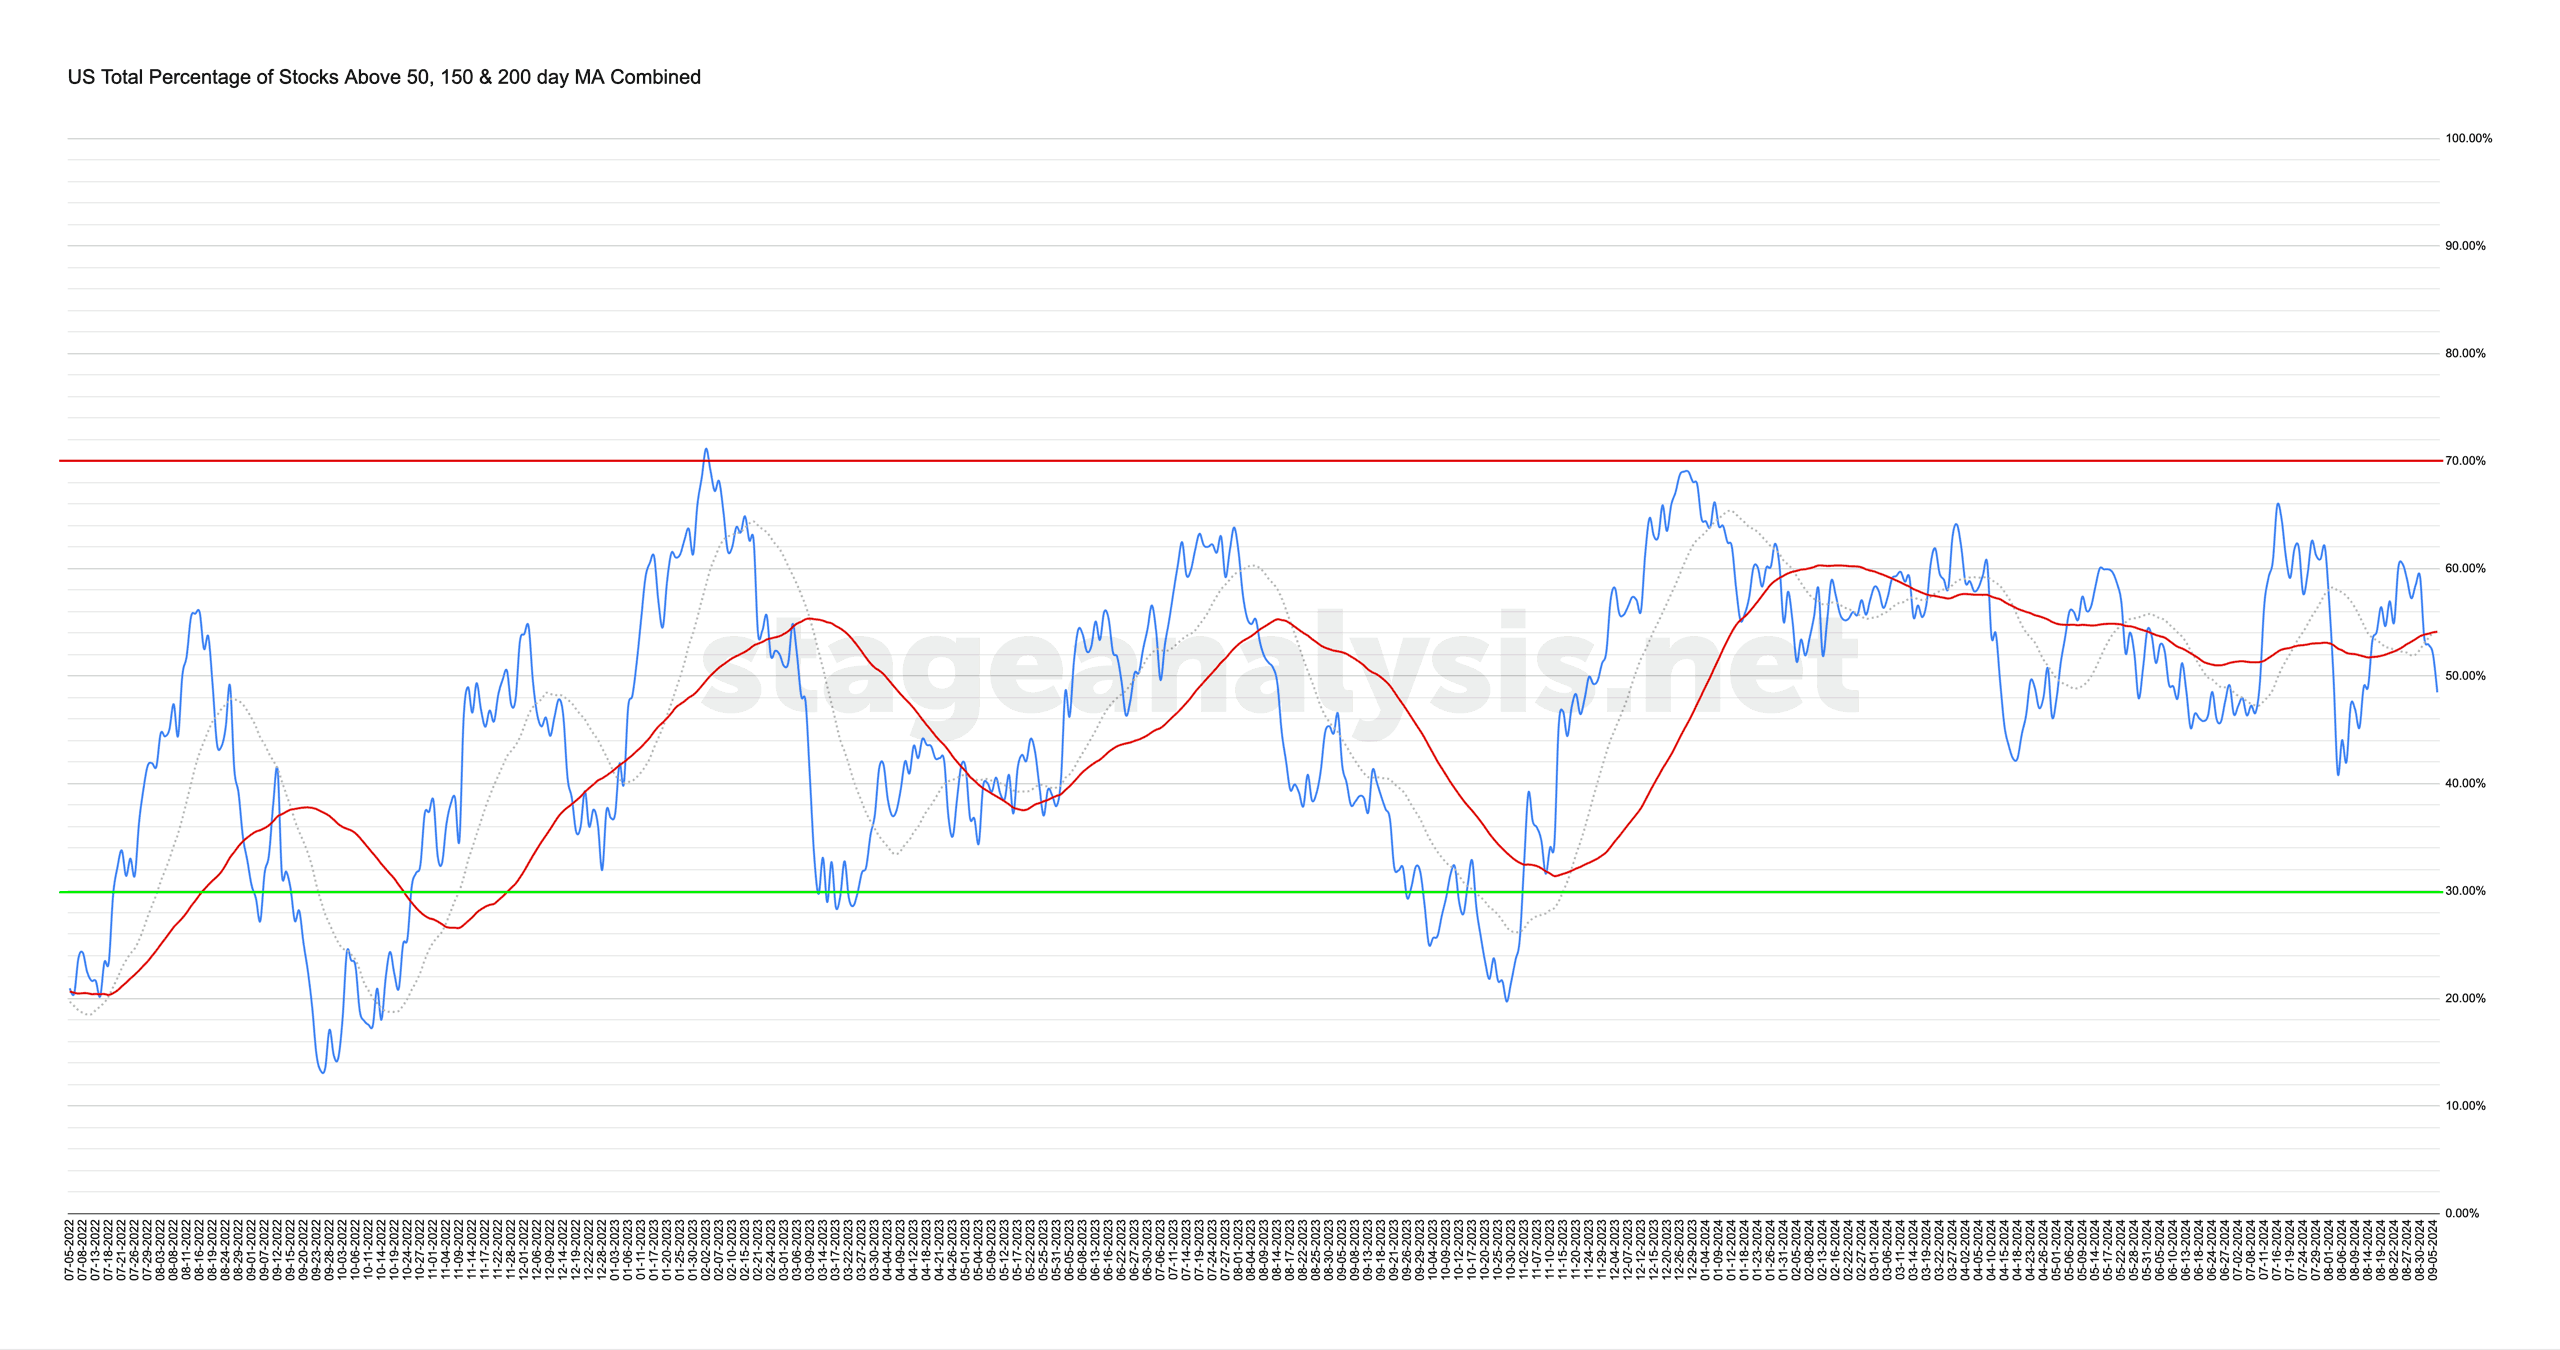
The US Total Percentage of Stocks above their 50 Day, 150 Day & 200 Day Moving Averages (shown above) decreased by -10.80% this week.
Therefore, the overall combined average is at 48.48% in the US market (NYSE and Nasdaq markets combined) above their short, medium and long term moving averages.
The combined moving average breadth collapsed at the start of the week, dropping below its 50 day MA (signal line) on Tuesday and then the 20 day MA on Wednesday and following through lower into the end of the week. So the status has shifted back to a Difficult Environment, with even many of the defensive groups that have been leading, also getting punished this week.
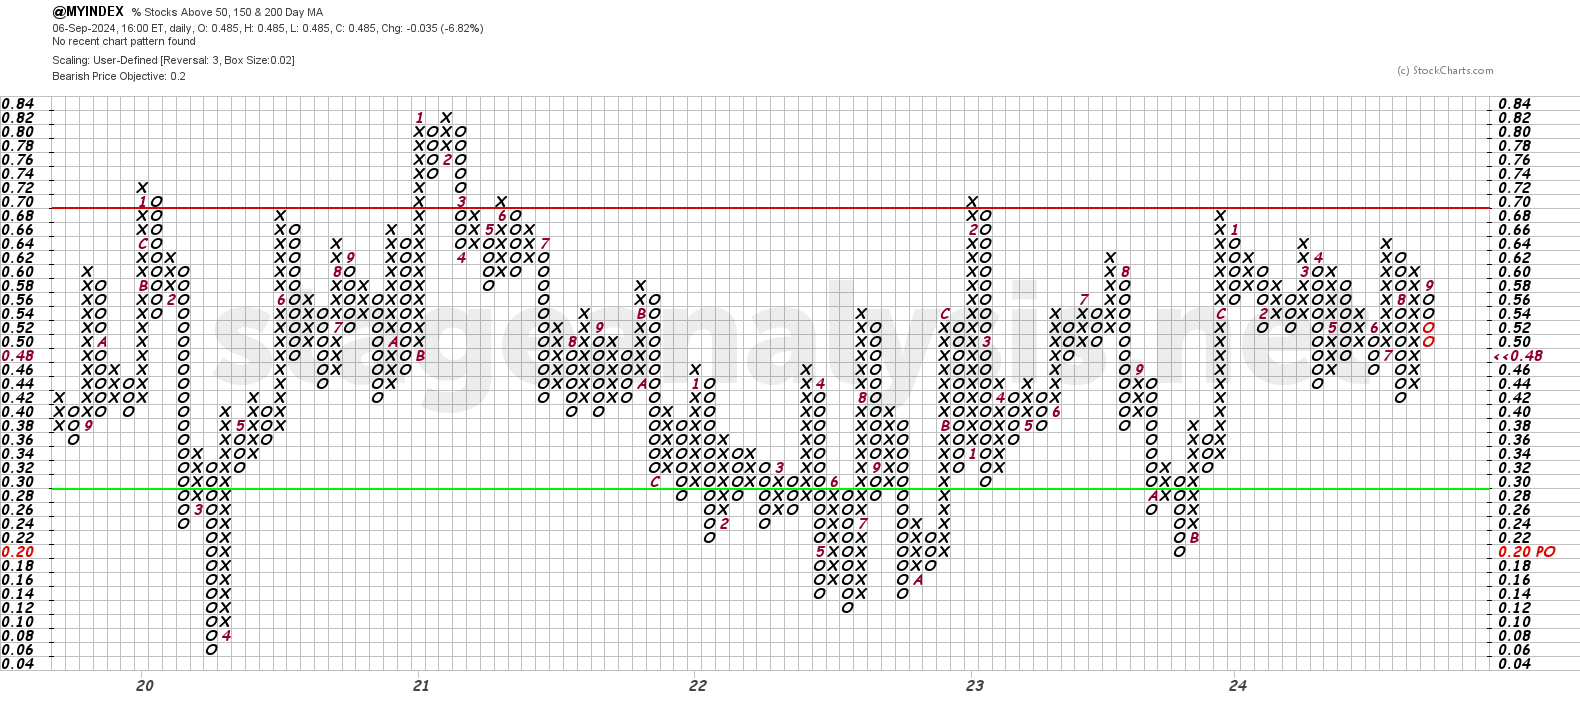
The Point and Figure (P&F) chart (shown above) changed column and dropped by 5 Os this week. Initially reversing to Os on Tuesday, and so the P&F strategy reverts to Defense (as it is in a column of Os), with the P&F status changed back to Bear Confirmed in the middle of the field.
See the Bullish Percent article for more information on the P&F statuses.
Become a Stage Analysis Member:
To see more like this – US Stocks watchlist posts, detailed videos each weekend, use our unique Stage Analysis tools, such as the US Stocks & ETFs Screener, Charts, Market Breadth, Group Relative Strength and more...
Join Today
Disclaimer: For educational purpose only. Not investment advice. Seek professional advice from a financial advisor before making any investing decisions.