
Market Breadth: Percentage of Stocks Above their 50 Day, 150 Day & 200 Day Moving Averages Combined
The full post is available to view by members only. For immediate access:
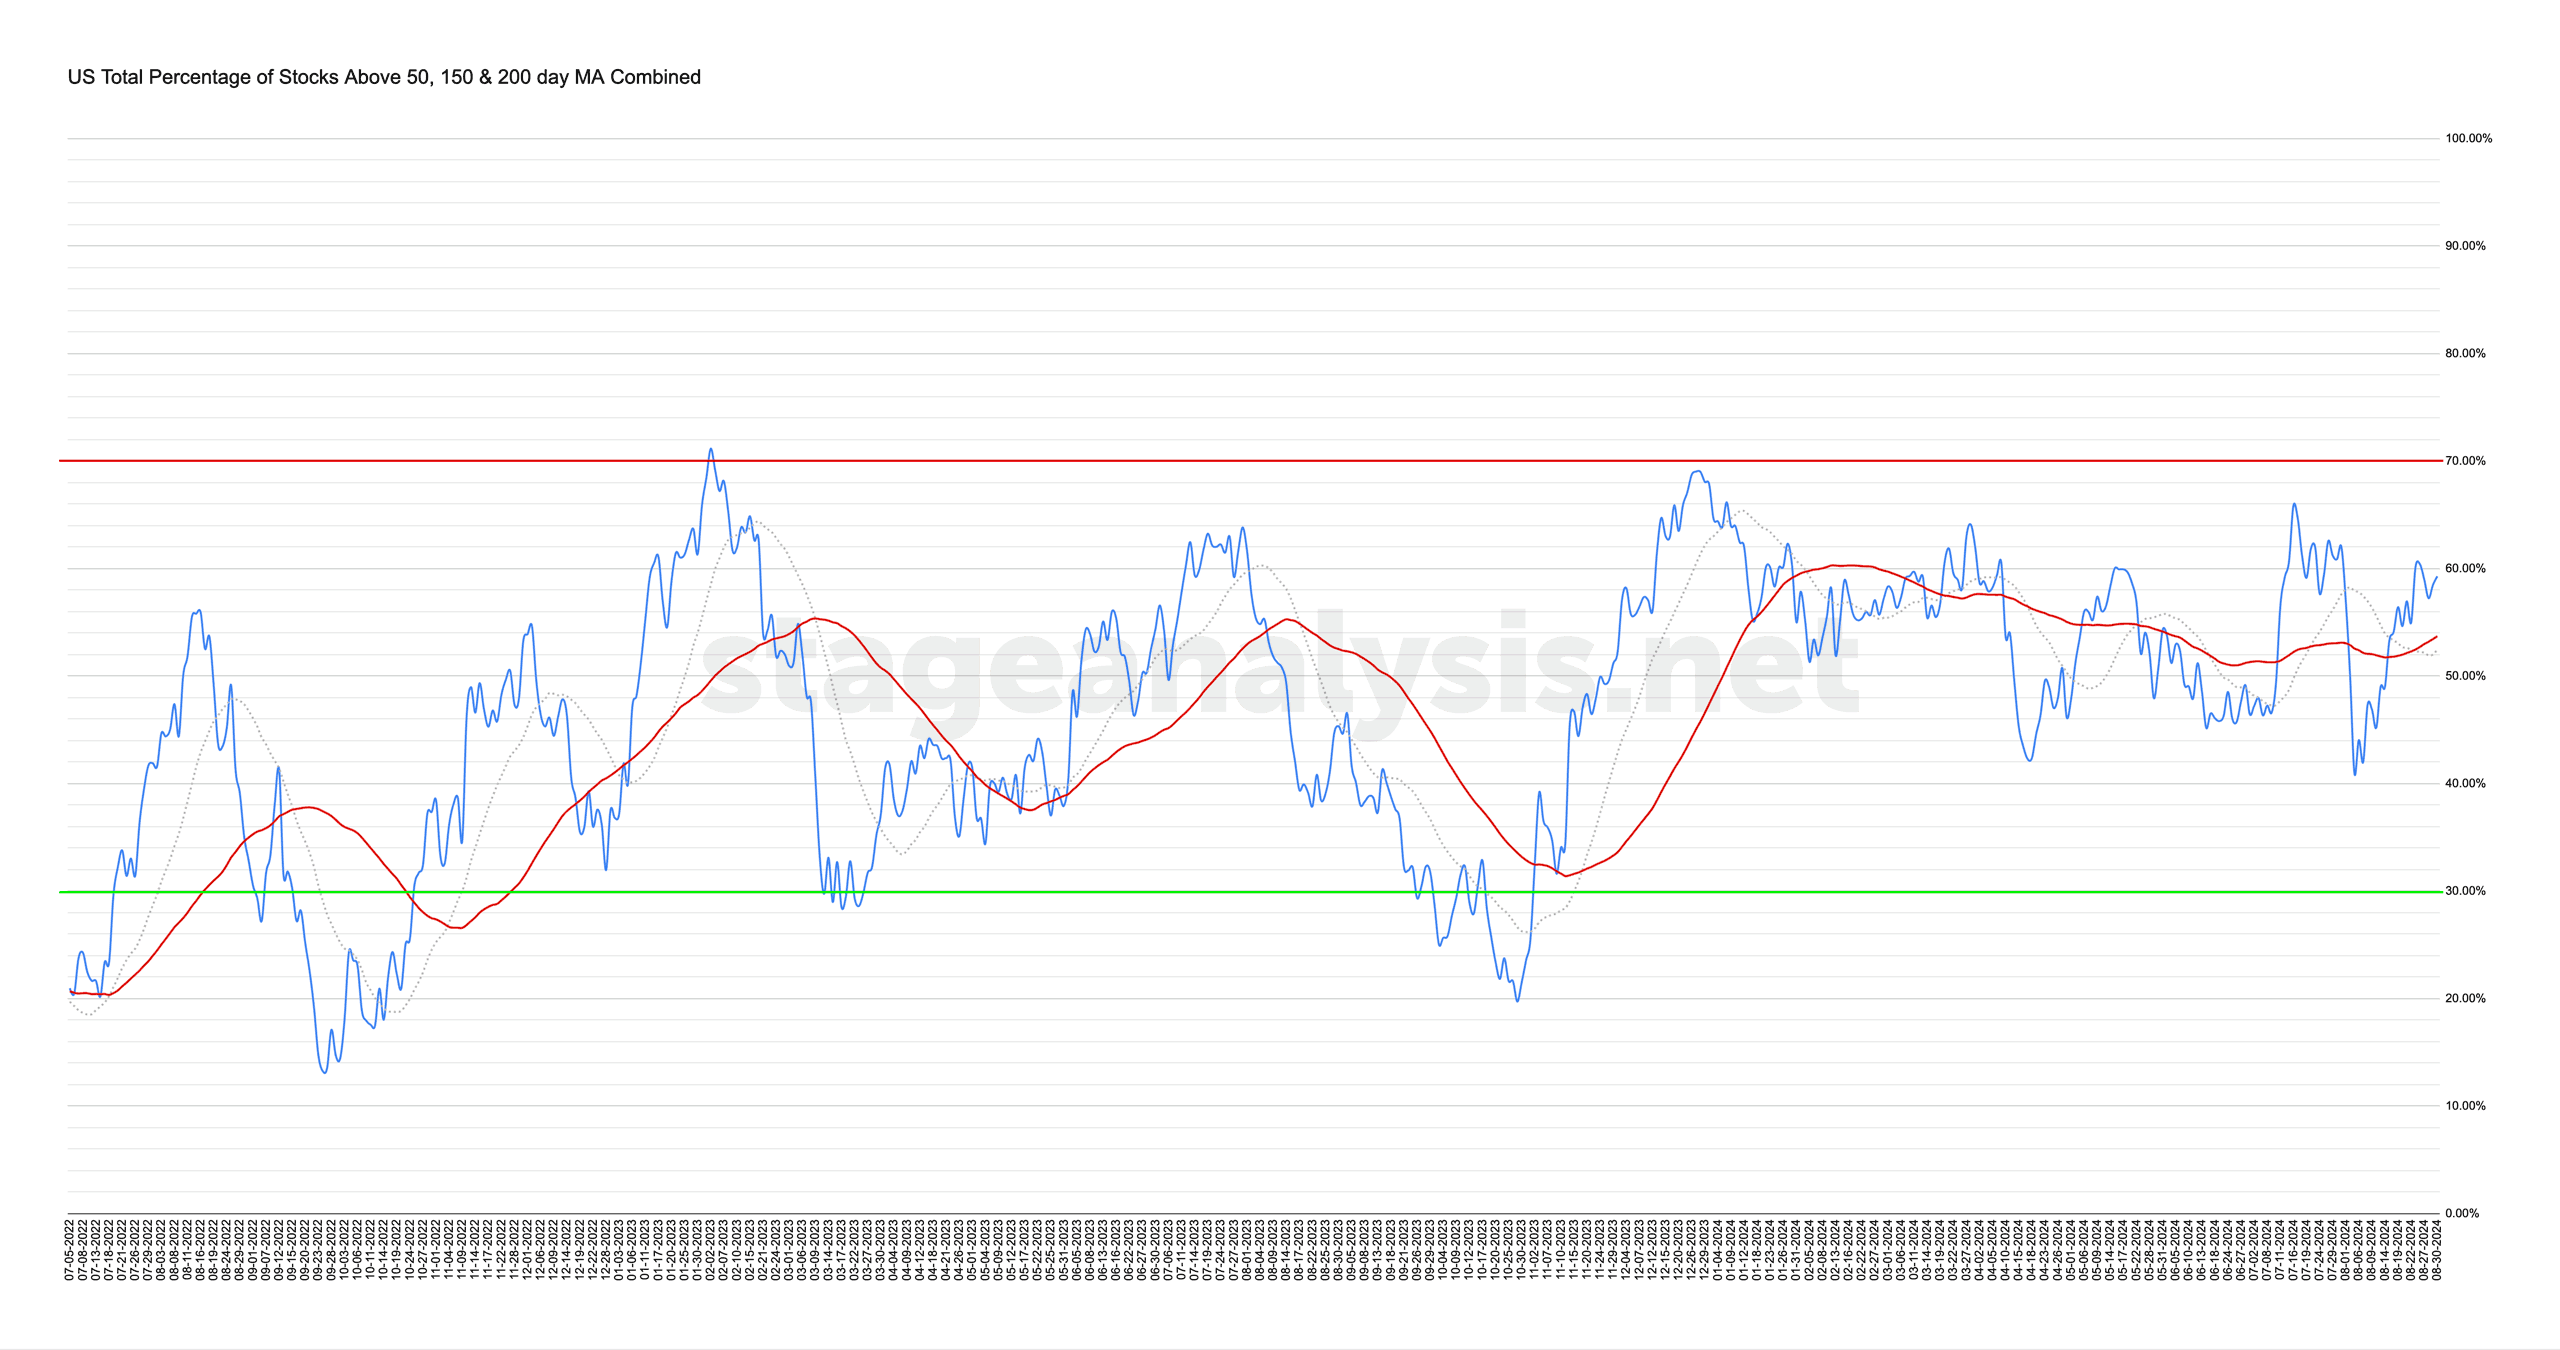
59.28% (-0.84% 1wk)
Status: Tentative Positive Environment
The US Total Percentage of Stocks above their 50 Day, 150 Day & 200 Day Moving Averages (shown above) decreased by -0.84% this week.
Therefore, the overall combined average is at 59.28% in the US market (NYSE and Nasdaq markets combined) above their short, medium and long term moving averages.
The combined moving average breadth pulled back during the week, but managed to recover the majority of the decline to only close slightly lower on the week, and +6.82% above its 20 day MA and +5.57% above its 50 day MA (signal line). So still a relatively healthy position at just under 60% overall, but it is still the defensive areas of the market that are leading, such as Financials, Real Estate and Utilities. So its remains on a Tentative Positive Environment status currently.
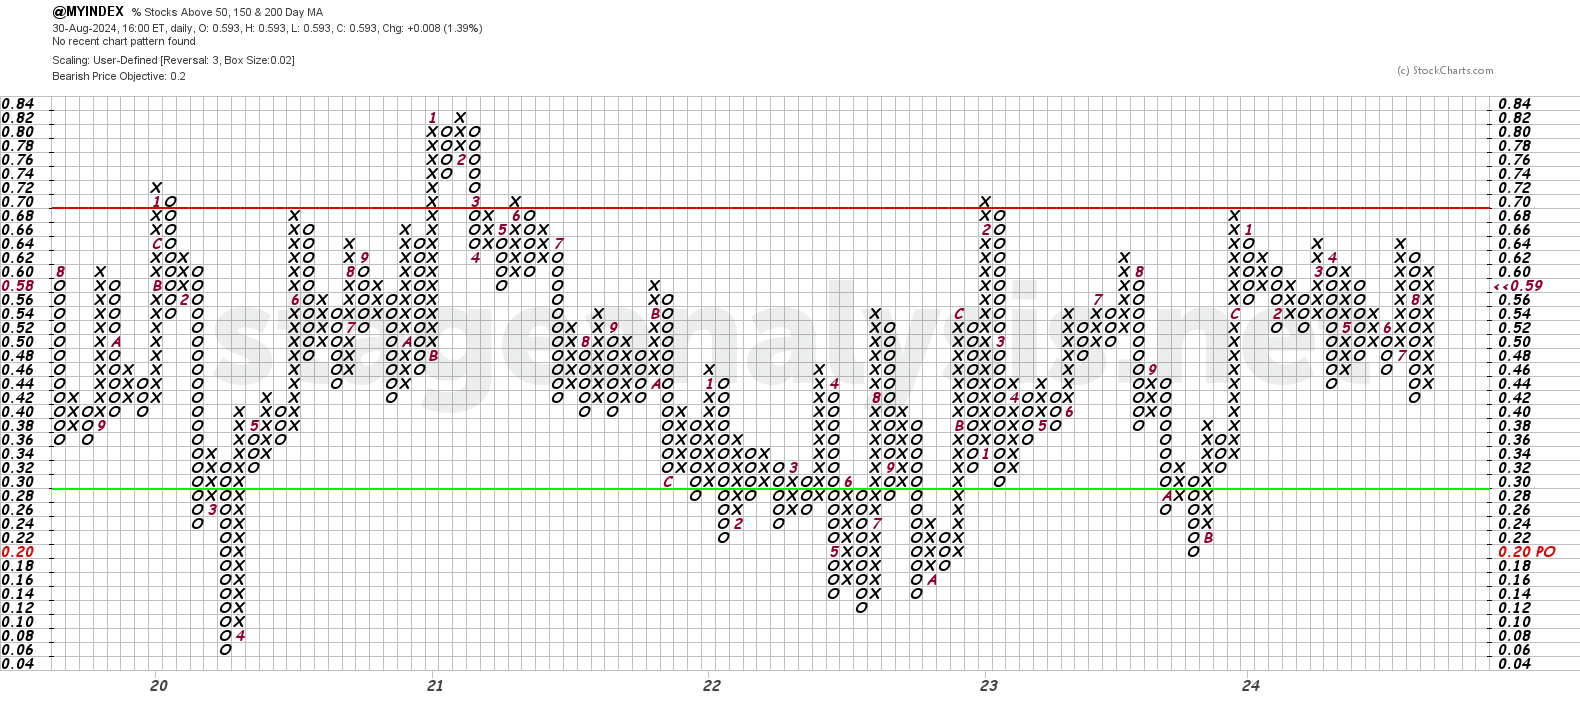
The Point and Figure (P&F) chart (shown above) was unchanged this week. So the P&F strategy remains on Offense (as it is in a column of Xs), with the P&F status remains on Bear Correction in the middle of the field.
See the Bullish Percent article for more information on the P&F statuses.
Become a Stage Analysis Member:
To see more like this and other premium content, such as the regular US Stocks watchlist, detailed videos and intraday posts, become a Stage Analysis member.
Join Today
Disclaimer: For educational purpose only. Not investment advice. Seek professional advice from a financial advisor before making any investing decisions.