
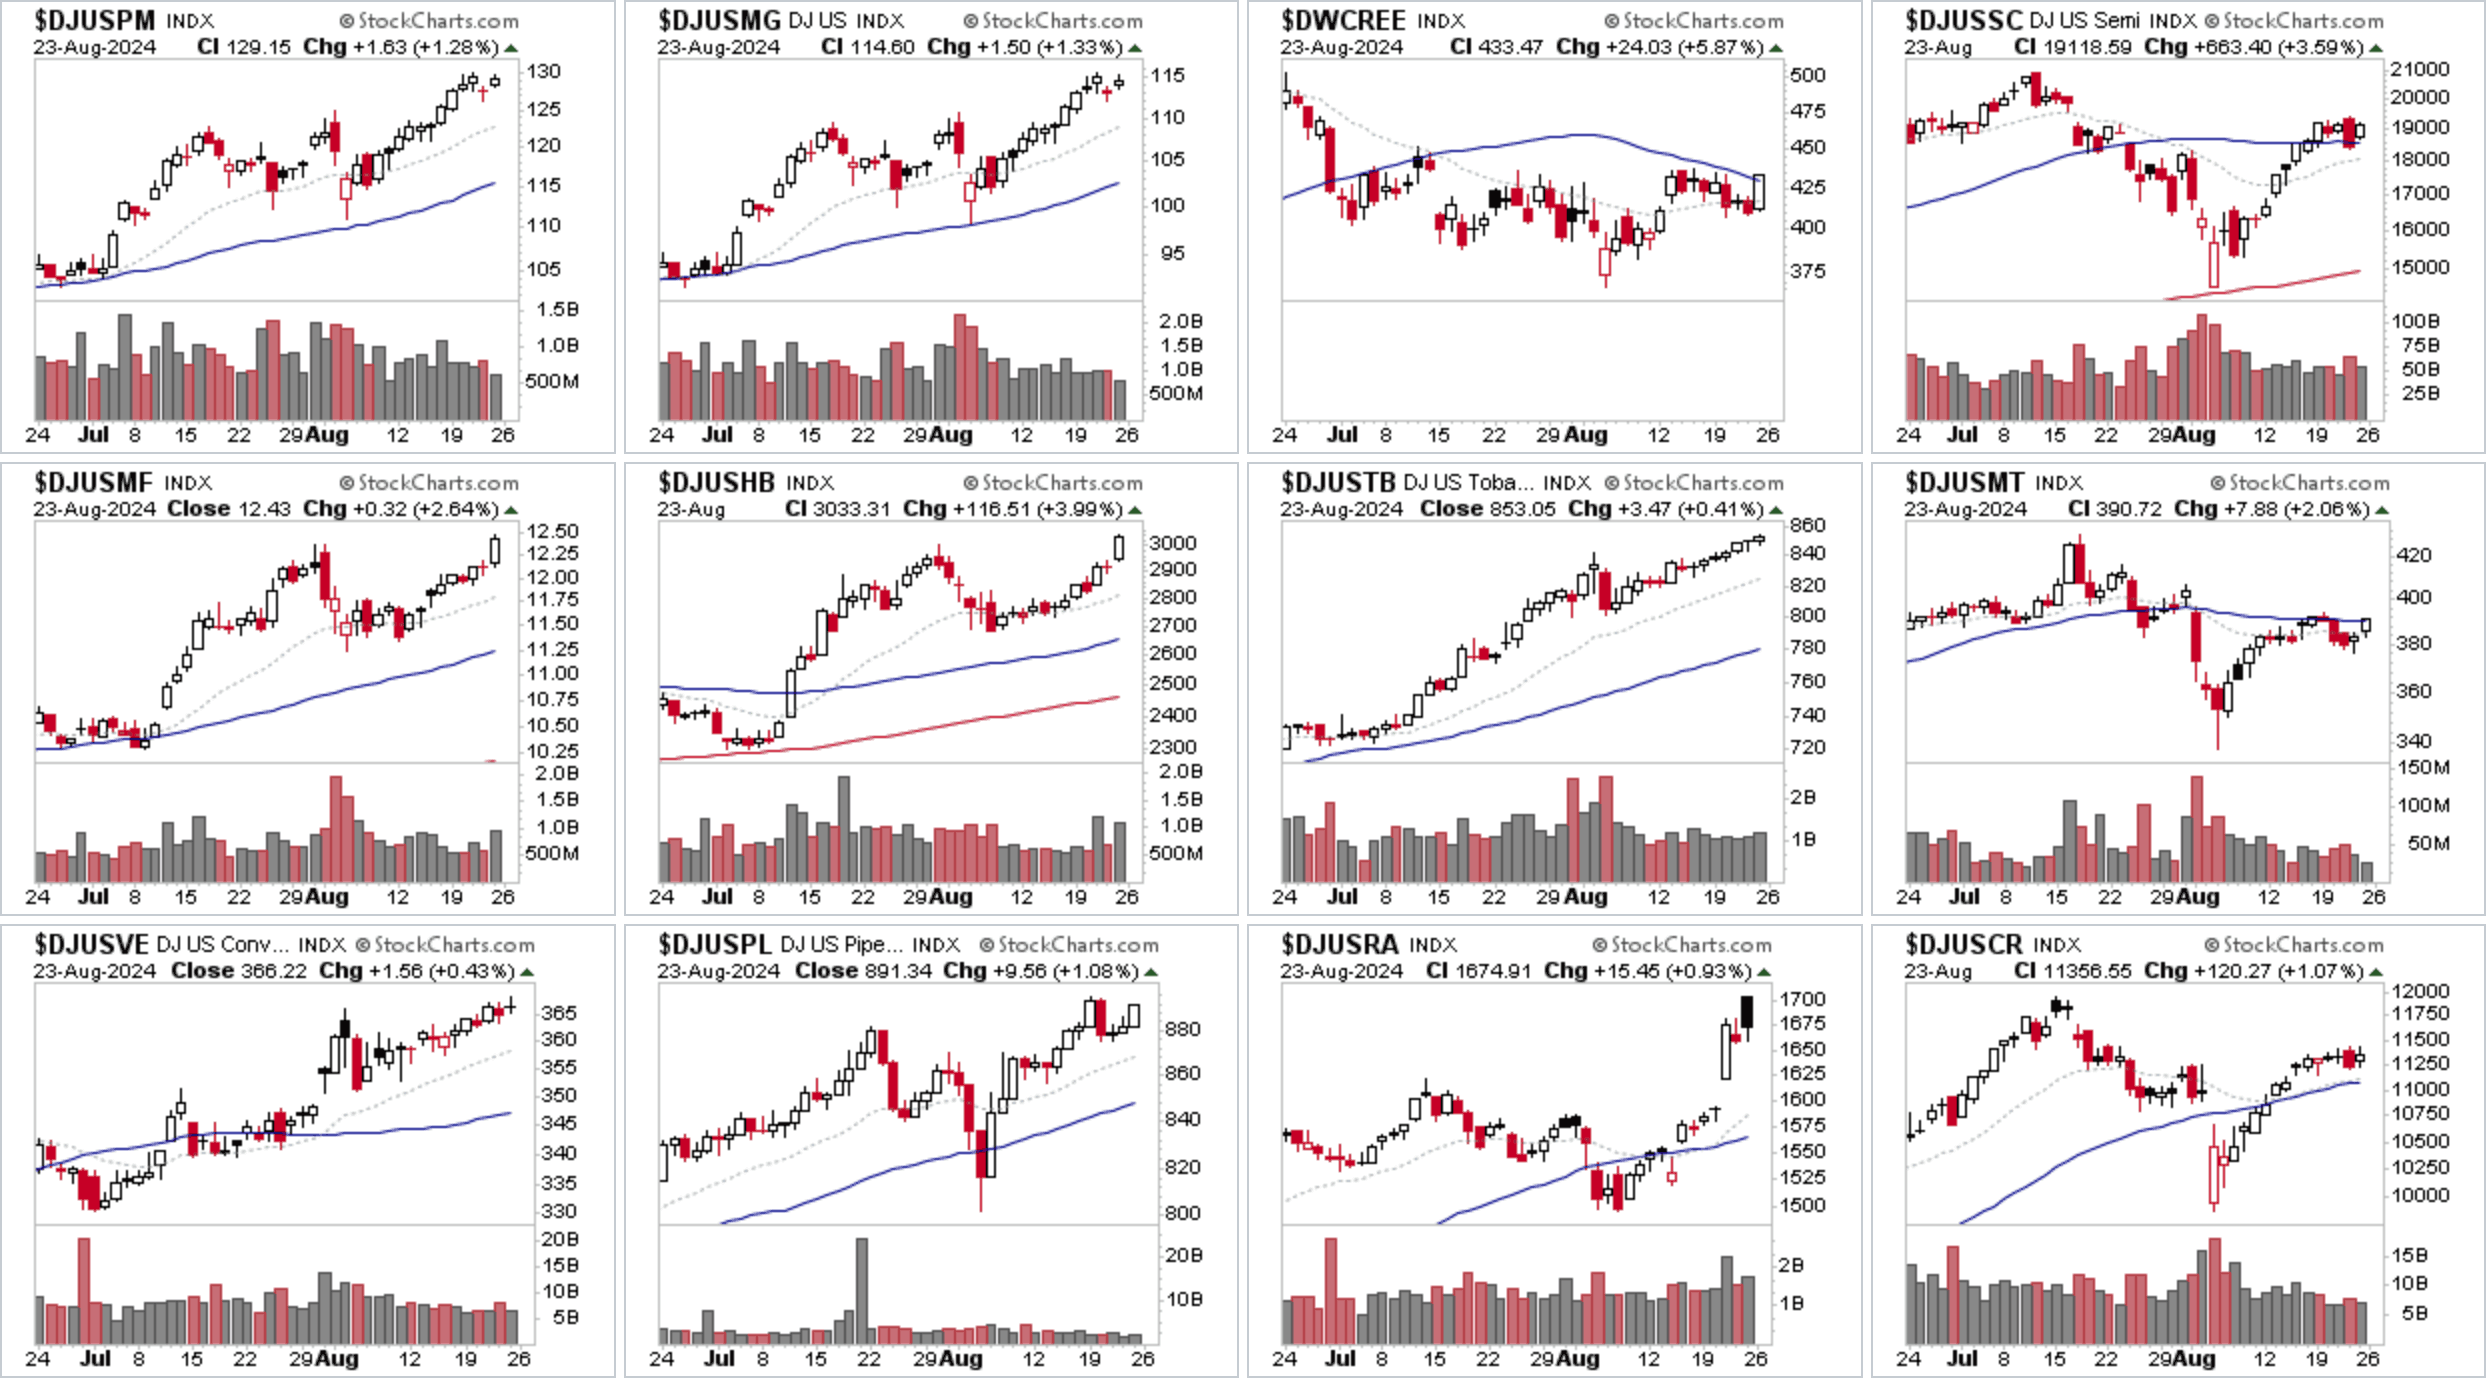
US Stocks Industry Groups Relative Strength Rankings
The full post is available to view by members only. For immediate access:
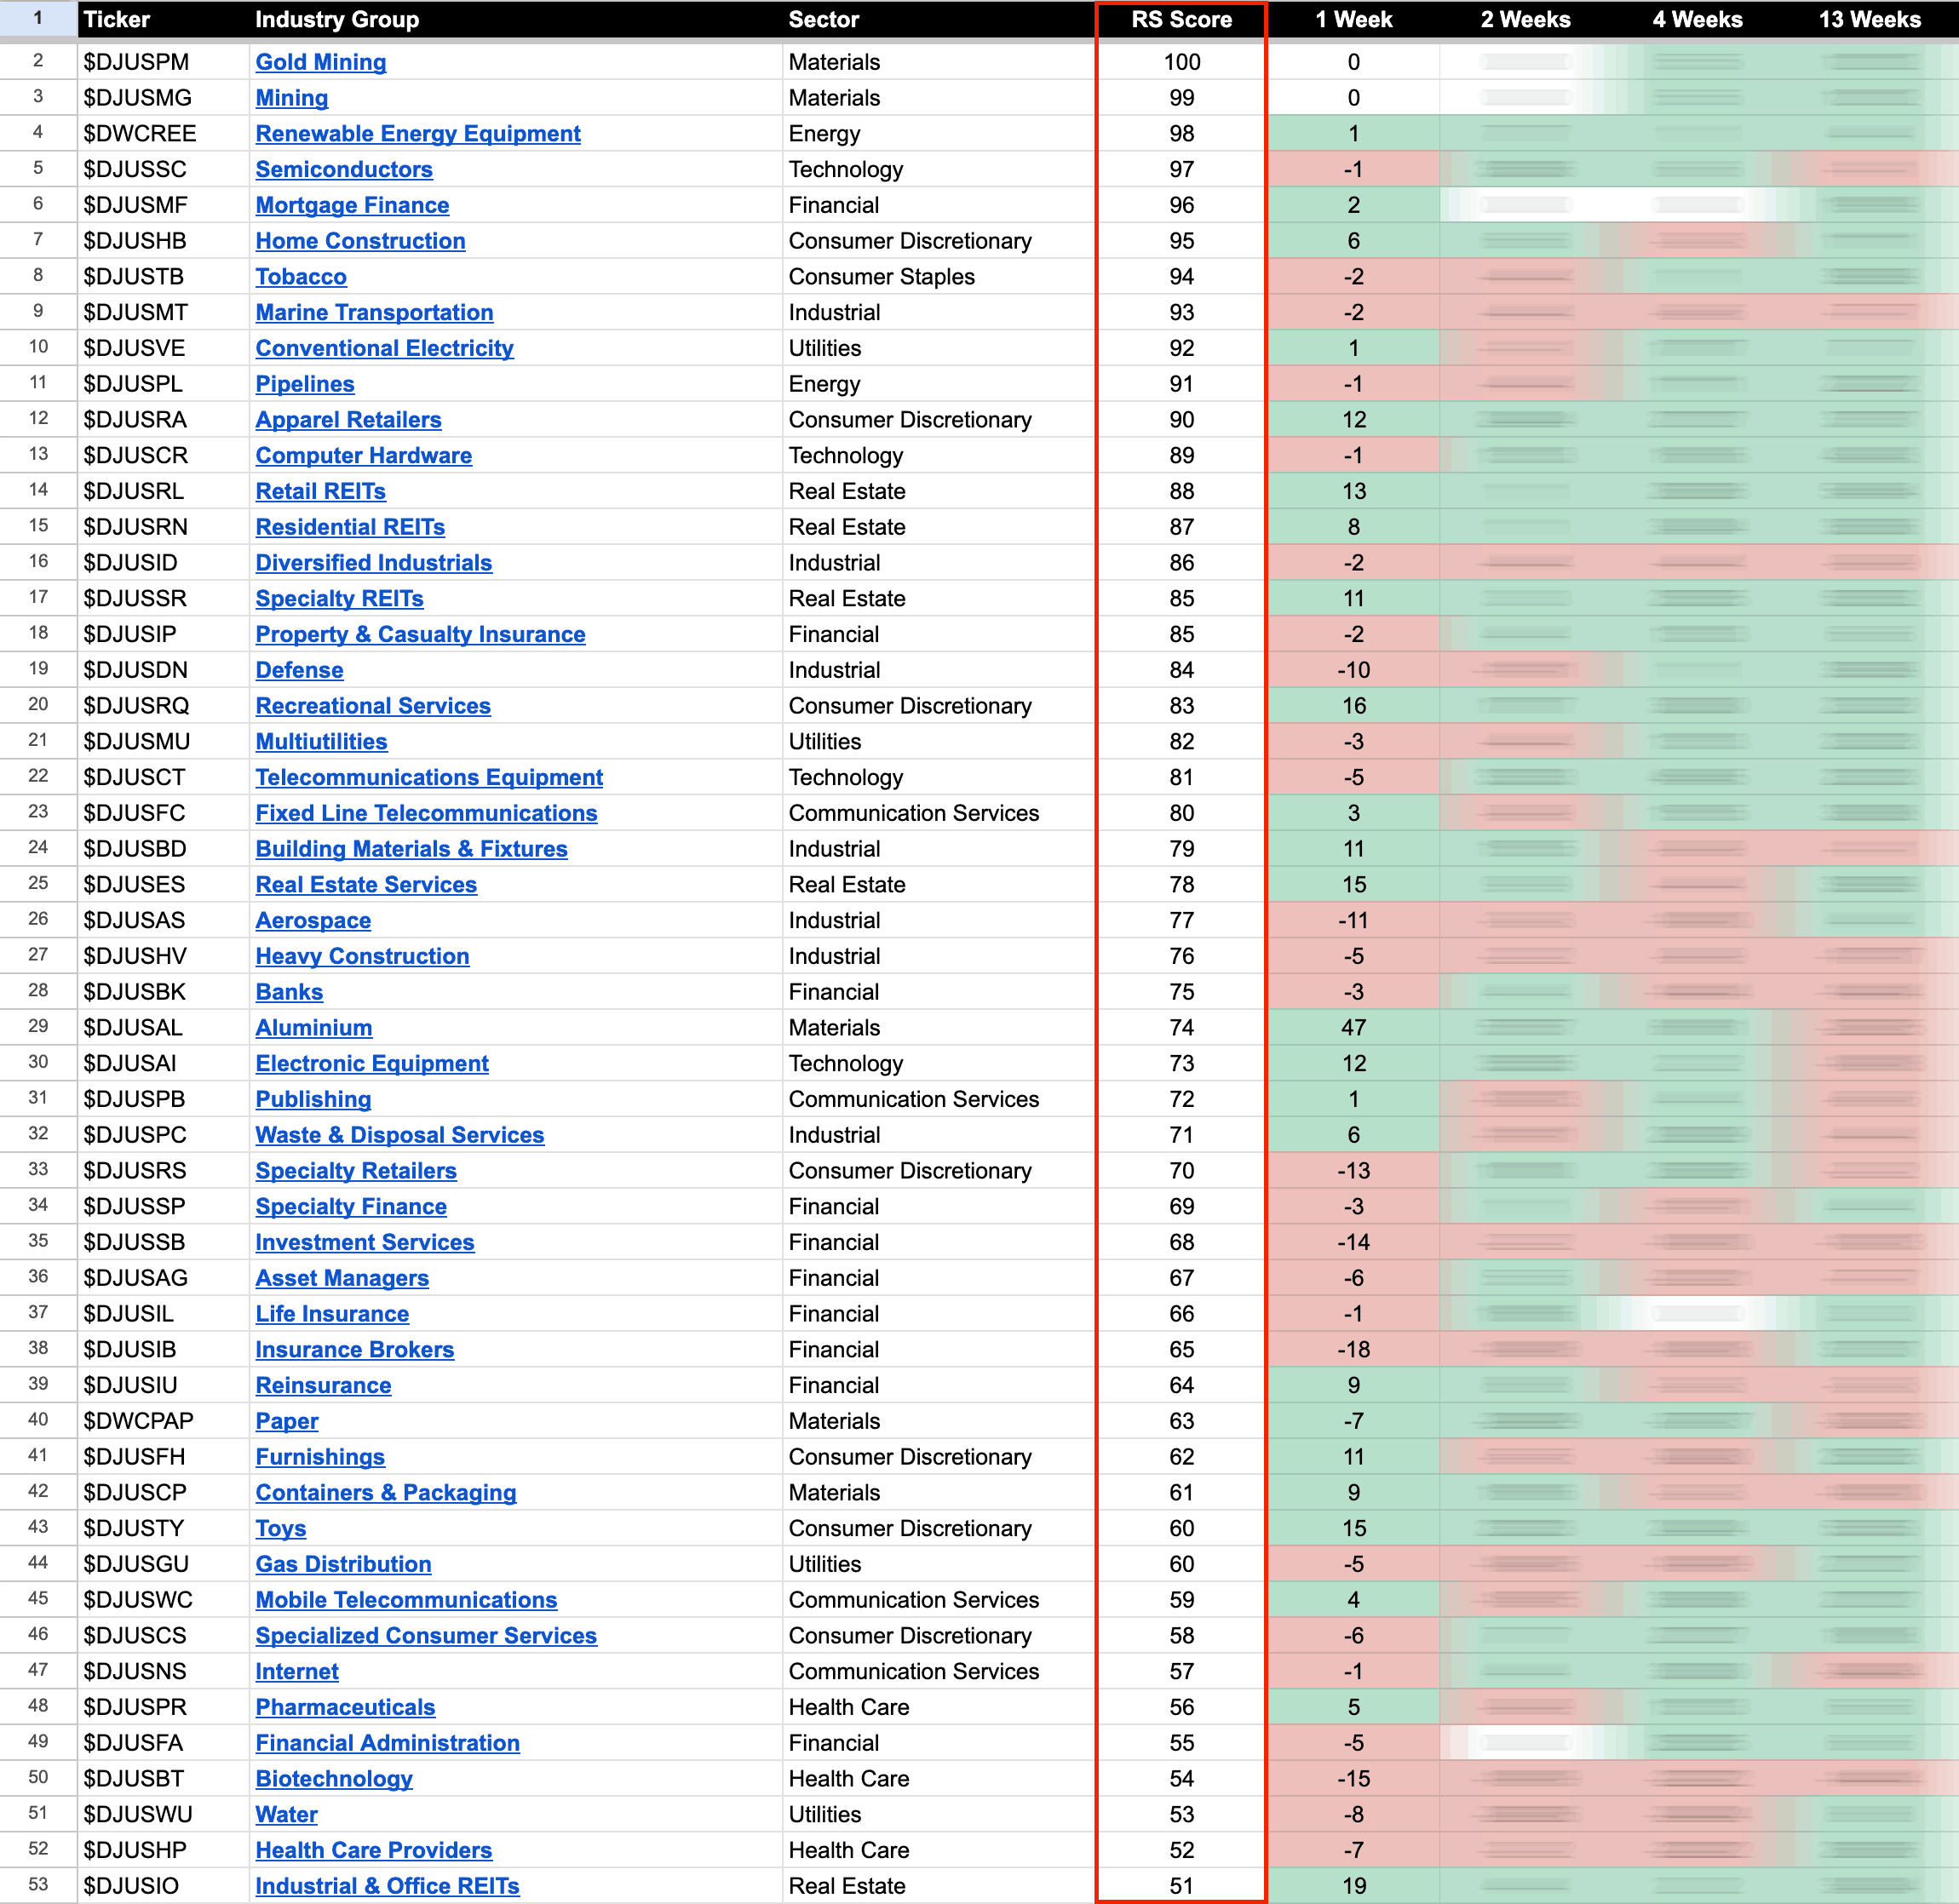
US Industry Groups by Highest RS Score
Gold Mining held onto the top spot for a fourth week in the Industry Groups Relative Strength (RS) Rankings with 72% of the Gold Miners with technically healthy Stage Analysis Technical Attributes (SATA) scores of 6 or higher.
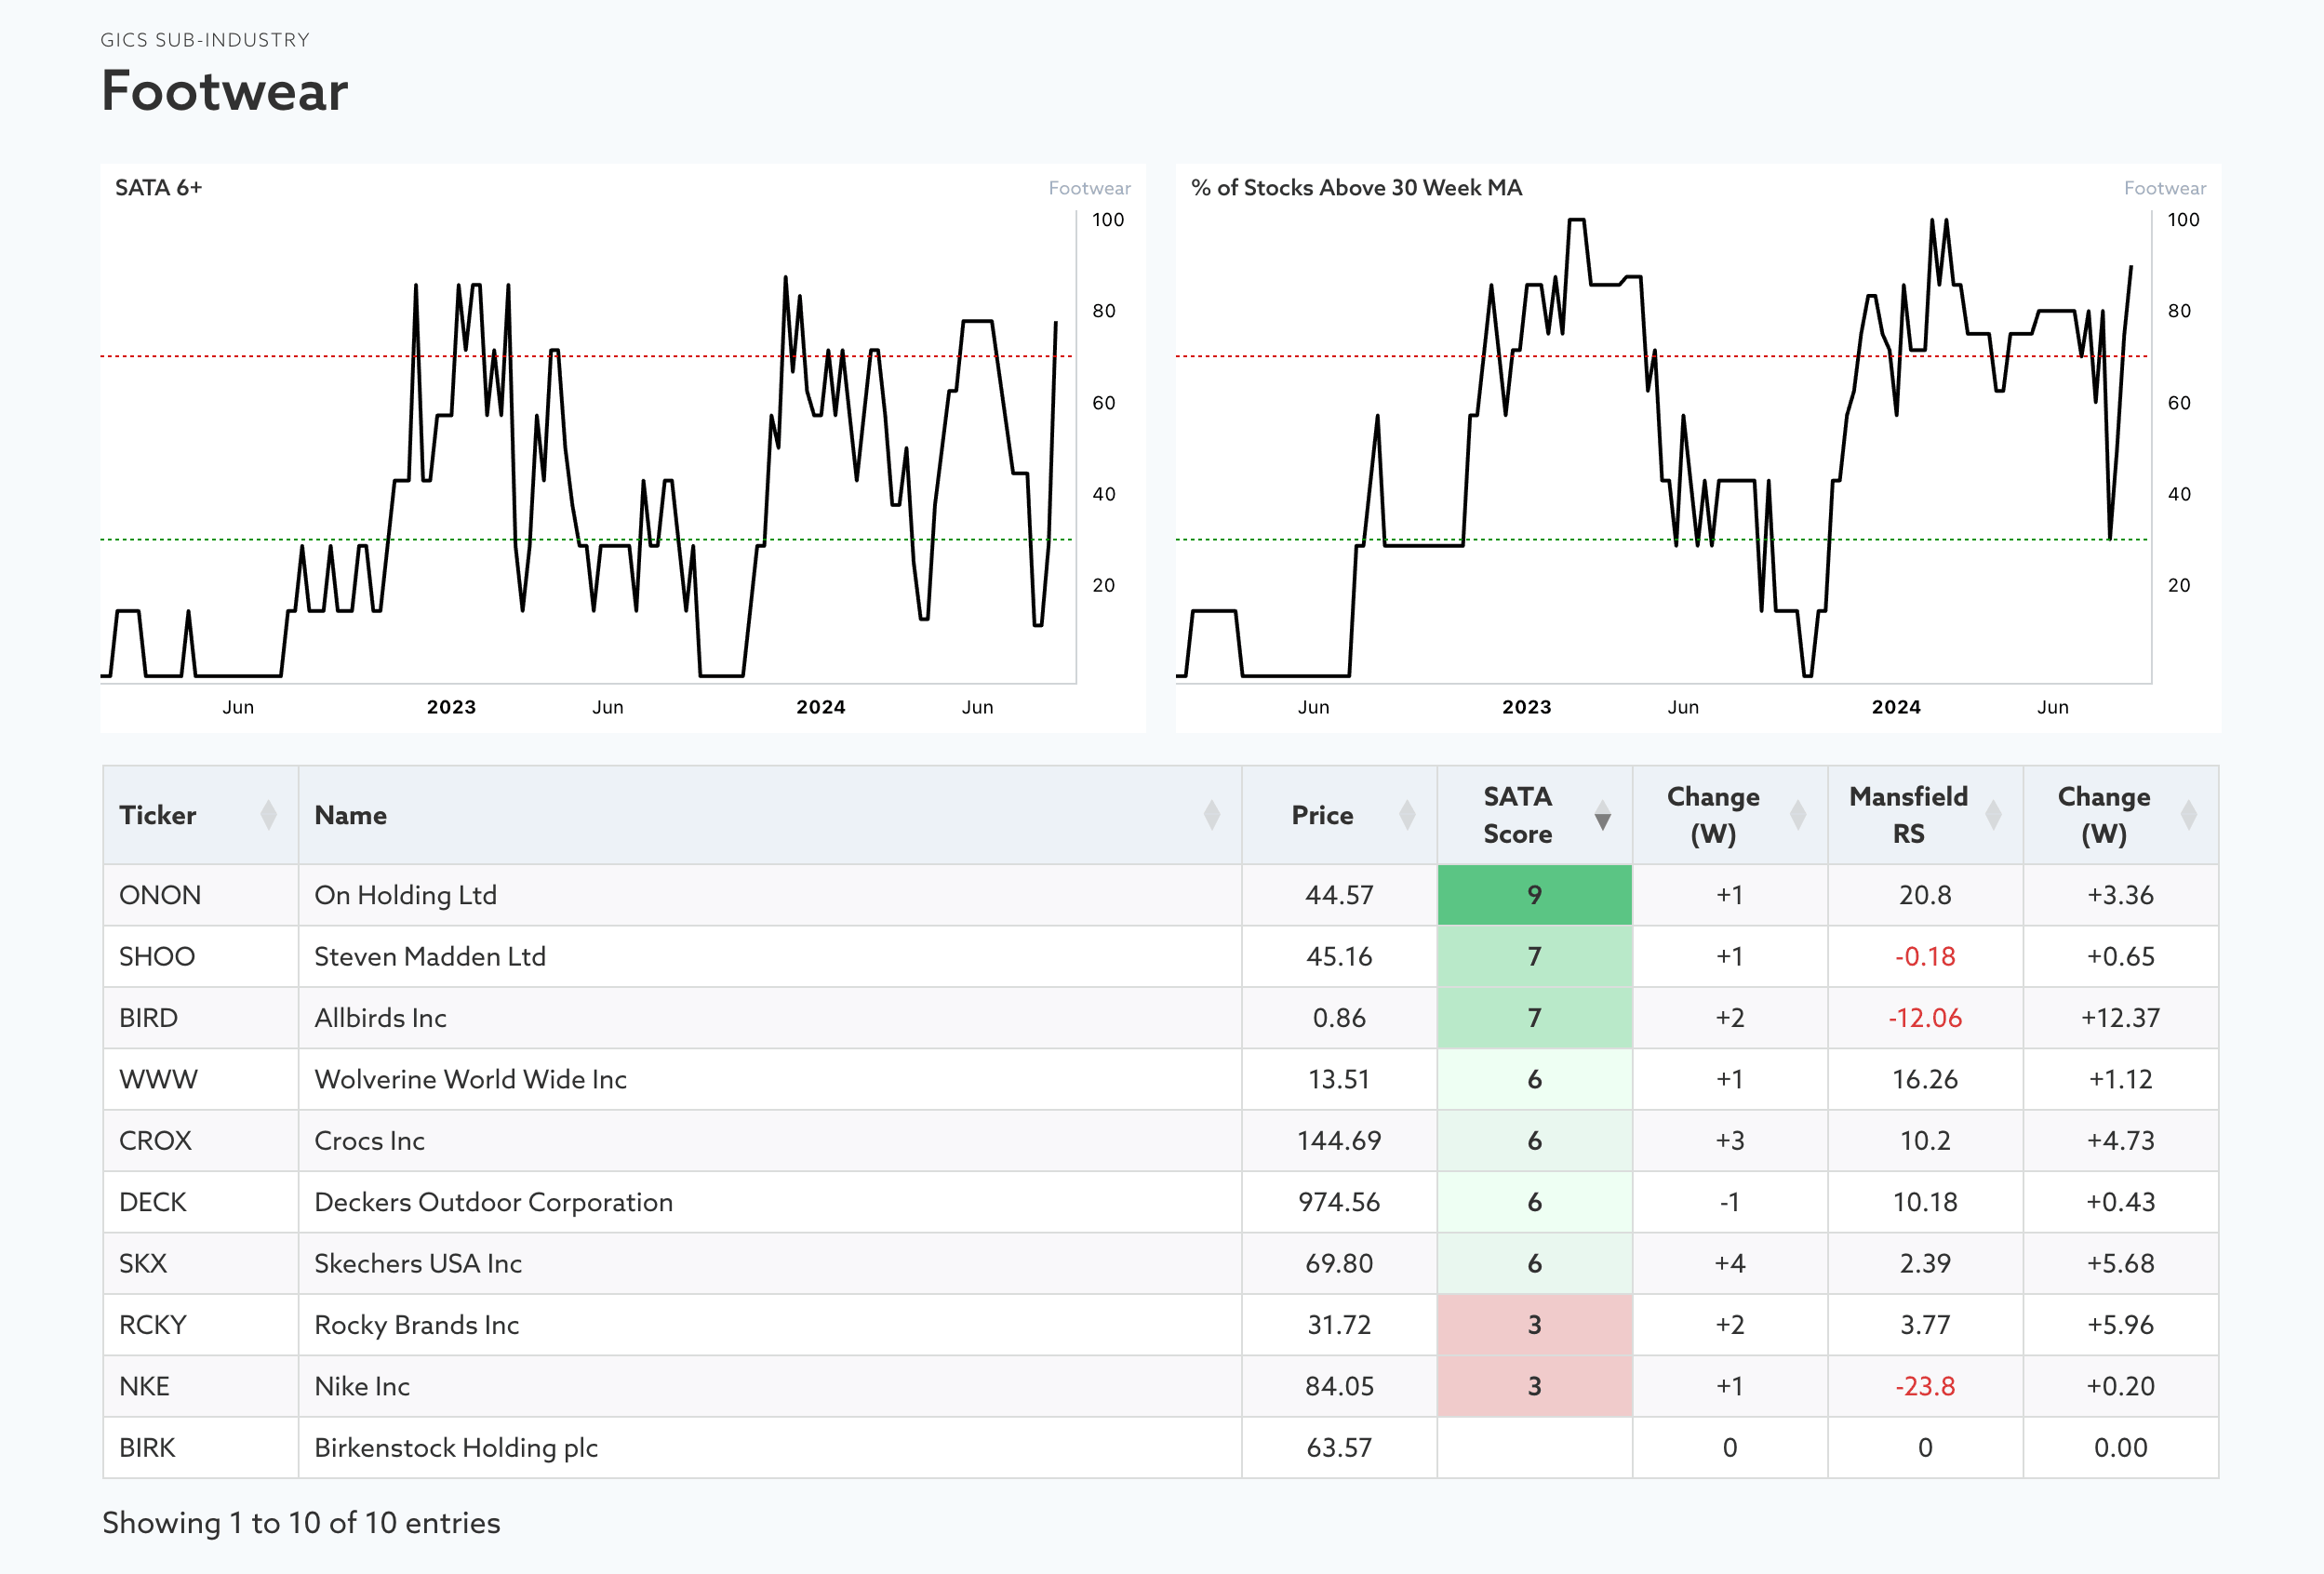
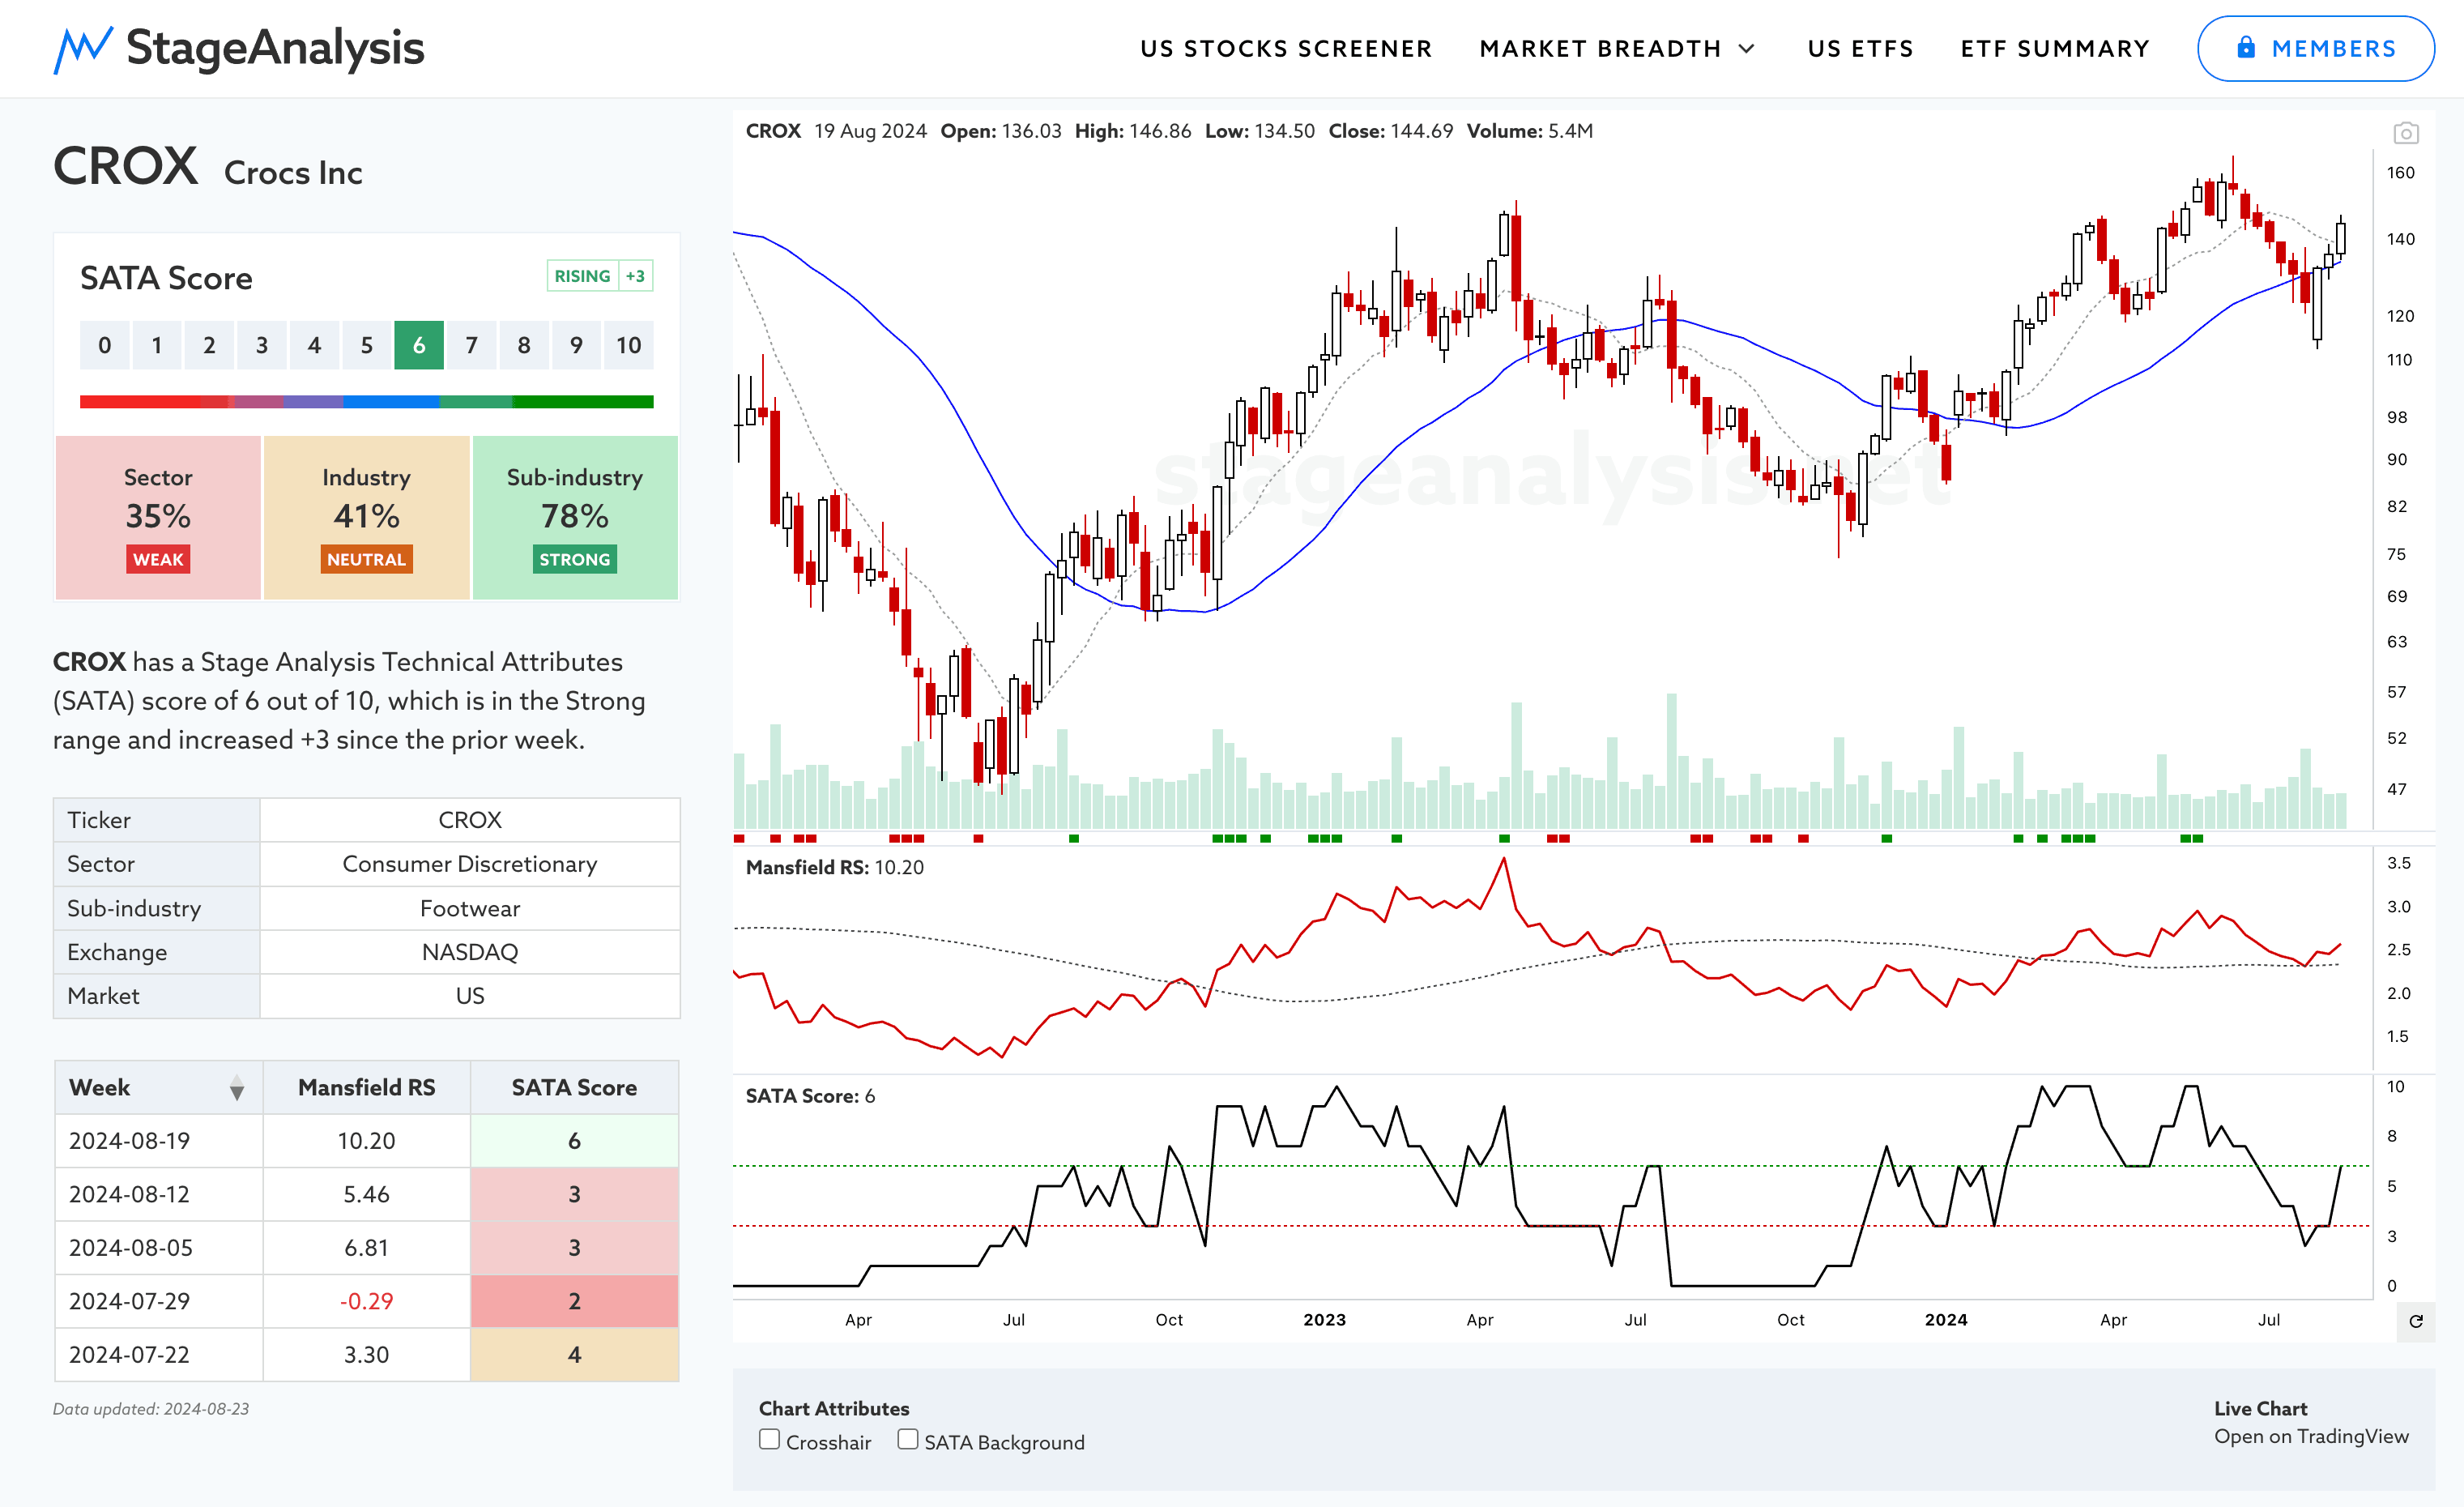
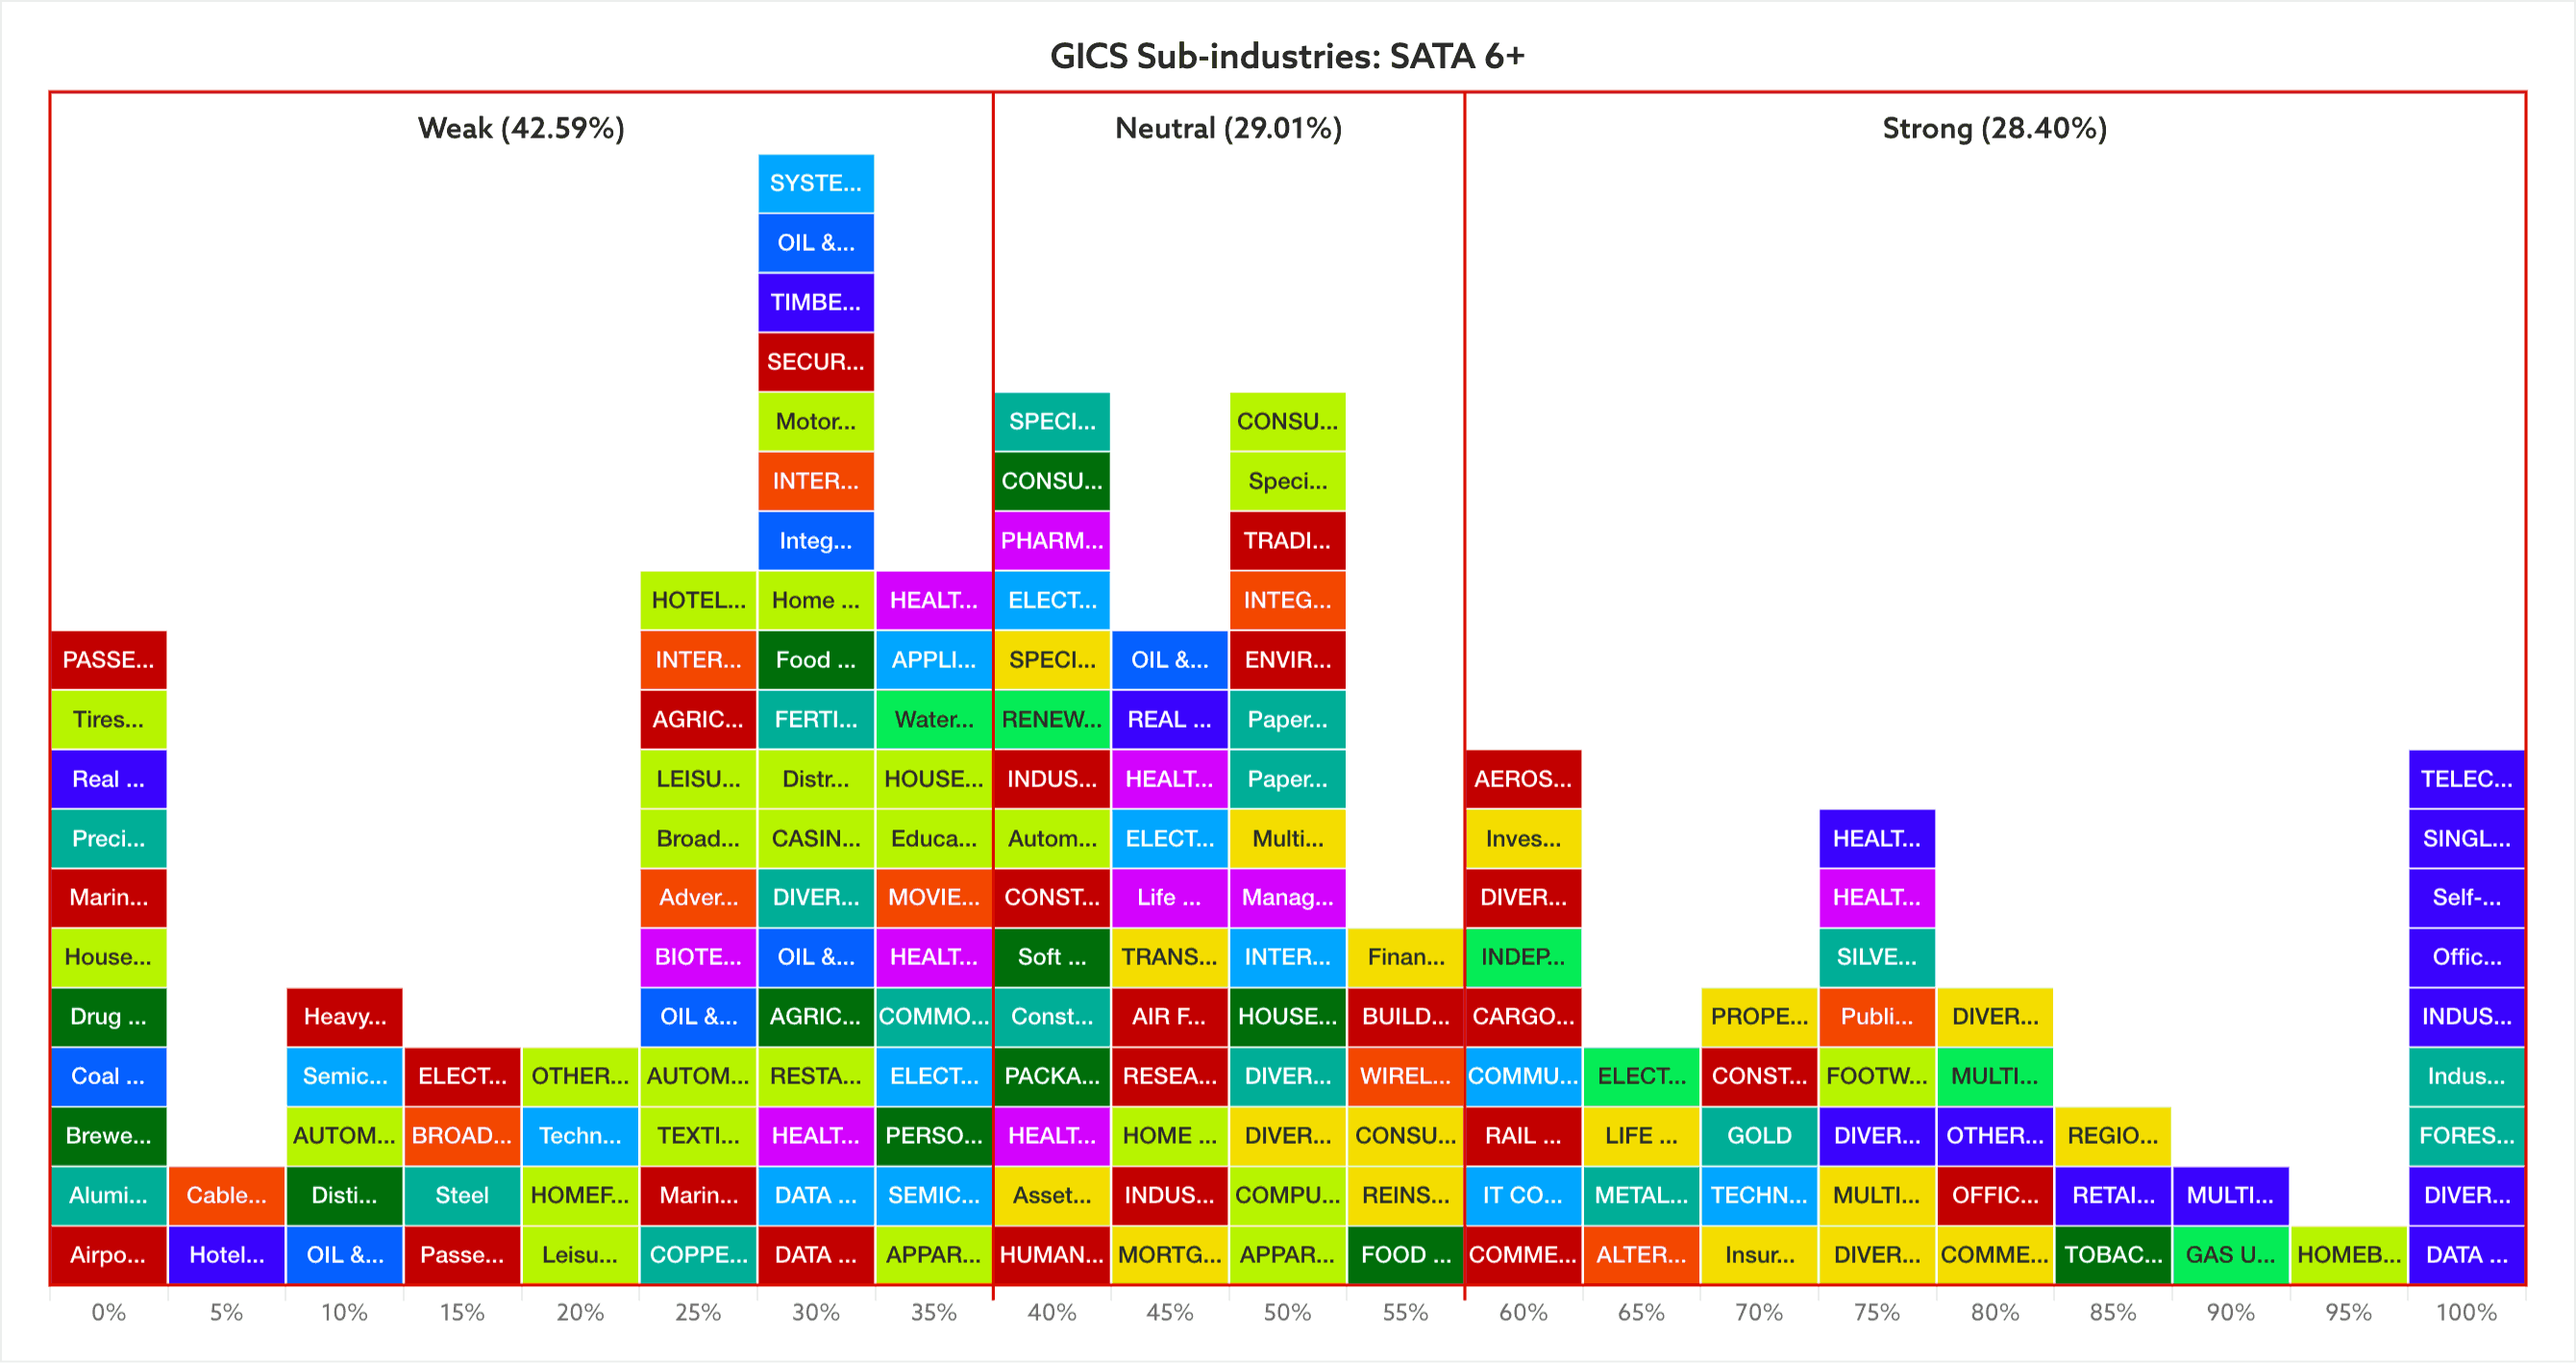
Footwear had one of the largest changes this week, with a +48.79% improvement in the percentage of stocks that are technically healthy in the group. The total with Stage Analysis Technical Attributes (SATA) scores of 6 or higher rose to 77.78%, making it the only Consumer Discretionary sector group in the Strong range (60%+).
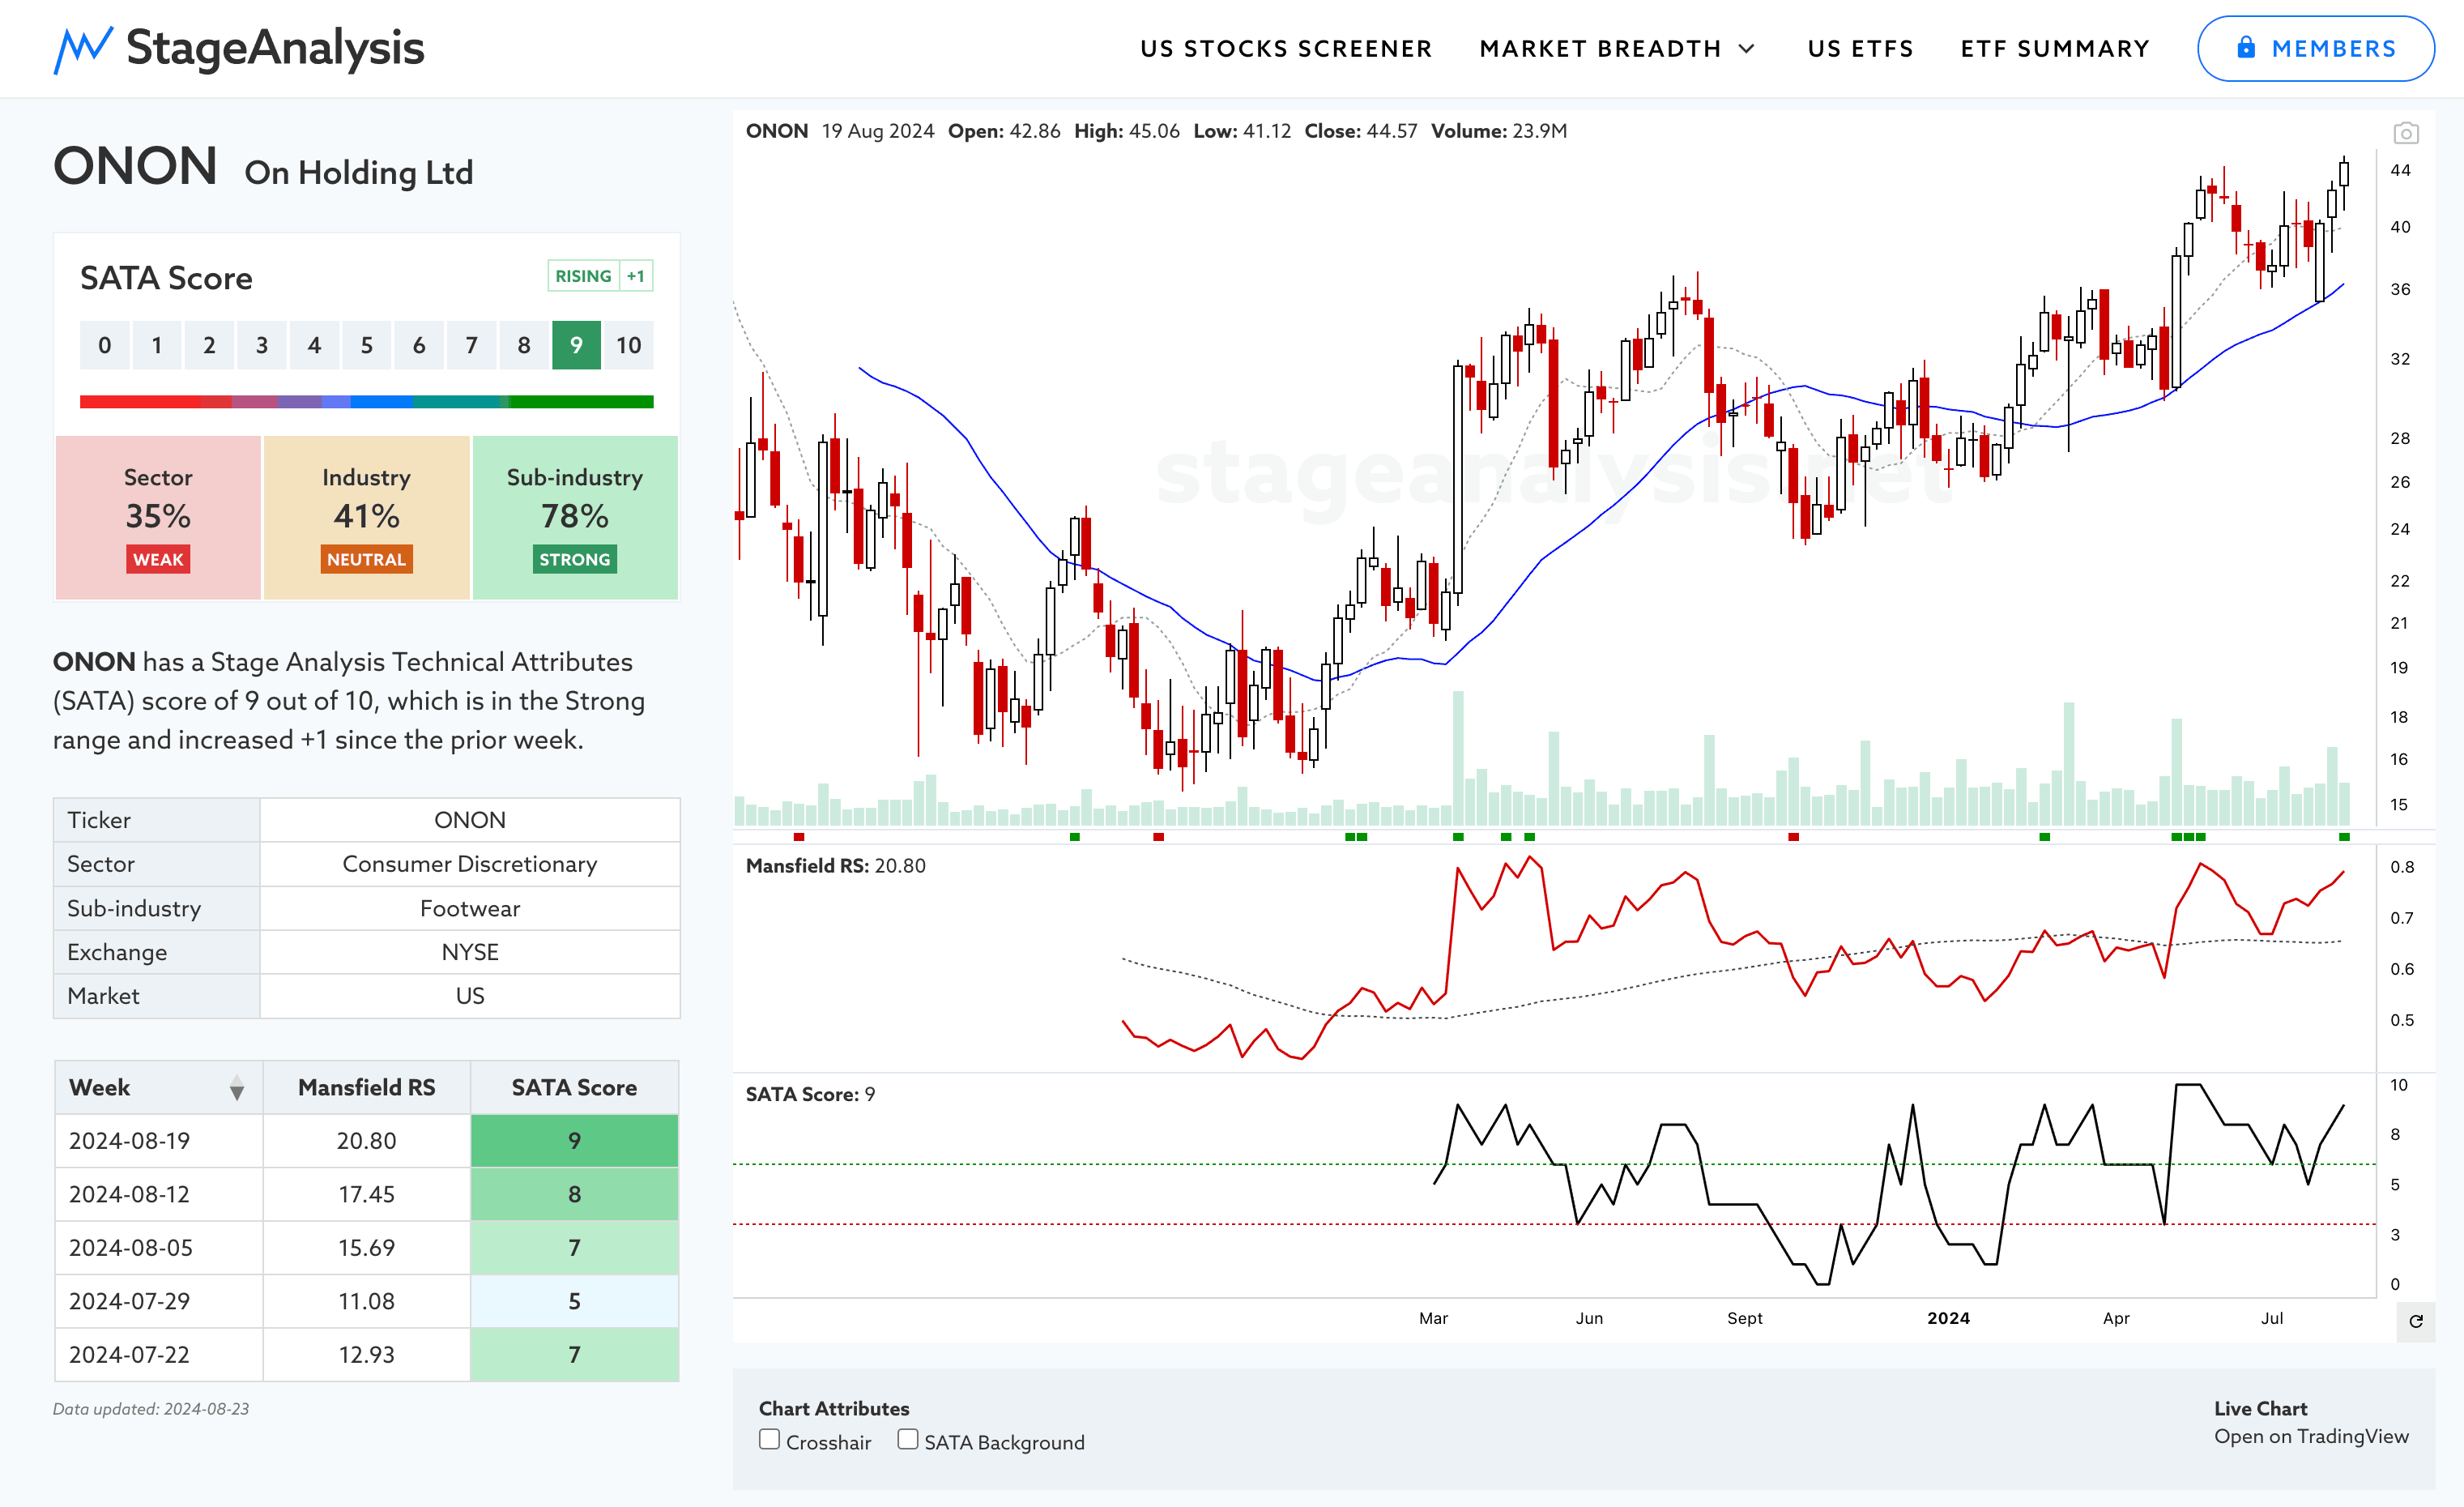
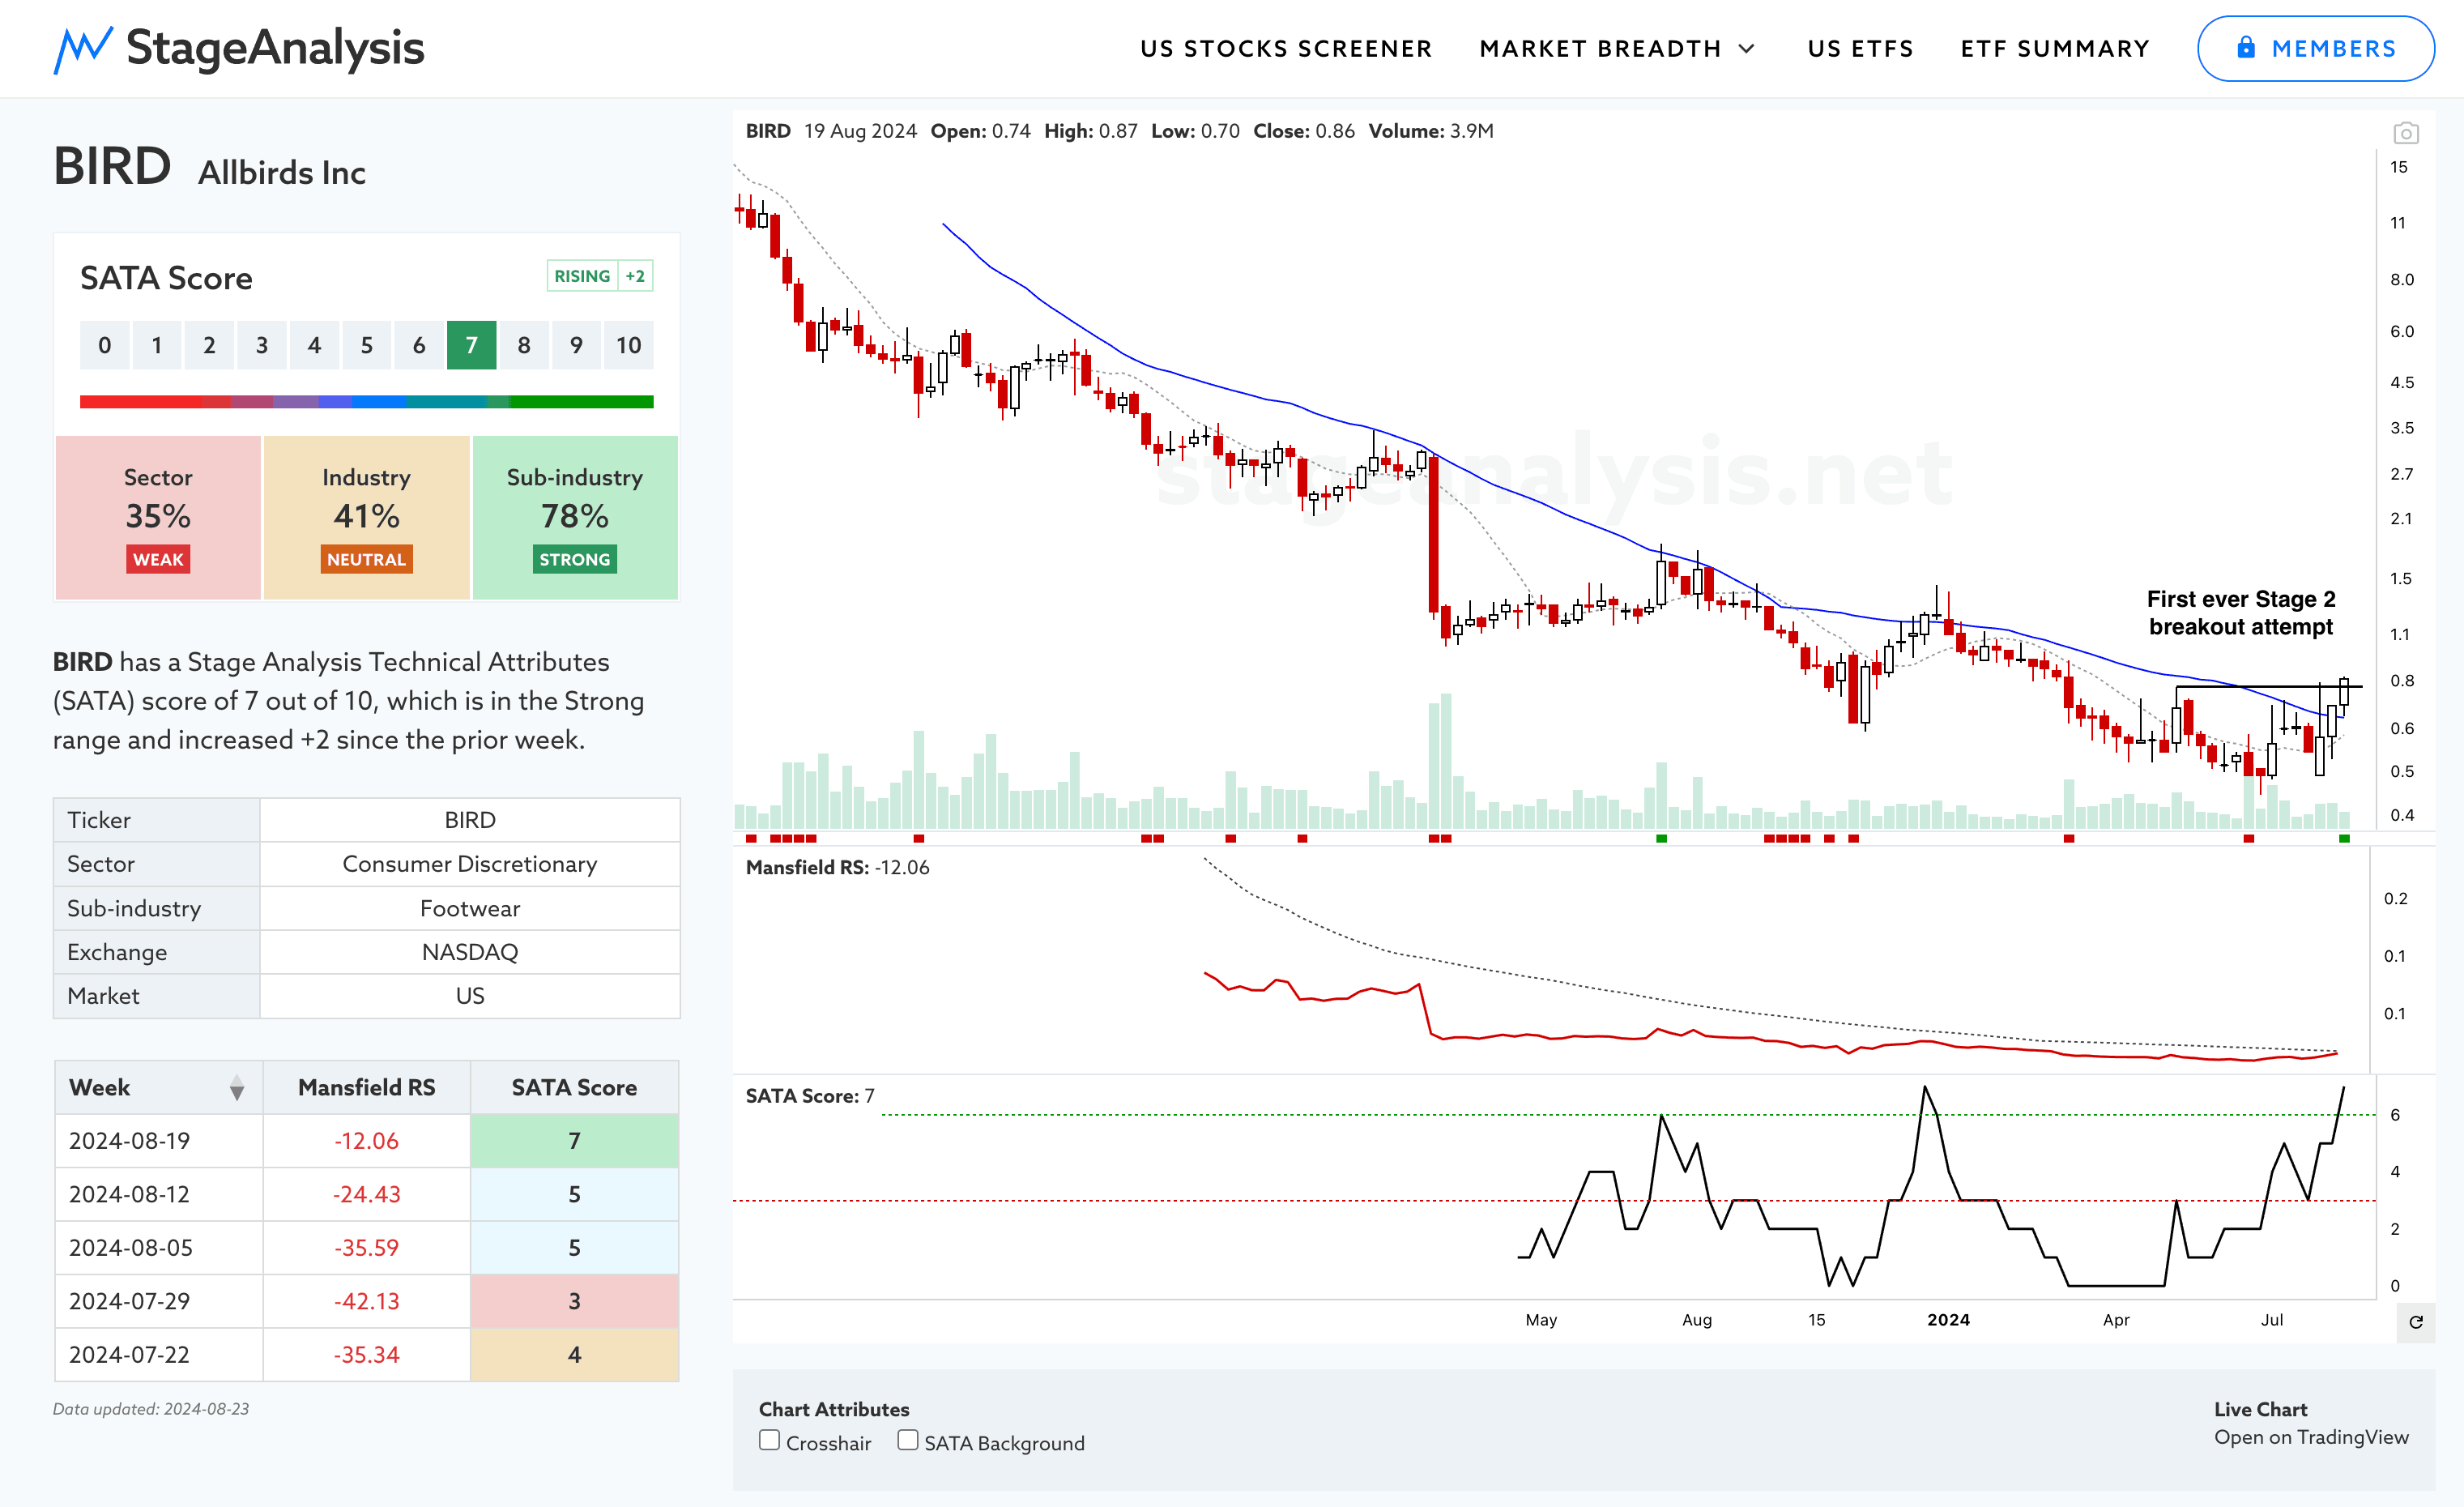
Below is a screenshot of the GICS Sub-industry page for Footwear that members have access to for all GICS Sectors, Groups, Industries and Sub-industries. ONON is currently leading, pushing to new highs and approaching its high that was made following a brief breakout attempt following its IPO in late 2021. Whereas micro-cap stock BIRD is notable, as it made its first ever Stage 2 breakout attempt this week, from a very small base, after being in Stage 4 almost the entire time since its IPO in late 2021. So it will have significant overhead resistance from such a lengthy decline, but is a change of character.
US Industry Groups by Weakest RS Score
US Industry Groups sorted by Relative Strength
The purpose of the Relative Strength (RS) tables is to track the short, medium and long-term RS changes of the individual groups to find the new leadership earlier than the crowd.
RS Score of 100 is the strongest, and 0 is the weakest.
In the Stage Analysis method we are looking to focus on the strongest groups, as what is strong, tends to stay strong for a long time. But we also want to find the improving / up and coming groups that are starting to rise up strongly through the RS table from the lower zone, in order to find the future leading stocks before they break out from a Stage 1 base and move into a Stage 2 advancing phase.
Each week I go through the most interesting groups on the move in more detail during the Stage Analysis Members weekend video – as Industry Group analysis is a key part of Stan Weinstein's Stage Analysis method.

There are now multiple ways on the Stage Analysis website to view individual groups and sectors via the GICS Sub-industries (123), Industries (74) and Groups (25) pages and the new US Stocks Screener, in which you can easily filter via the Sectors and Sub-industries to see the component stocks and their current SATA and Mansfield RS data.
Note: The GICS Sub-industries, Industries and Groups are different to the DJ US Industry Groups used in this post, which I'm gradually retiring as the new Stage Analysis tools are developed, and will be moving this post over to use the GICS Industries or Sub-Industries data in the coming months.
Become a Stage Analysis Member:
To see more like this and other premium content, such as the regular US Stocks watchlist, detailed videos and intraday posts, become a Stage Analysis member.
Join Today
Disclaimer: For educational purpose only. Not investment advice. Seek professional advice from a financial advisor before making any investing decisions.