
Market Breadth: Percentage of Stocks Above their 50 Day, 150 Day & 200 Day Moving Averages Combined
The full post is available to view by members only. For immediate access:
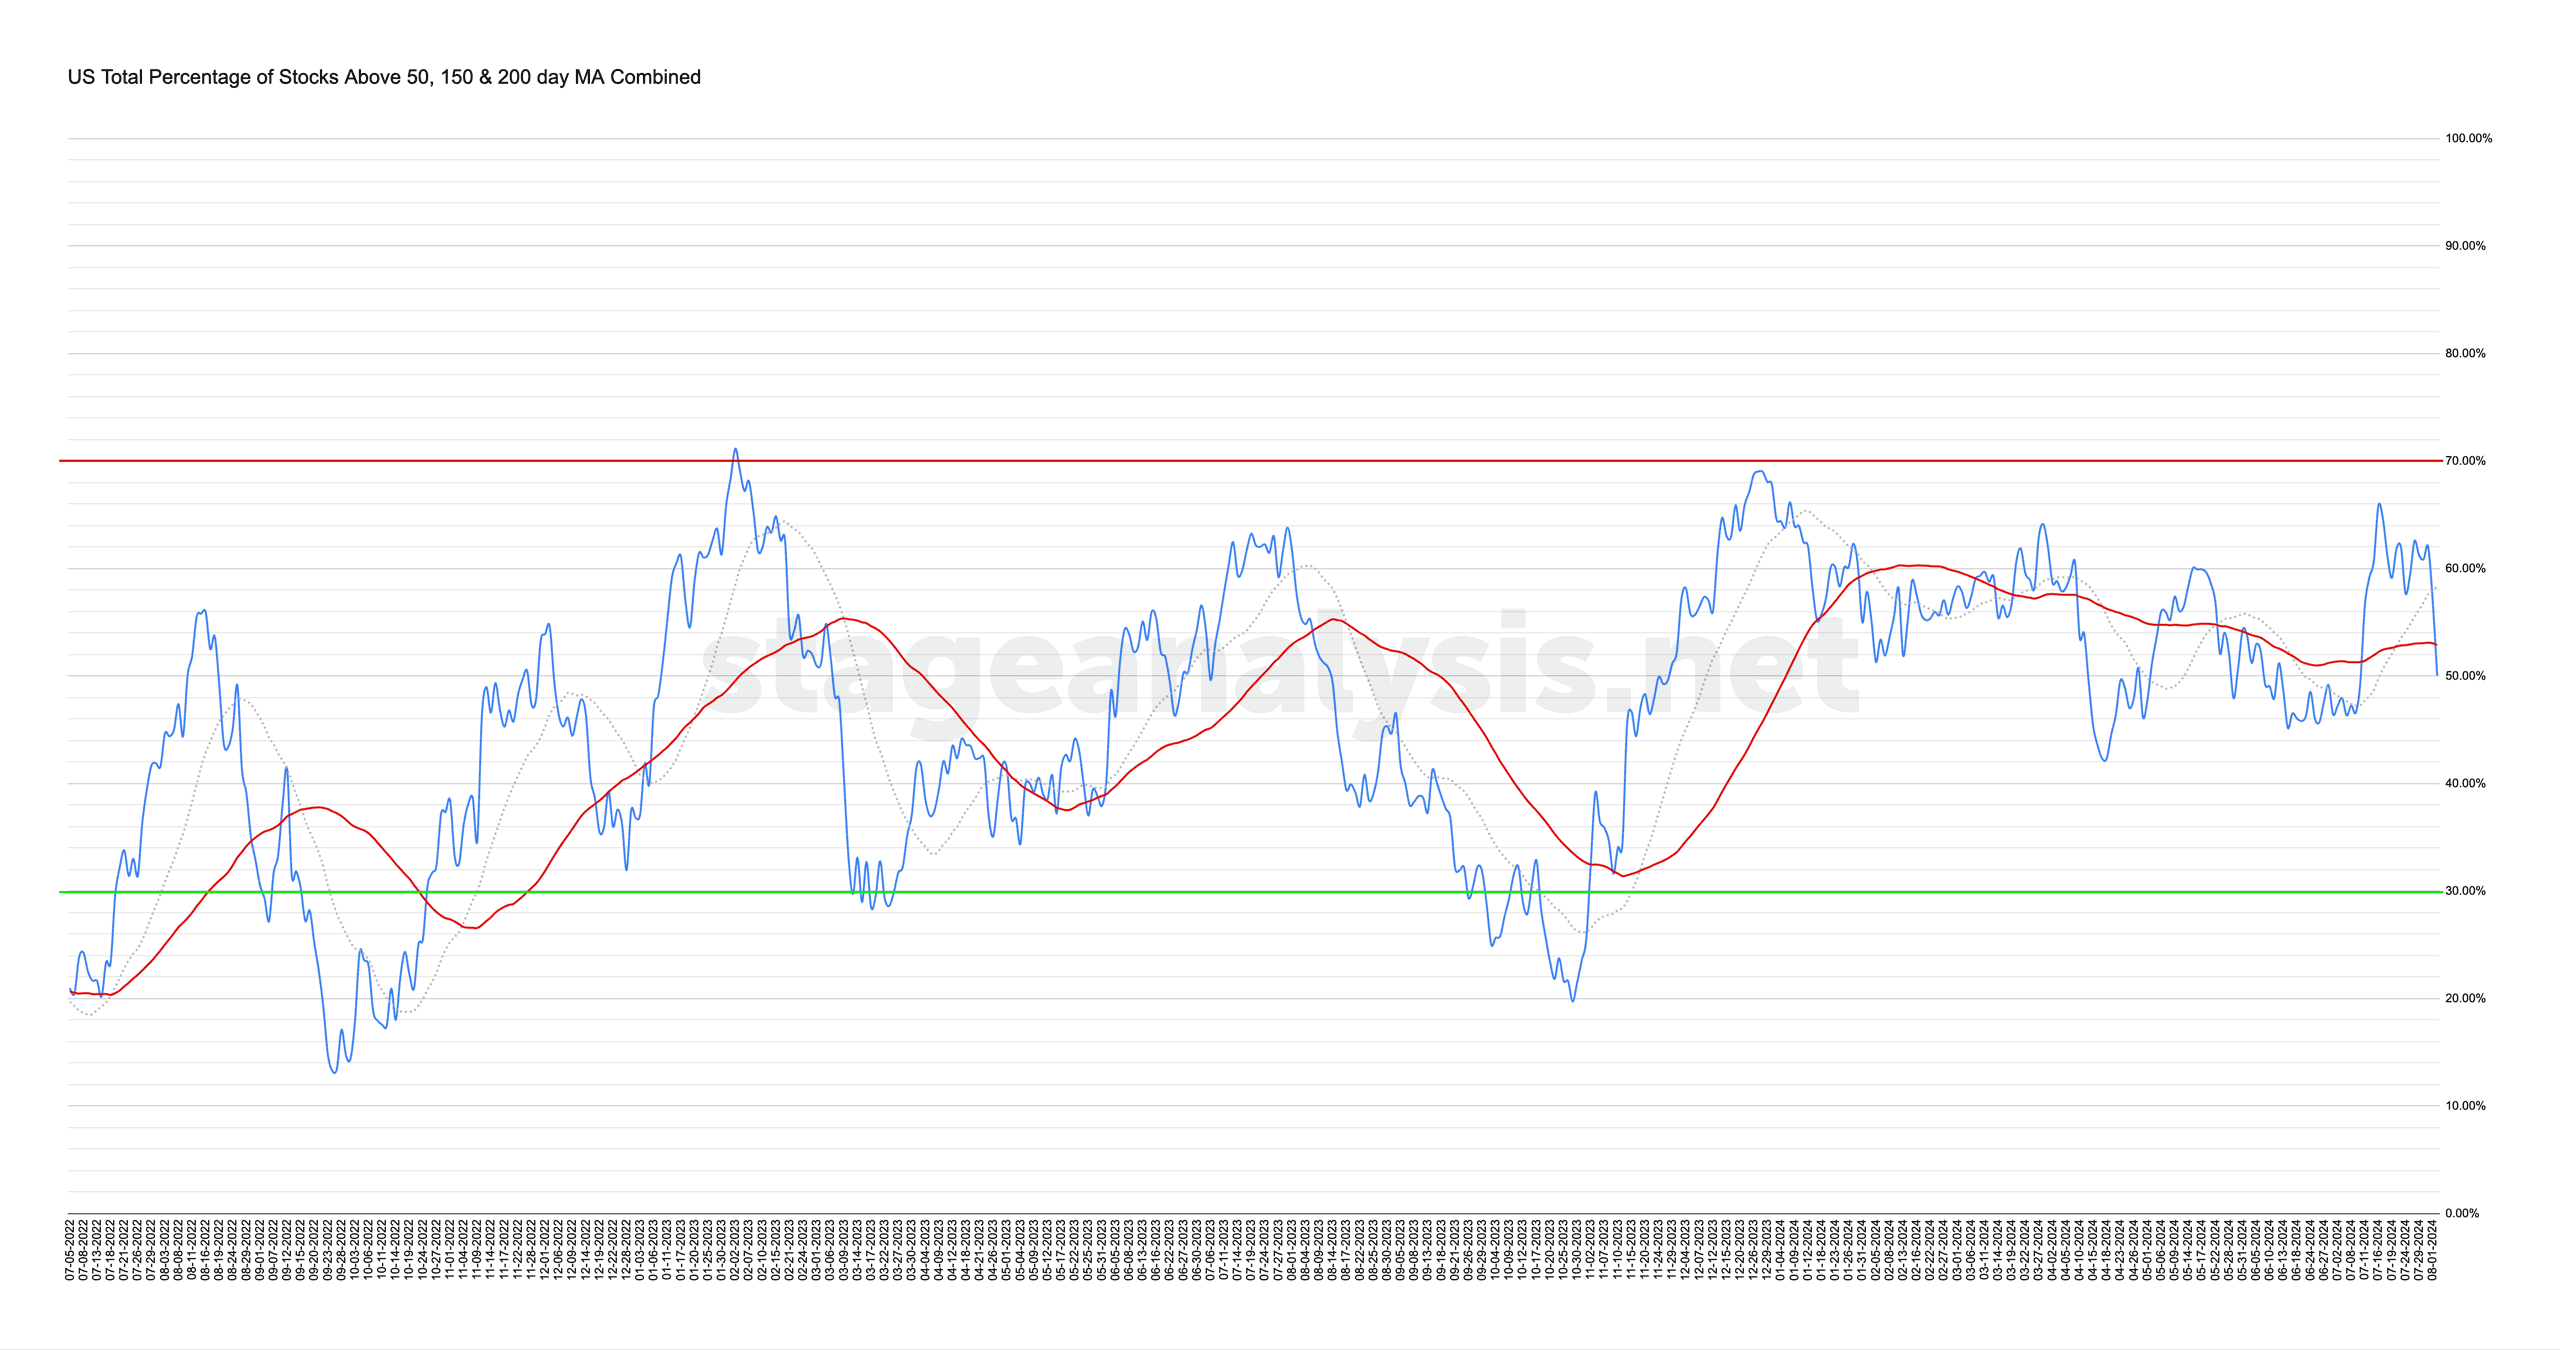
50.03% (-12.54% 1wk)
Status: Difficult Environment
The US Total Percentage of Stocks above their 50 Day, 150 Day & 200 Day Moving Averages (shown above) decreased by -12.54% this week.
Therefore, the overall combined average is at 50.03% in the US market (NYSE and Nasdaq markets combined) above their short, medium and long term moving averages.
A sharp change of behaviour on Thursday, following the Fed meeting on Wednesday, saw the combined moving average breadth drop rapidly, as liquidation took hold in the market, with numerous Stage 4 breakdowns across in a broad range of market sectors. The distance above its 20 day MA dropped to -8.21% and -2.85% below its 50 day MA (signal line). So the environment status changed to a Difficult Environment status once more. Caution.

The Point and Figure (P&F) chart (shown above) declined by a further 3 Os this week. So the P&F strategy remains on Defense (as it is in a column of Os), with the P&F status changing to High Pole Warning in the middle of the playing field. So a neutral overall field position, but the market has the ball currently.
See the Bullish Percent article for more information on the P&F statuses.
Become a Stage Analysis Member:
To see more like this and other premium content, such as the regular US Stocks watchlist, detailed videos and intraday posts, become a Stage Analysis member.
Join Today
Disclaimer: For educational purpose only. Not investment advice. Seek professional advice from a financial advisor before making any investing decisions.