
US Stocks Industry Groups Relative Strength Rankings
The full post is available to view by members only. For immediate access:
US Industry Groups by Highest RS Score
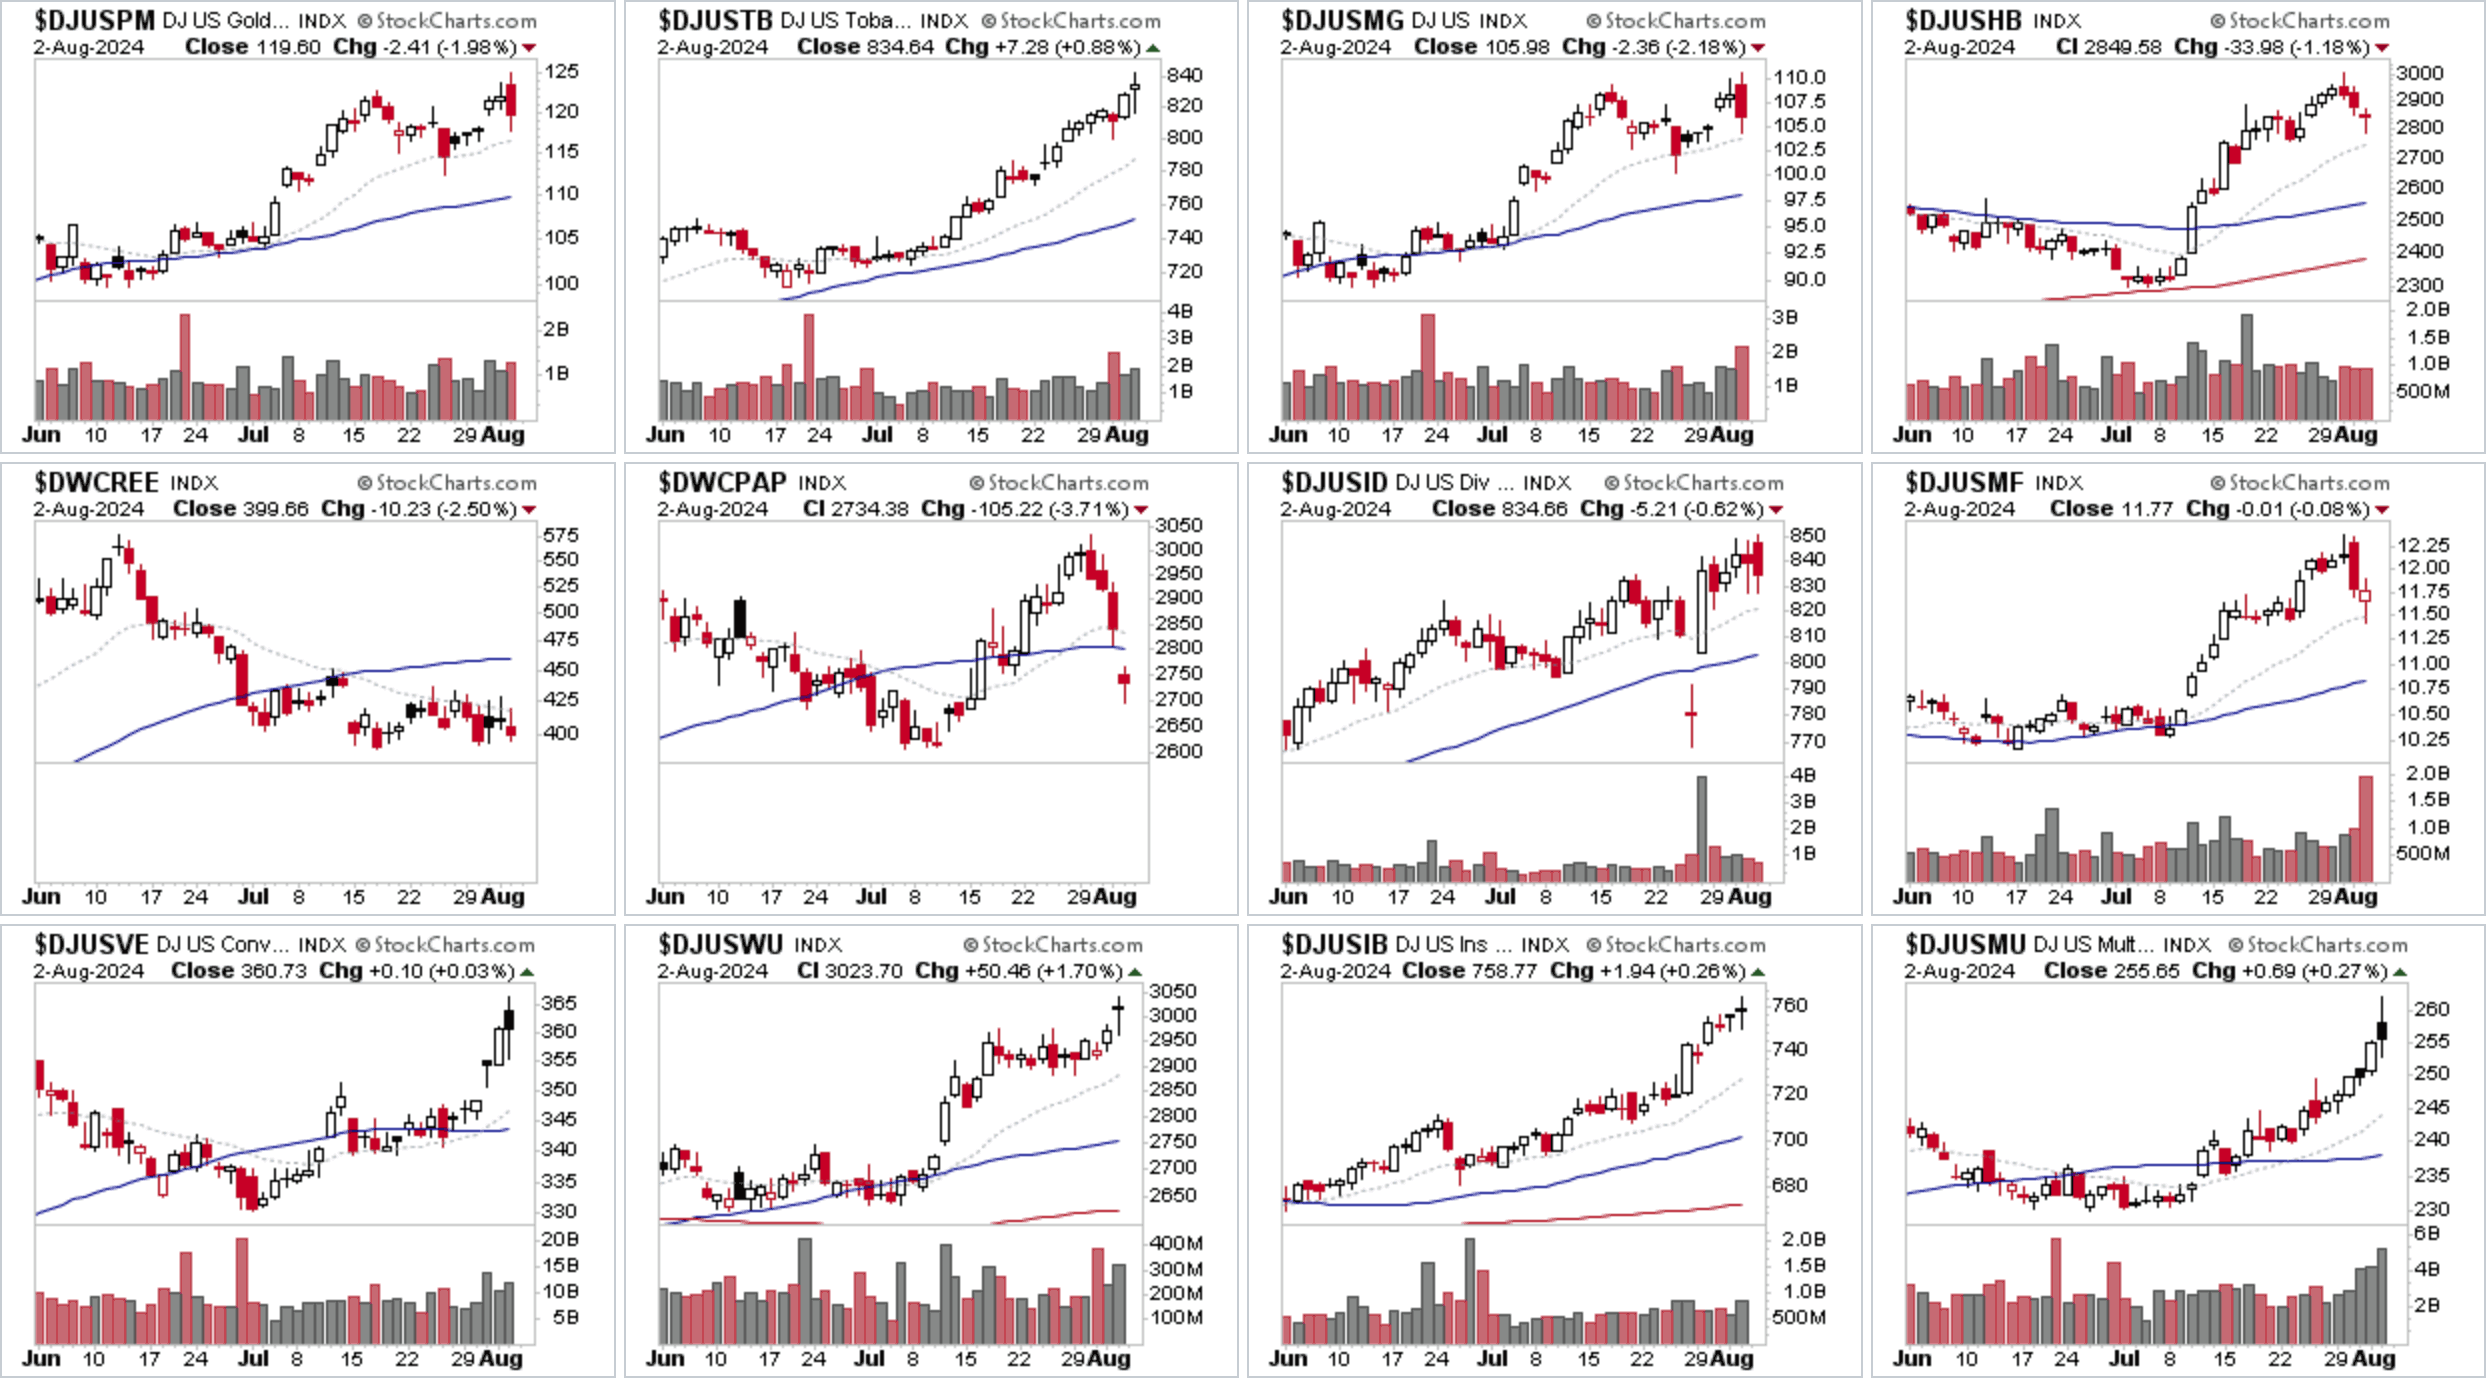
Gold Mining has moved to the top of the US Stocks Industry Groups Relative Strength Rankings this week, but its stocks were hit hard like the majority of groups on Friday, as liquidation took hold across the board. Sending previous leading groups into potential Stage 4 declines.
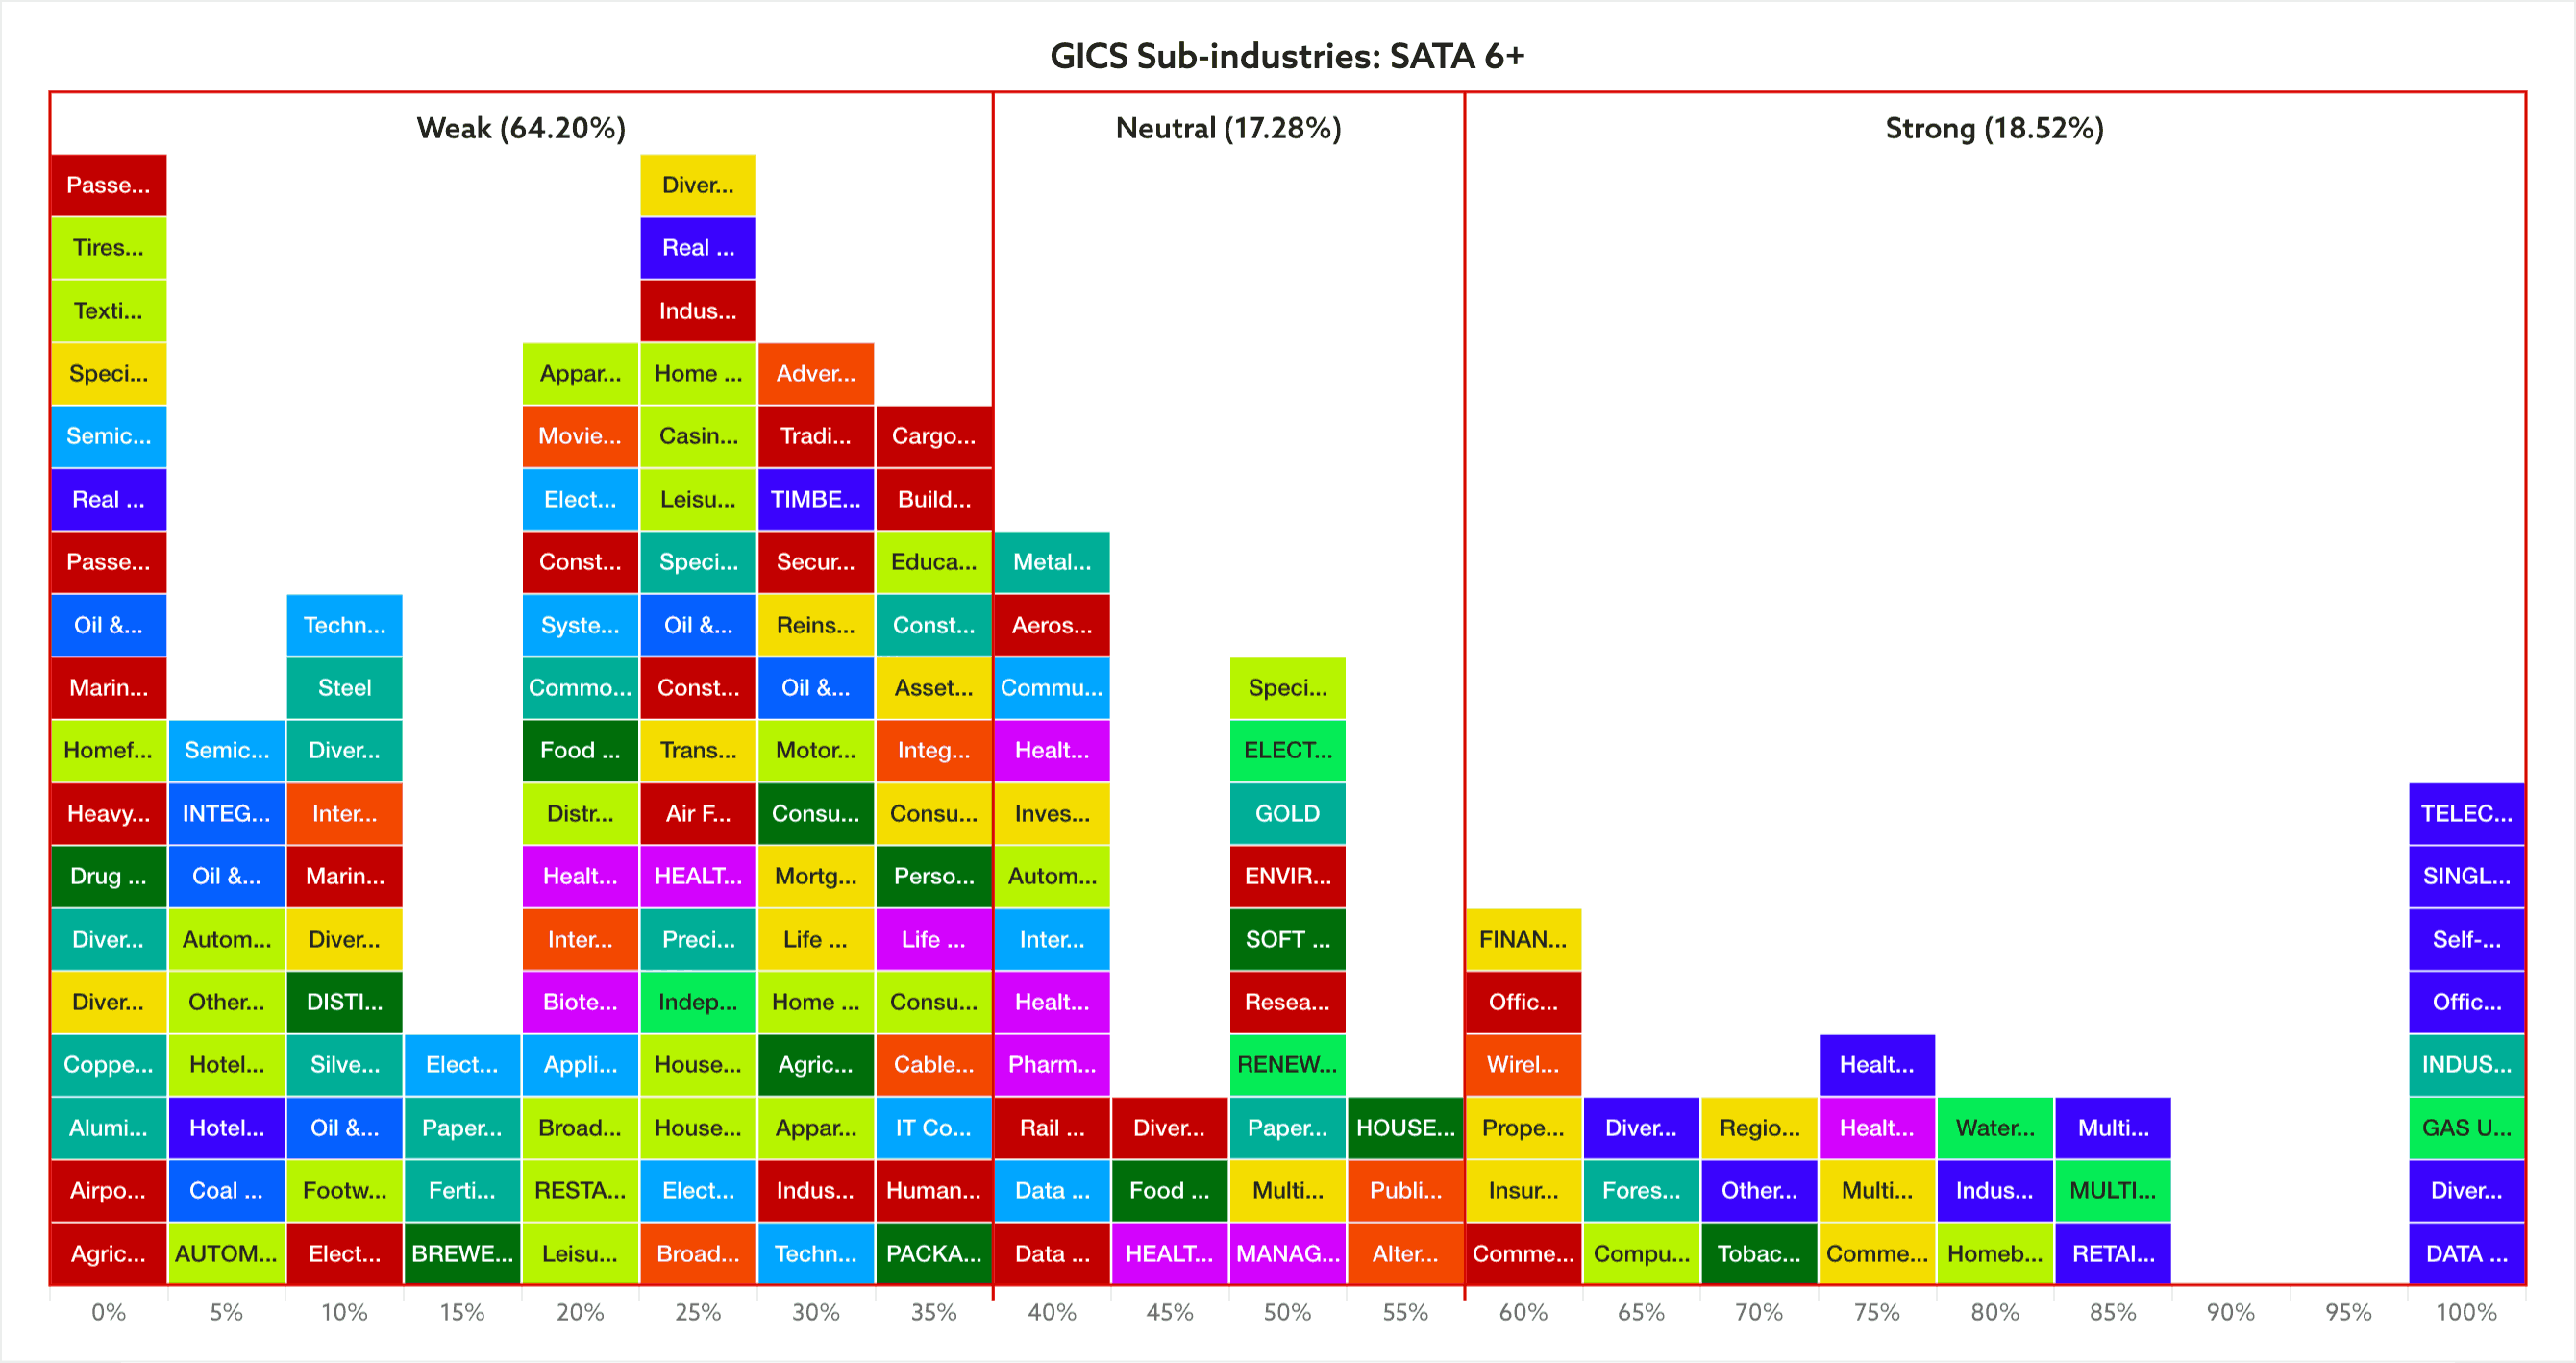
The GICS Sub-industries Bell Curve below shows the depth of the carnage, with the vast majority of groups now residing in the Weak range (i.e. each group has less than 40% of technically healthy stocks), and the strong side of the bell curve is heavily dominated by the Real Estate groups, which has been a consistent theme, moving higher in Stage 2 of late. But even that wasn't immune from the strong selling today, with the sector seeing an overall drop in the SATA scores. The other areas with some relative strength this week were in the Utilities and Consumer Staples sectors, but they also weren't immune from the selling.
So extreme caution seems prudent until there are some signs of a very short-term change of behaviour.
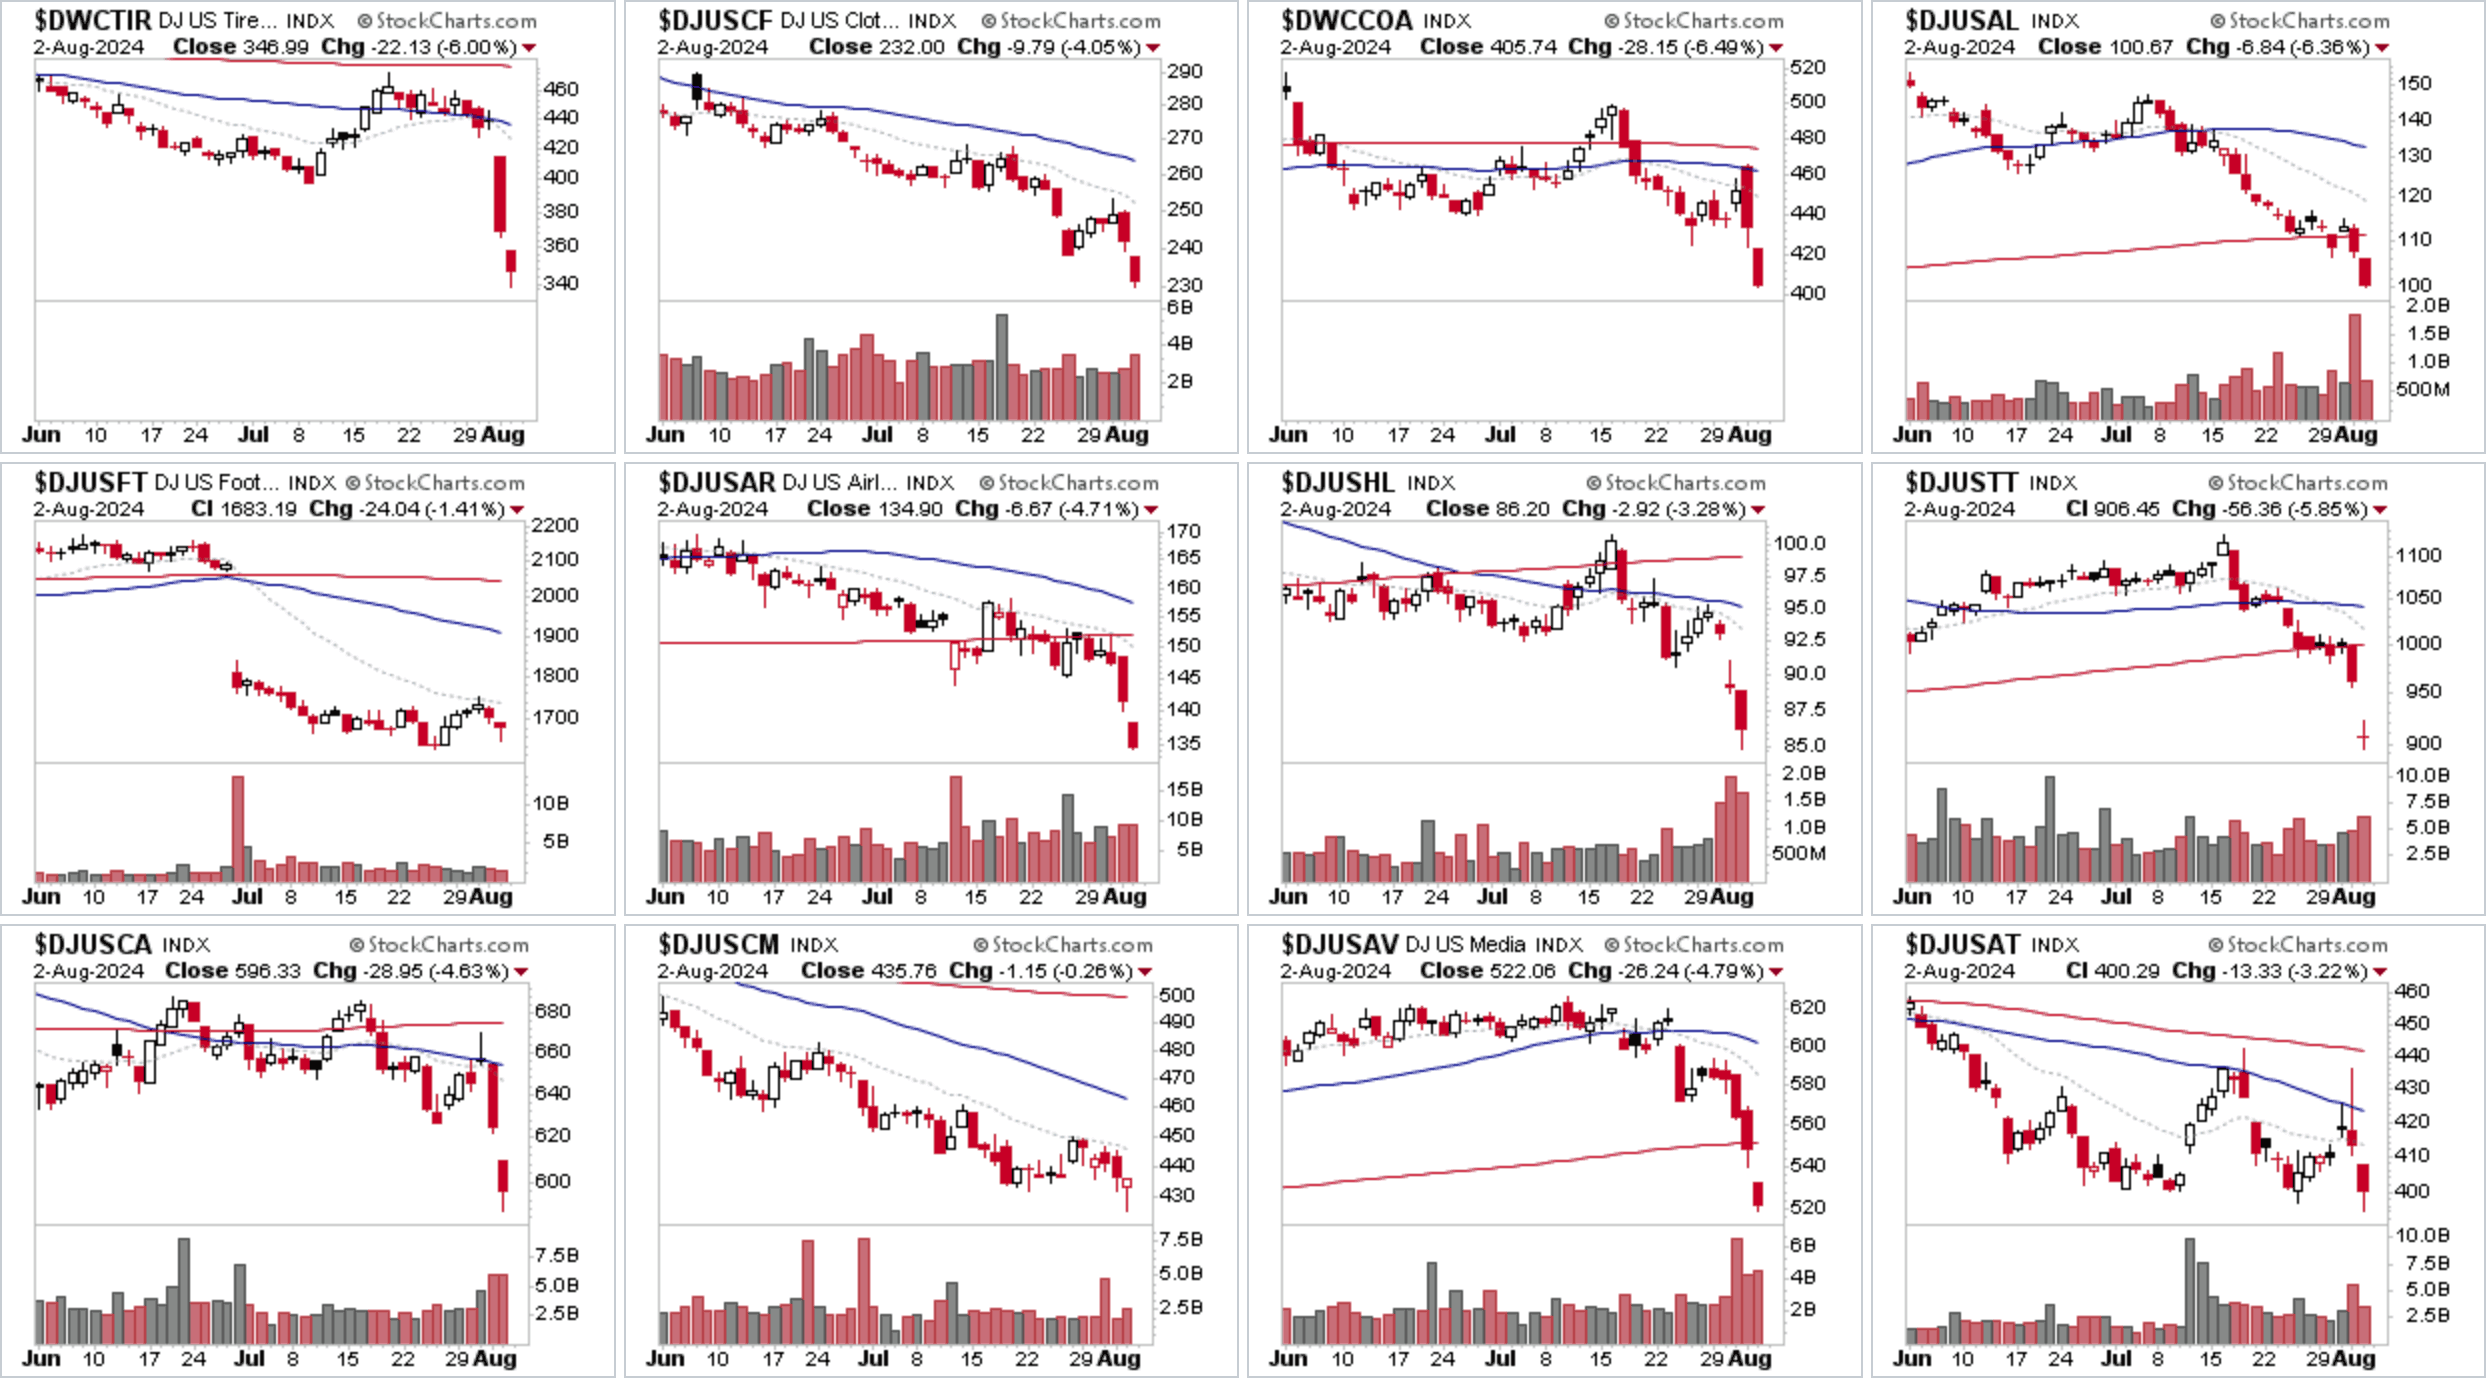
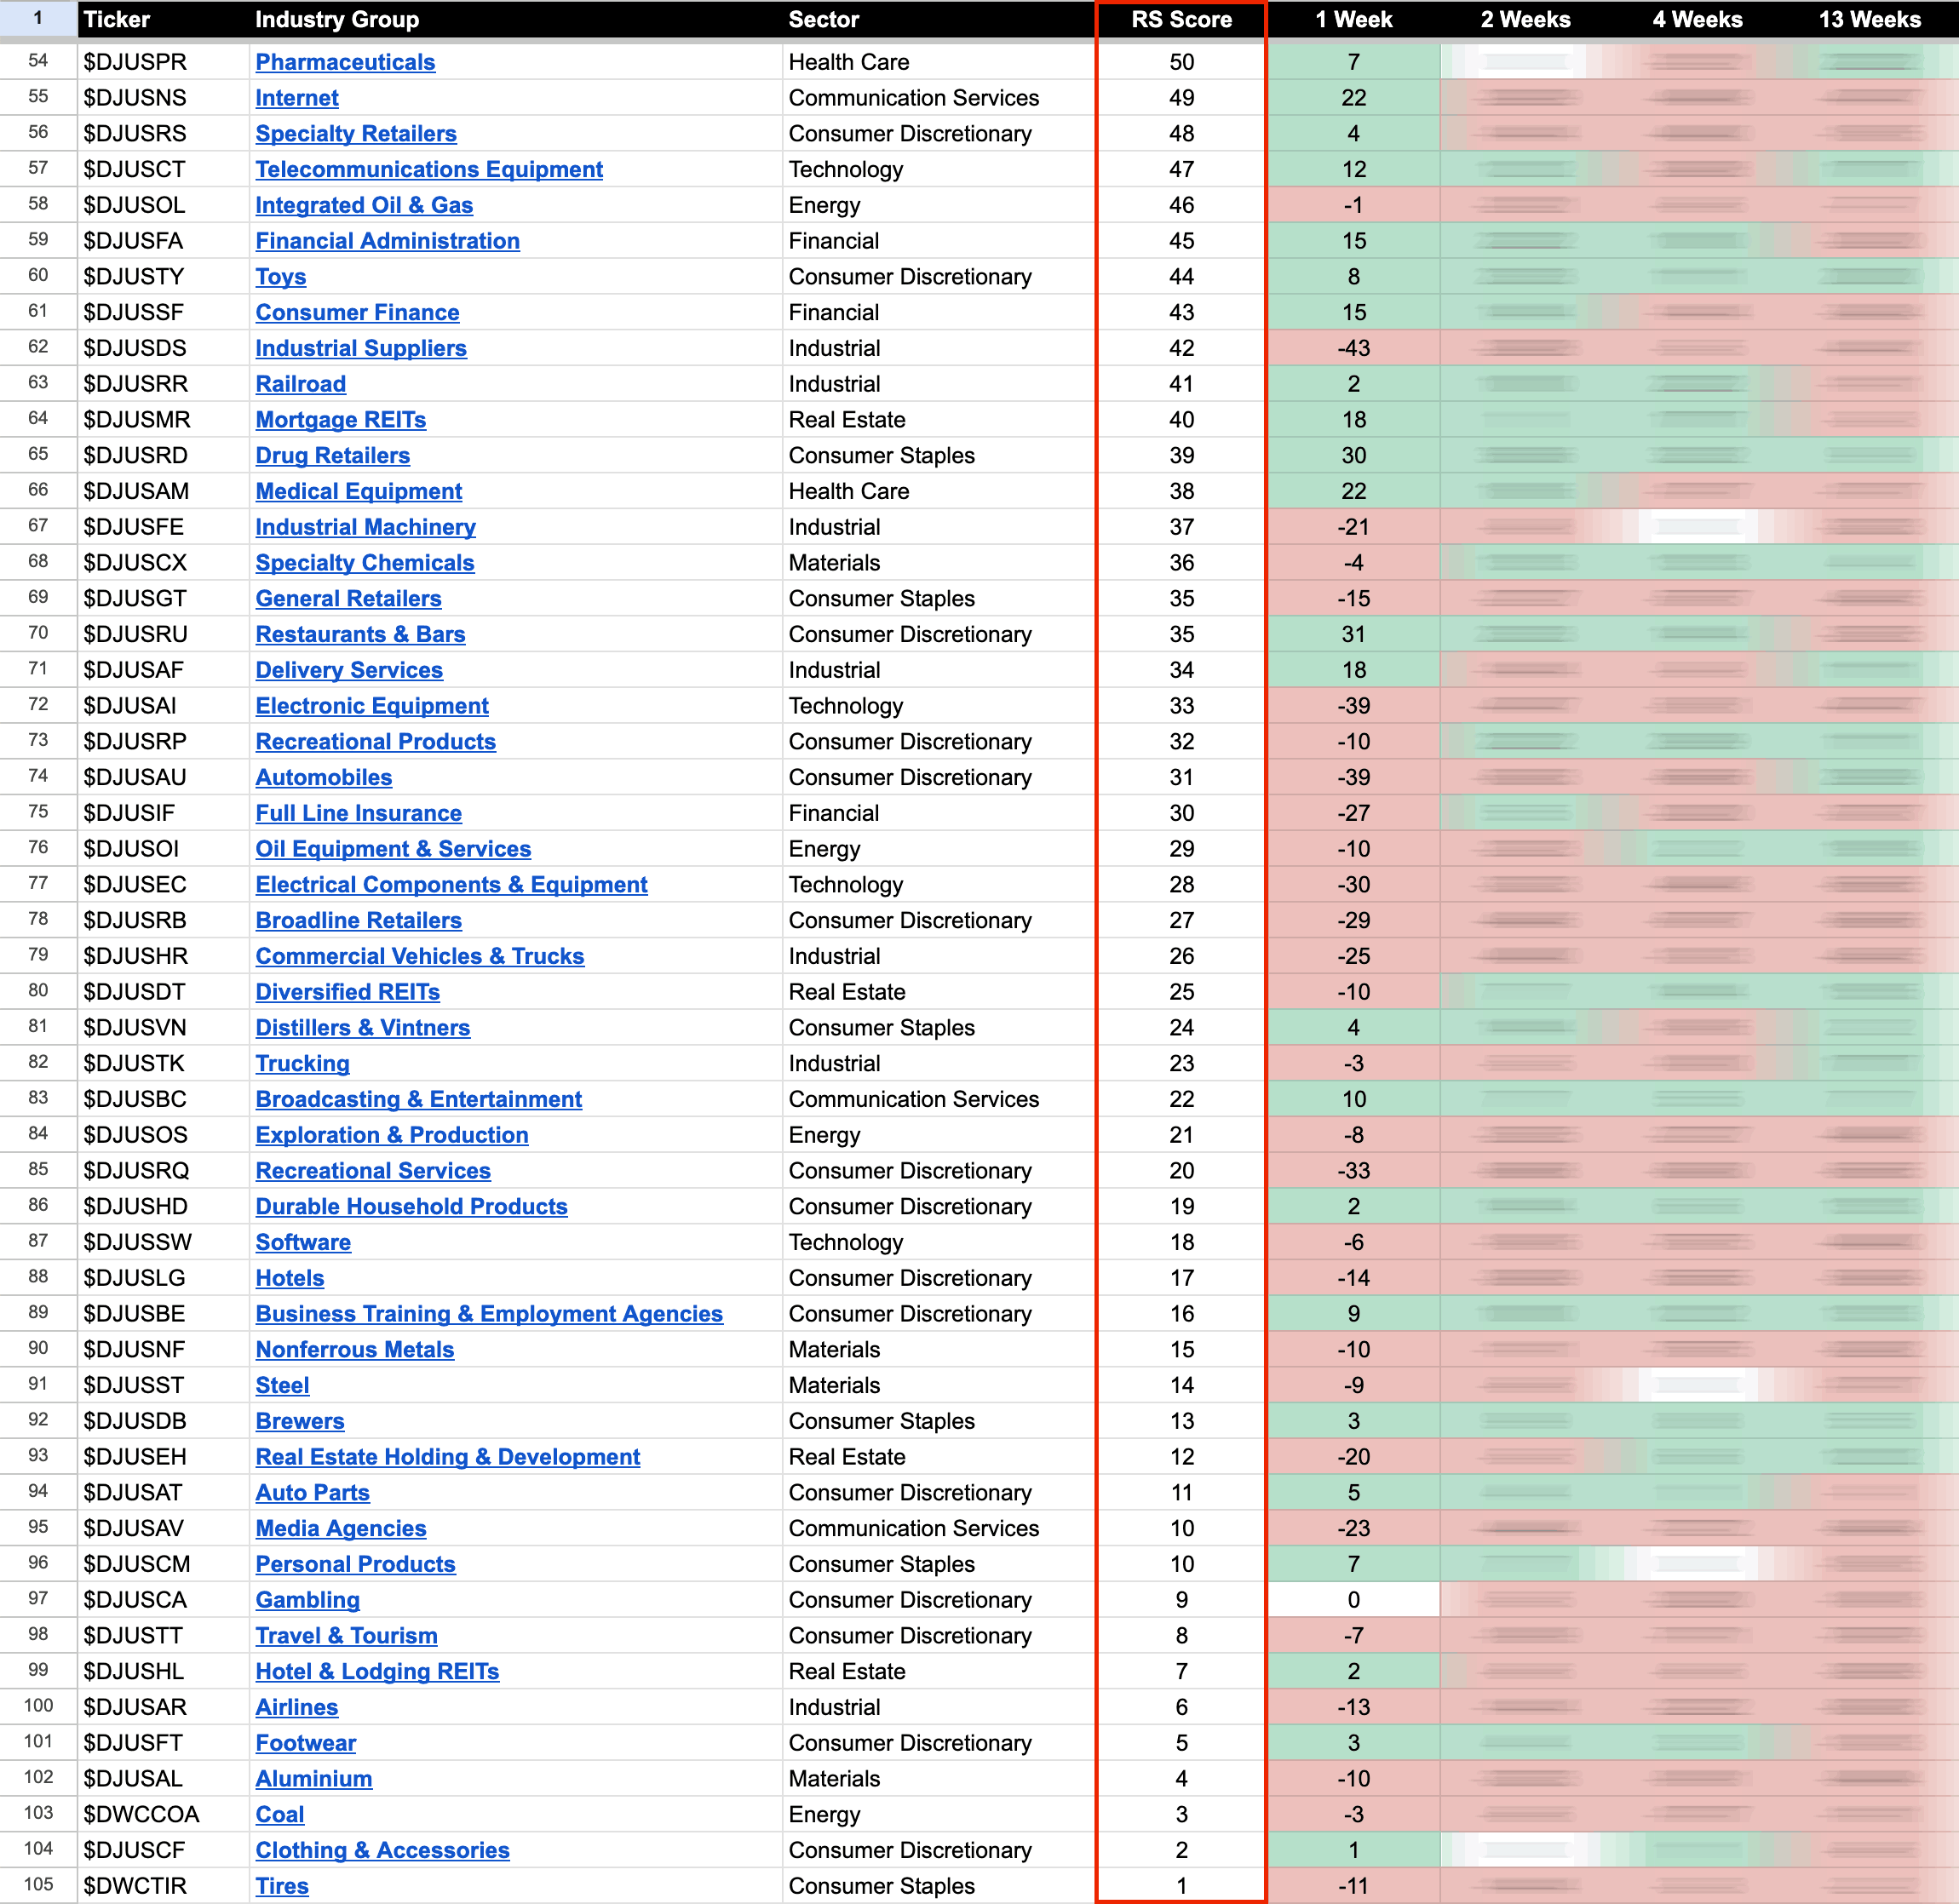
US Industry Groups by Weakest RS Score
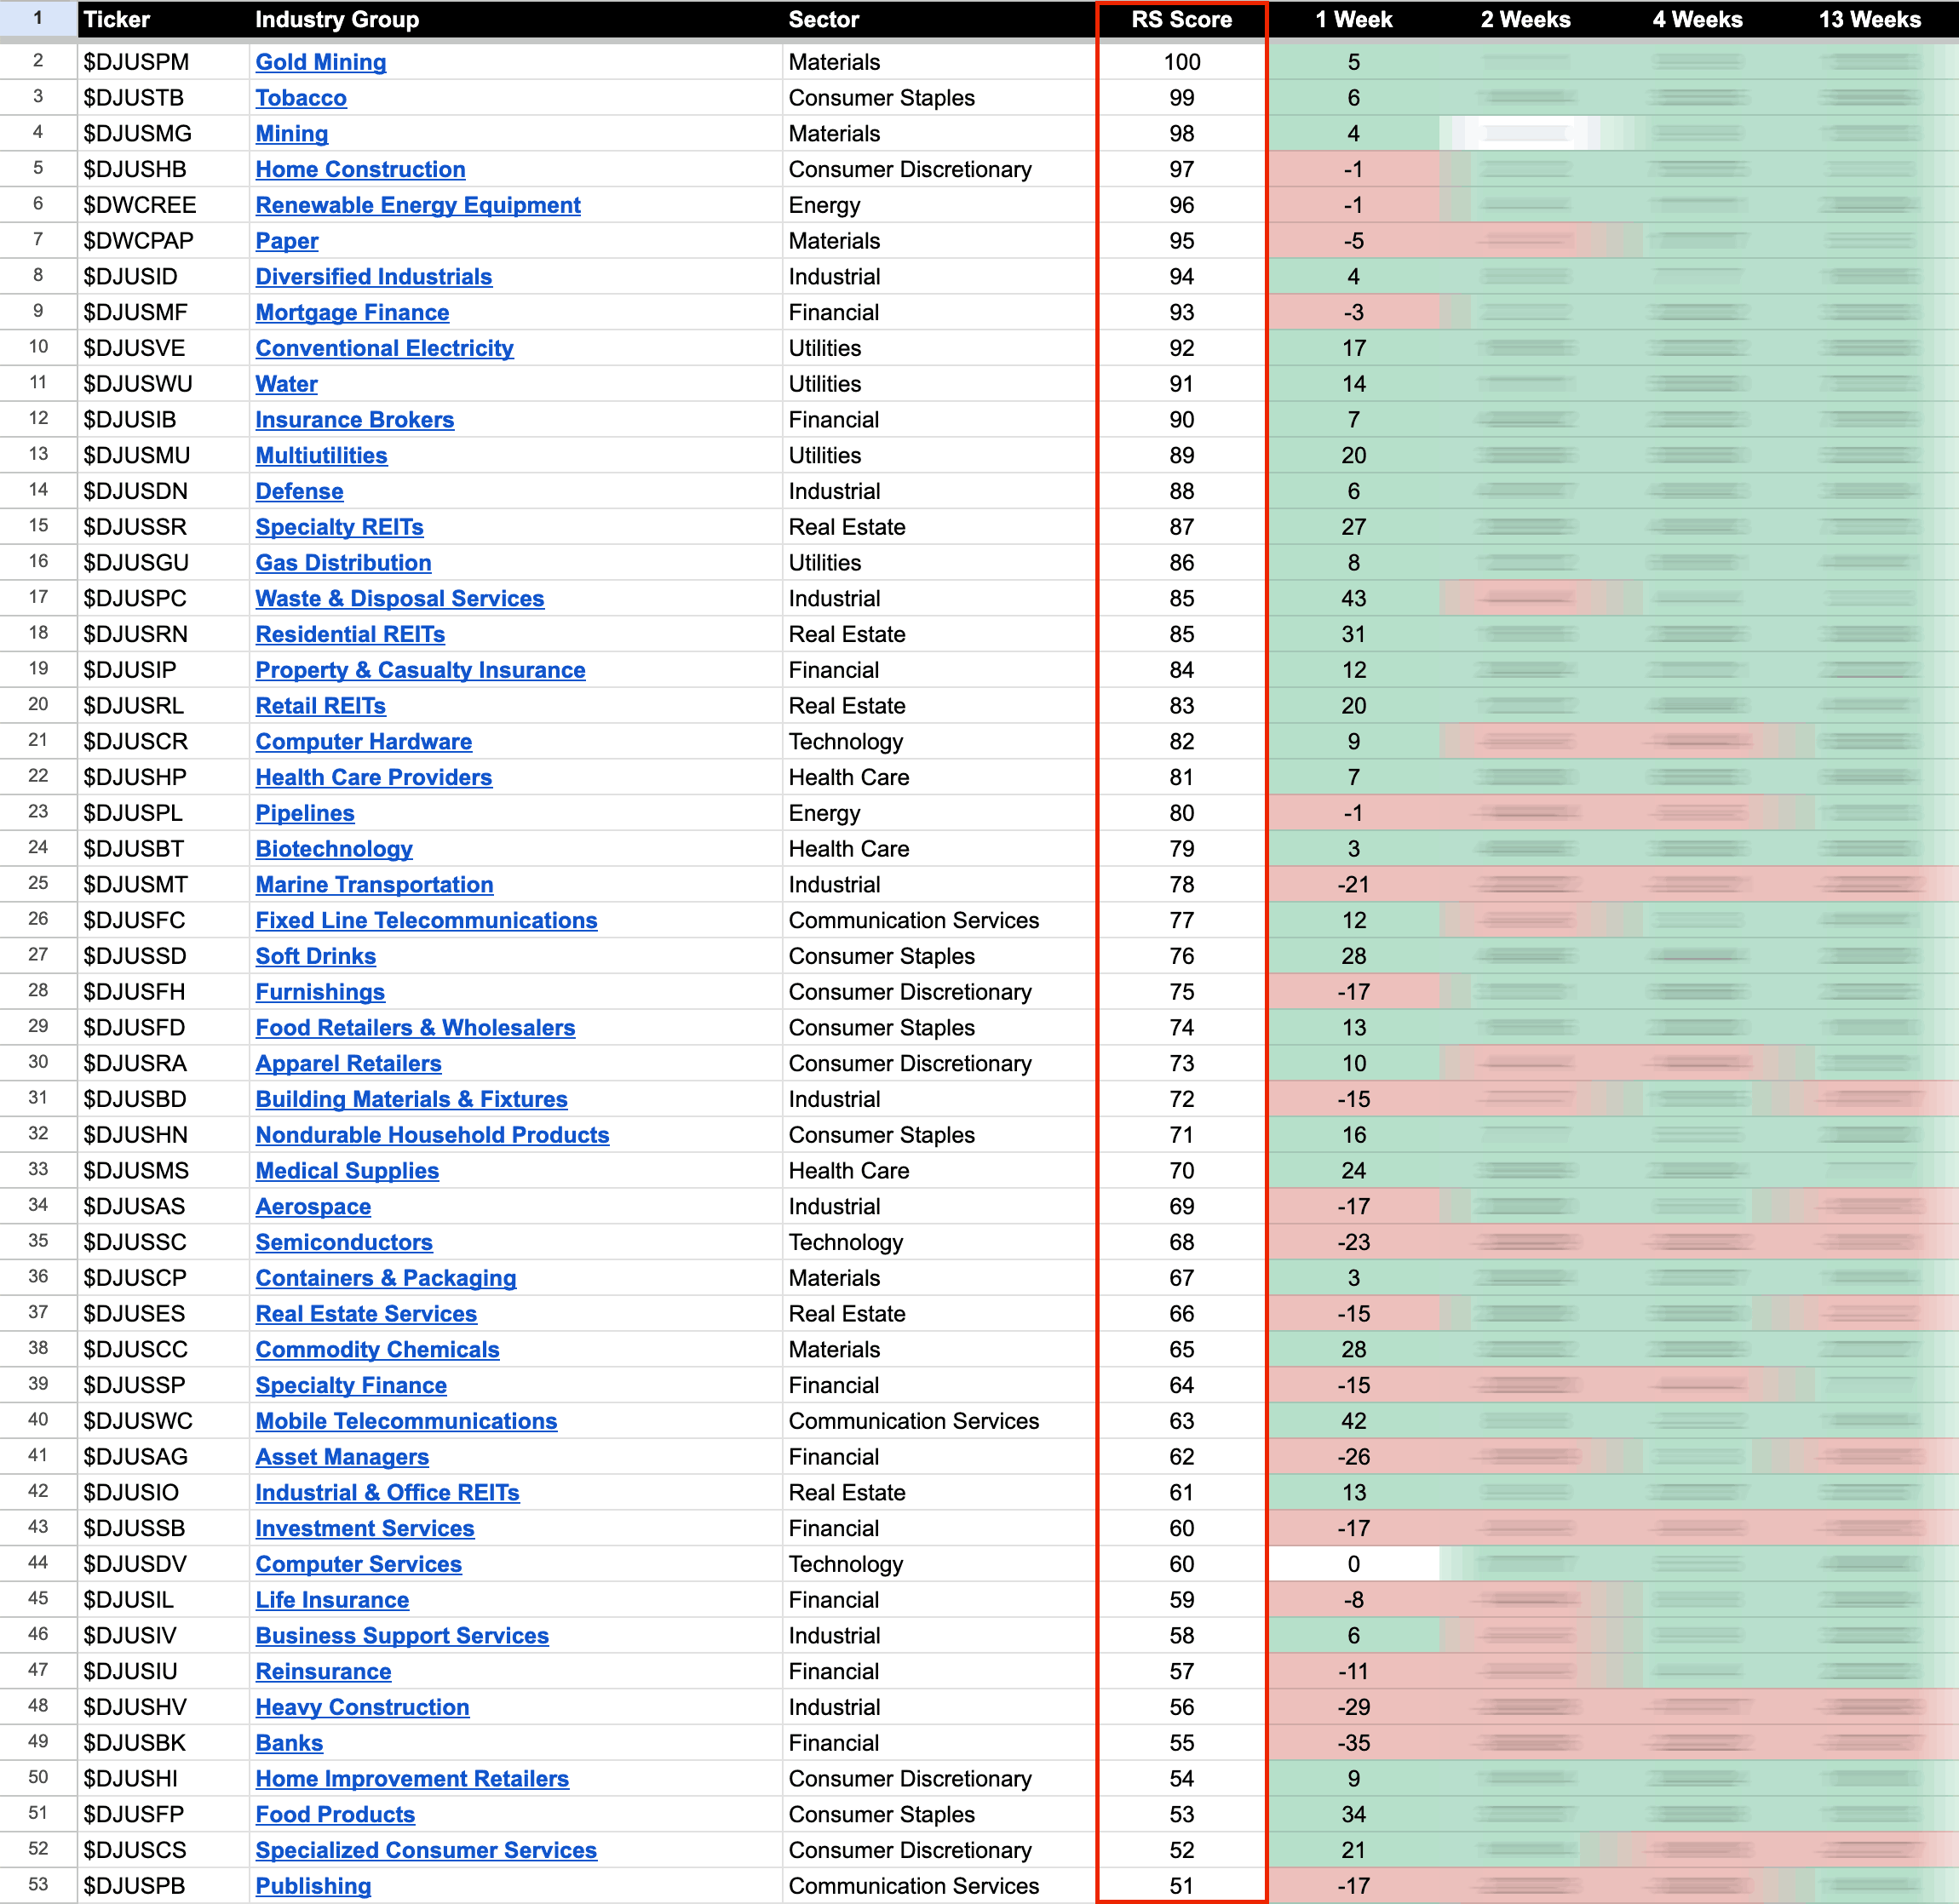
US Industry Groups sorted by Relative Strength
The purpose of the Relative Strength (RS) tables is to track the short, medium and long-term RS changes of the individual groups to find the new leadership earlier than the crowd.
RS Score of 100 is the strongest, and 0 is the weakest.
In the Stage Analysis method we are looking to focus on the strongest groups, as what is strong, tends to stay strong for a long time. But we also want to find the improving / up and coming groups that are starting to rise up strongly through the RS table from the lower zone, in order to find the future leading stocks before they break out from a Stage 1 base and move into a Stage 2 advancing phase.
Each week I go through the most interesting groups on the move in more detail during the Stage Analysis Members weekend video – as Industry Group analysis is a key part of Stan Weinstein's Stage Analysis method.
There are now multiple ways on the Stage Analysis website to view individual groups and sectors via the GICS Sub-industries (123), Industries (74) and Groups (25) pages and the new US Stocks Screener, in which you can easily filter via the Sectors and Sub-industries to see the component stocks and their current SATA and Mansfield RS data.
Note: The GICS Sub-industries, Industries and Groups are different to the DJ US Industry Groups used in this post, which I'm gradually retiring as the new Stage Analysis tools are developed, and will be moving this post over to use the GICS Industries or Sub-Industries data in the coming months.
Become a Stage Analysis Member:
To see more like this and other premium content, such as the regular US Stocks watchlist, detailed videos and intraday posts, become a Stage Analysis member.
Join Today
Disclaimer: For educational purpose only. Not investment advice. Seek professional advice from a financial advisor before making any investing decisions.