
Market Breadth: Percentage of Stocks Above their 50 Day, 150 Day & 200 Day Moving Averages Combined
The full post is available to view by members only. For immediate access:
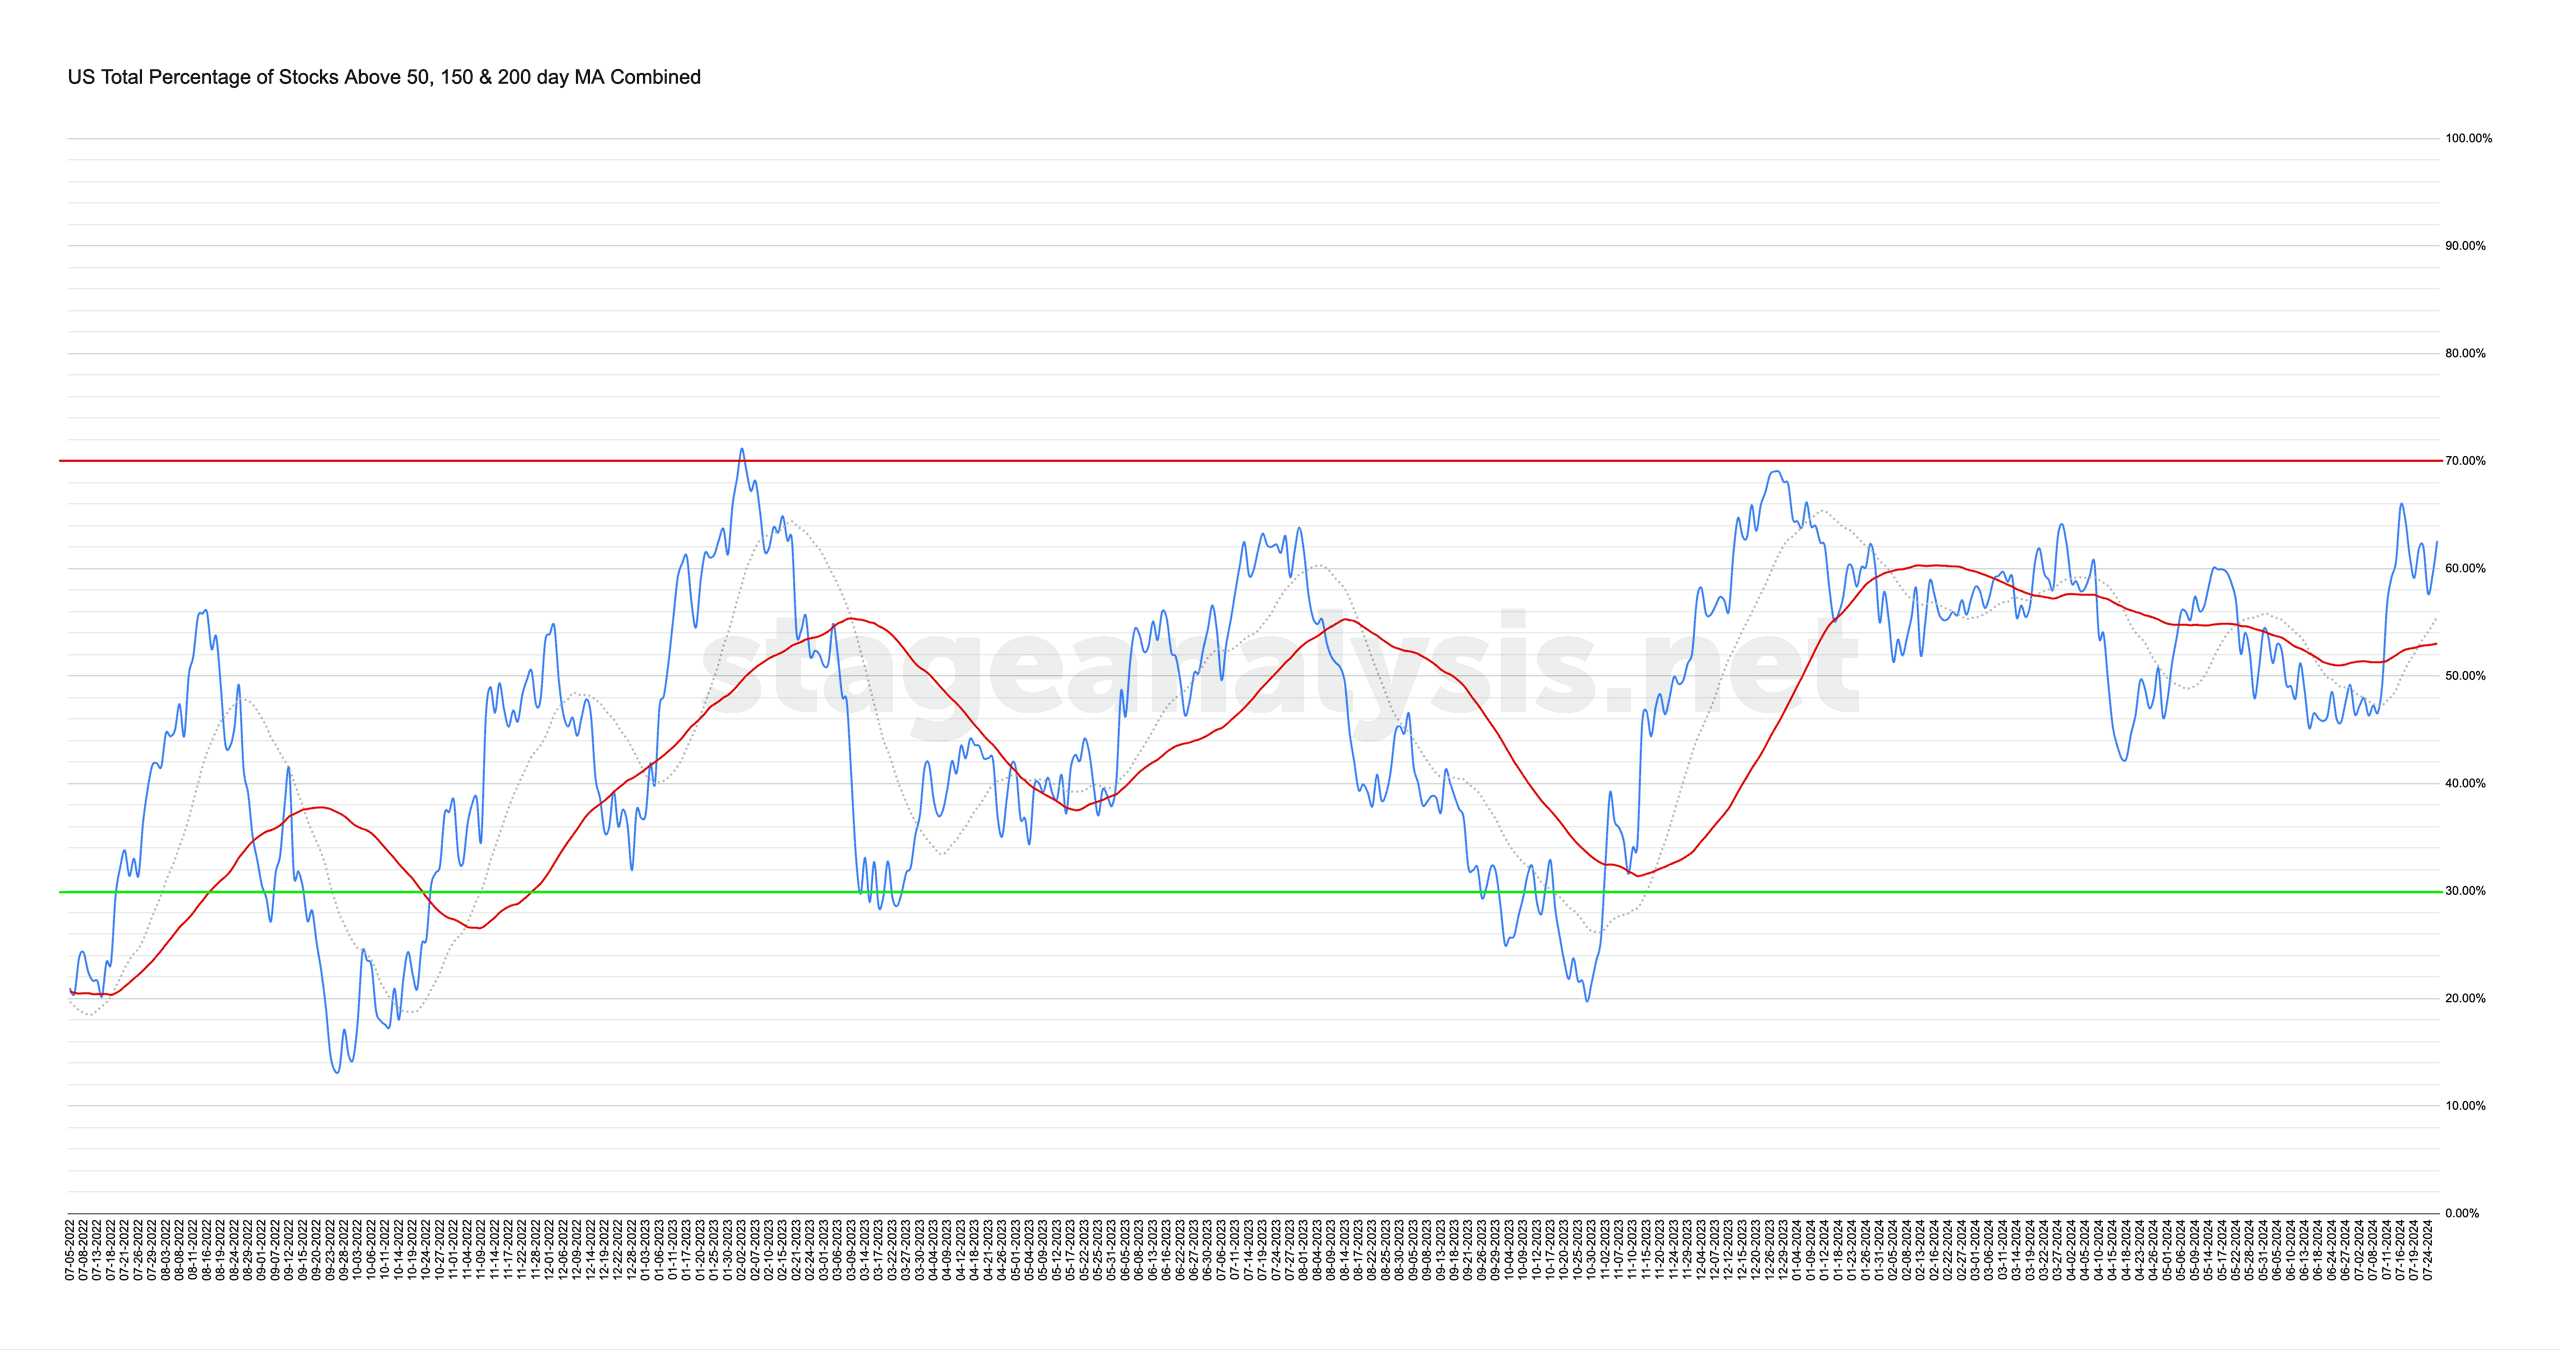
62.57% (+3.44% 1wk)
Status: Positive Environment
The US Total Percentage of Stocks above their 50 Day, 150 Day & 200 Day Moving Averages (shown above) increased by +3.44% this week.
Therefore, the overall combined average is at 62.57% in the US market (NYSE and Nasdaq markets combined) above their short, medium and long term moving averages.
The combined moving average breadth rebounded this week, back into the strong zone (60%+), with it holding well above its key MAs. It is currently +7.03% above its 20 day MA and +9.55% above its 50 day MA (signal line). So it remains on a Positive Environment status, as the rotation from mega to small caps persists in the near term.
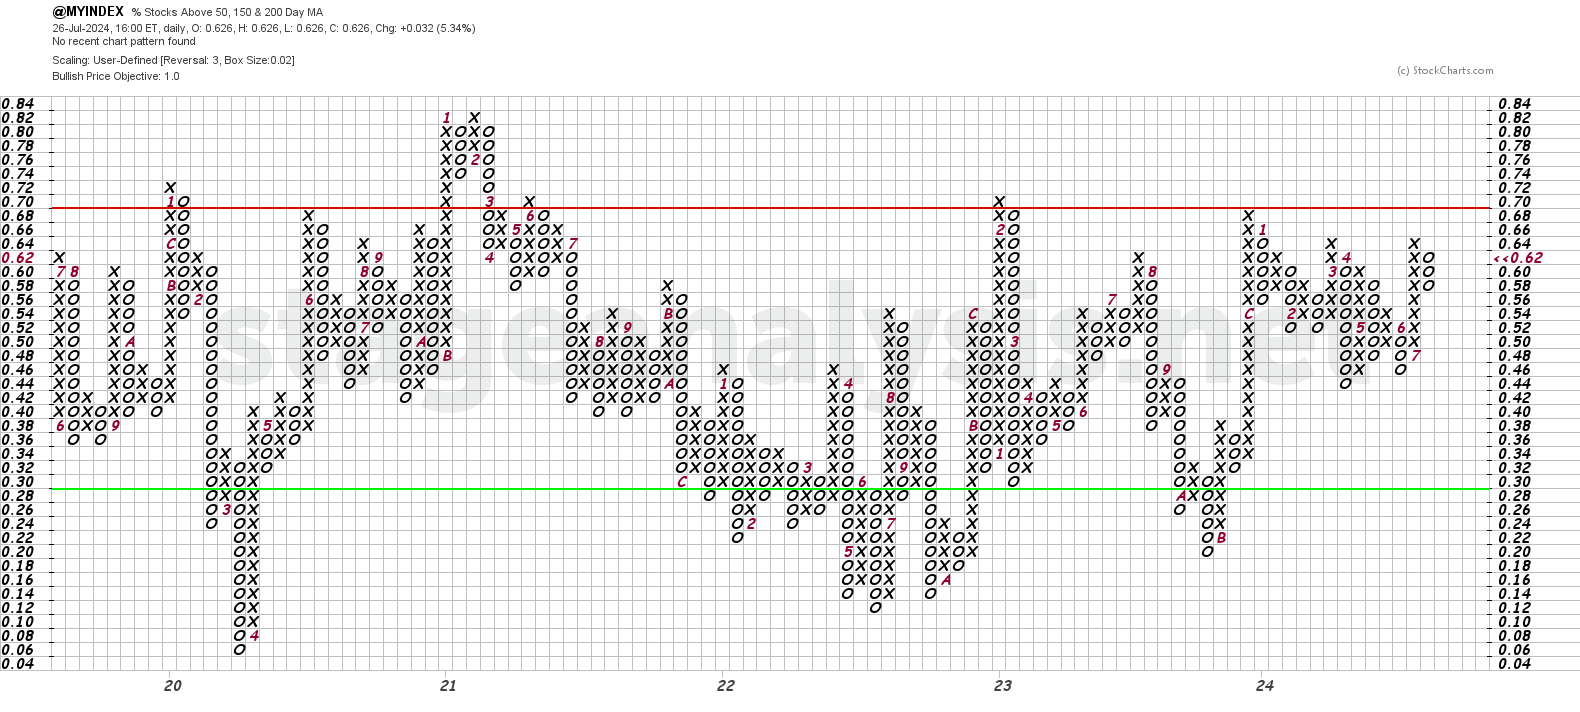
The Point and Figure (P&F) chart (shown above) reversed to a column of Os this week. So the P&F strategy changed to Defense (as it is in a column of Os), and the P&F status changed to Bull Correction status in the upper-middle of the playing field. However, the whipsaw action continues and it closed back near to the highs of the column. So a close above 64% would tip it back to an Offensive posture again.
See the Bullish Percent article for more information on the P&F statuses.
Become a Stage Analysis Member:
To see more like this and other premium content, such as the regular US Stocks watchlist, detailed videos and intraday posts, become a Stage Analysis member.
Join Today
Disclaimer: For educational purpose only. Not investment advice. Seek professional advice from a financial advisor before making any investing decisions.