
US Stocks Industry Groups Relative Strength Rankings
The full post is available to view by members only. For immediate access:
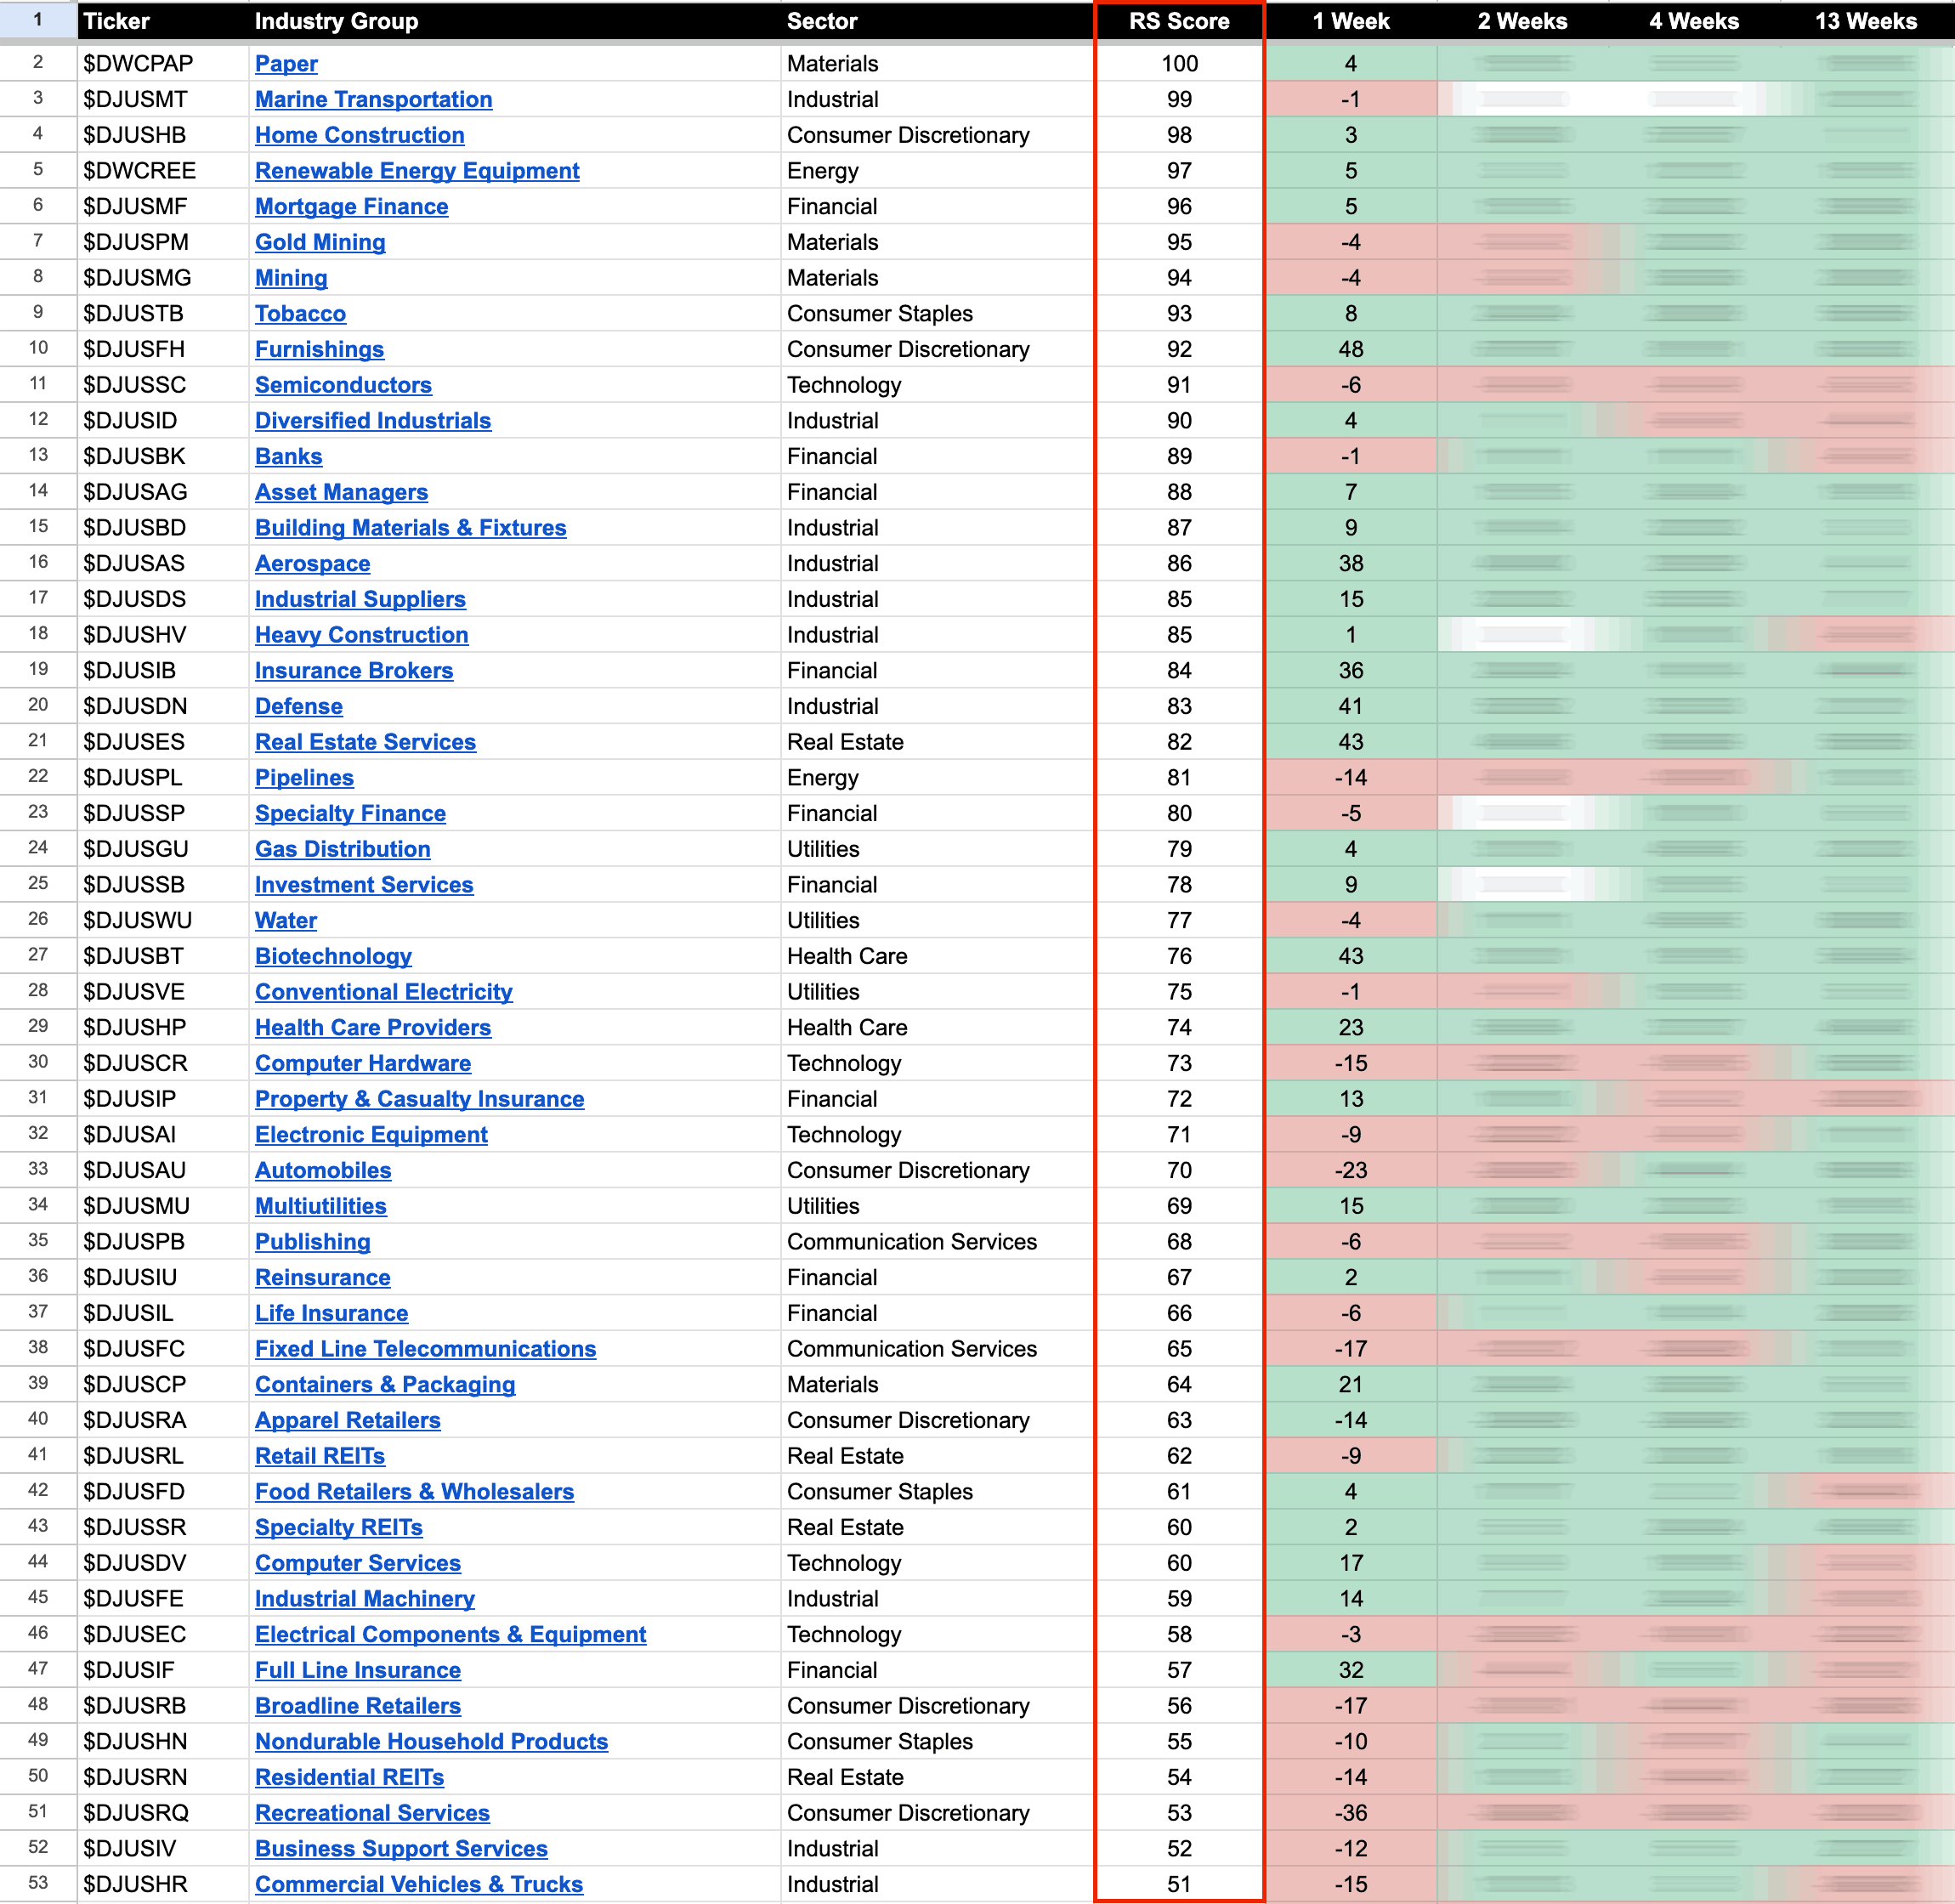
US Industry Groups by Highest RS Score
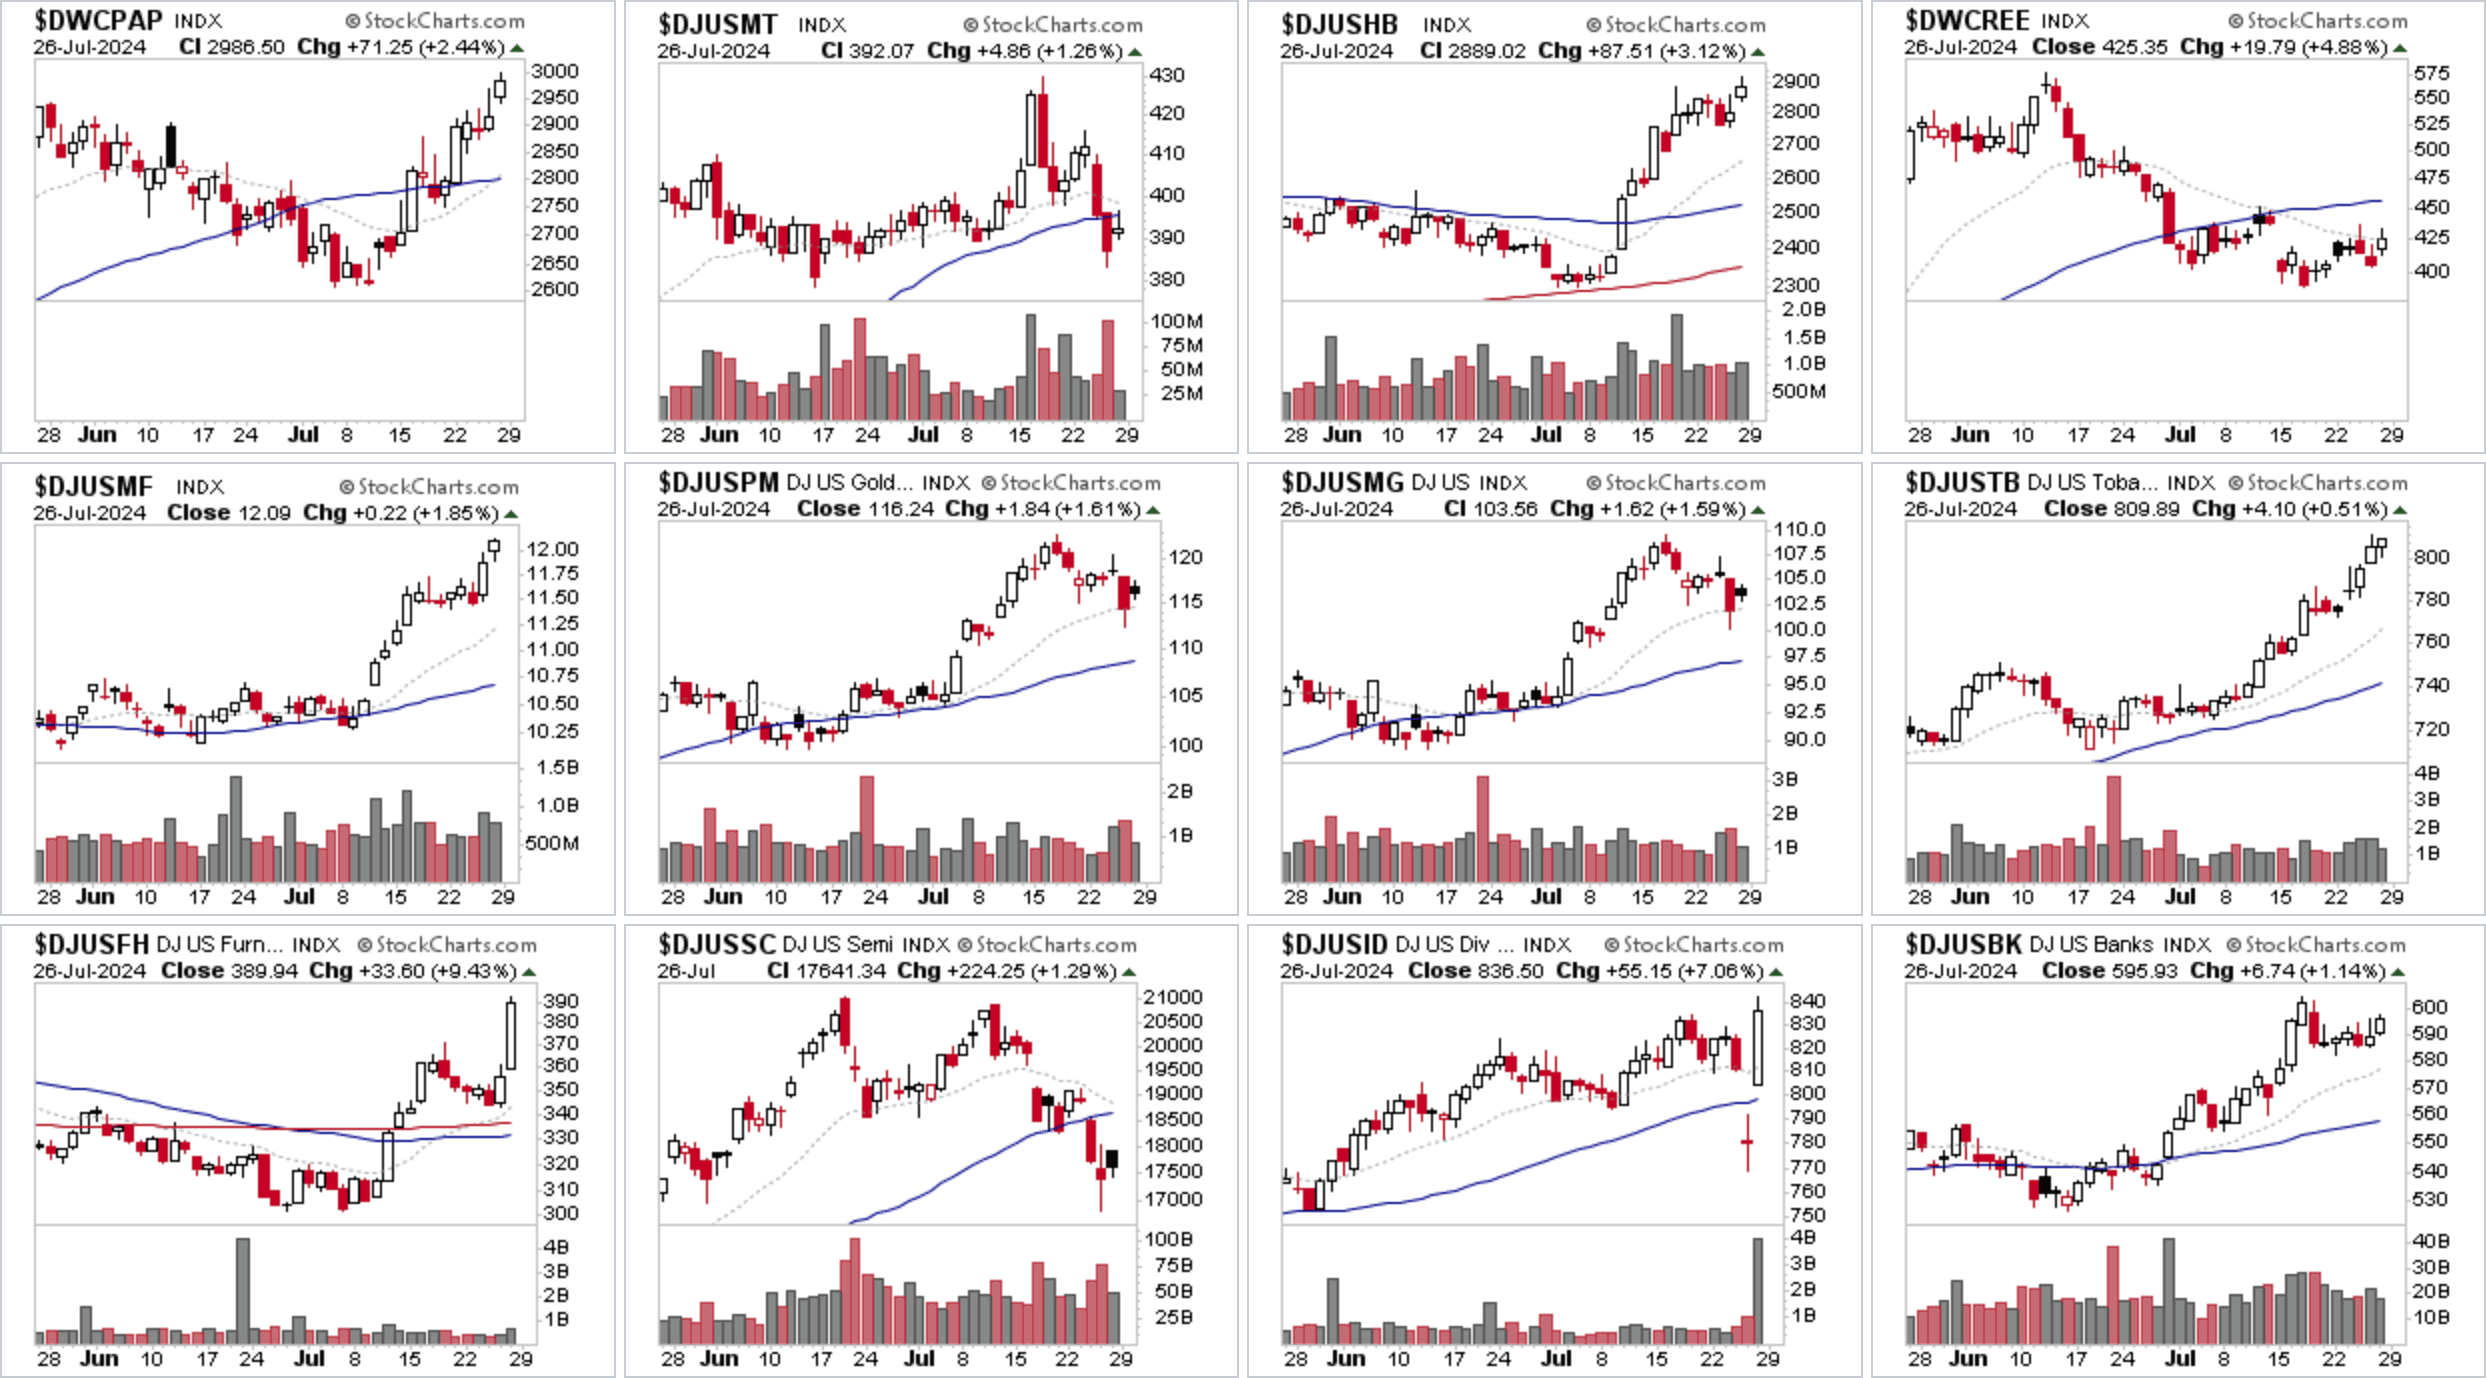
Lots of changes this week in the Industry Groups Relative Strength (RS) Rankings, with Homebuilding stocks continuing to rise up the RS rankings, with the majority of Homebuilding stocks now reaching very strong SATA scores of 9 and 10, and remains a leading theme in the near term as earnings season picks up steam.
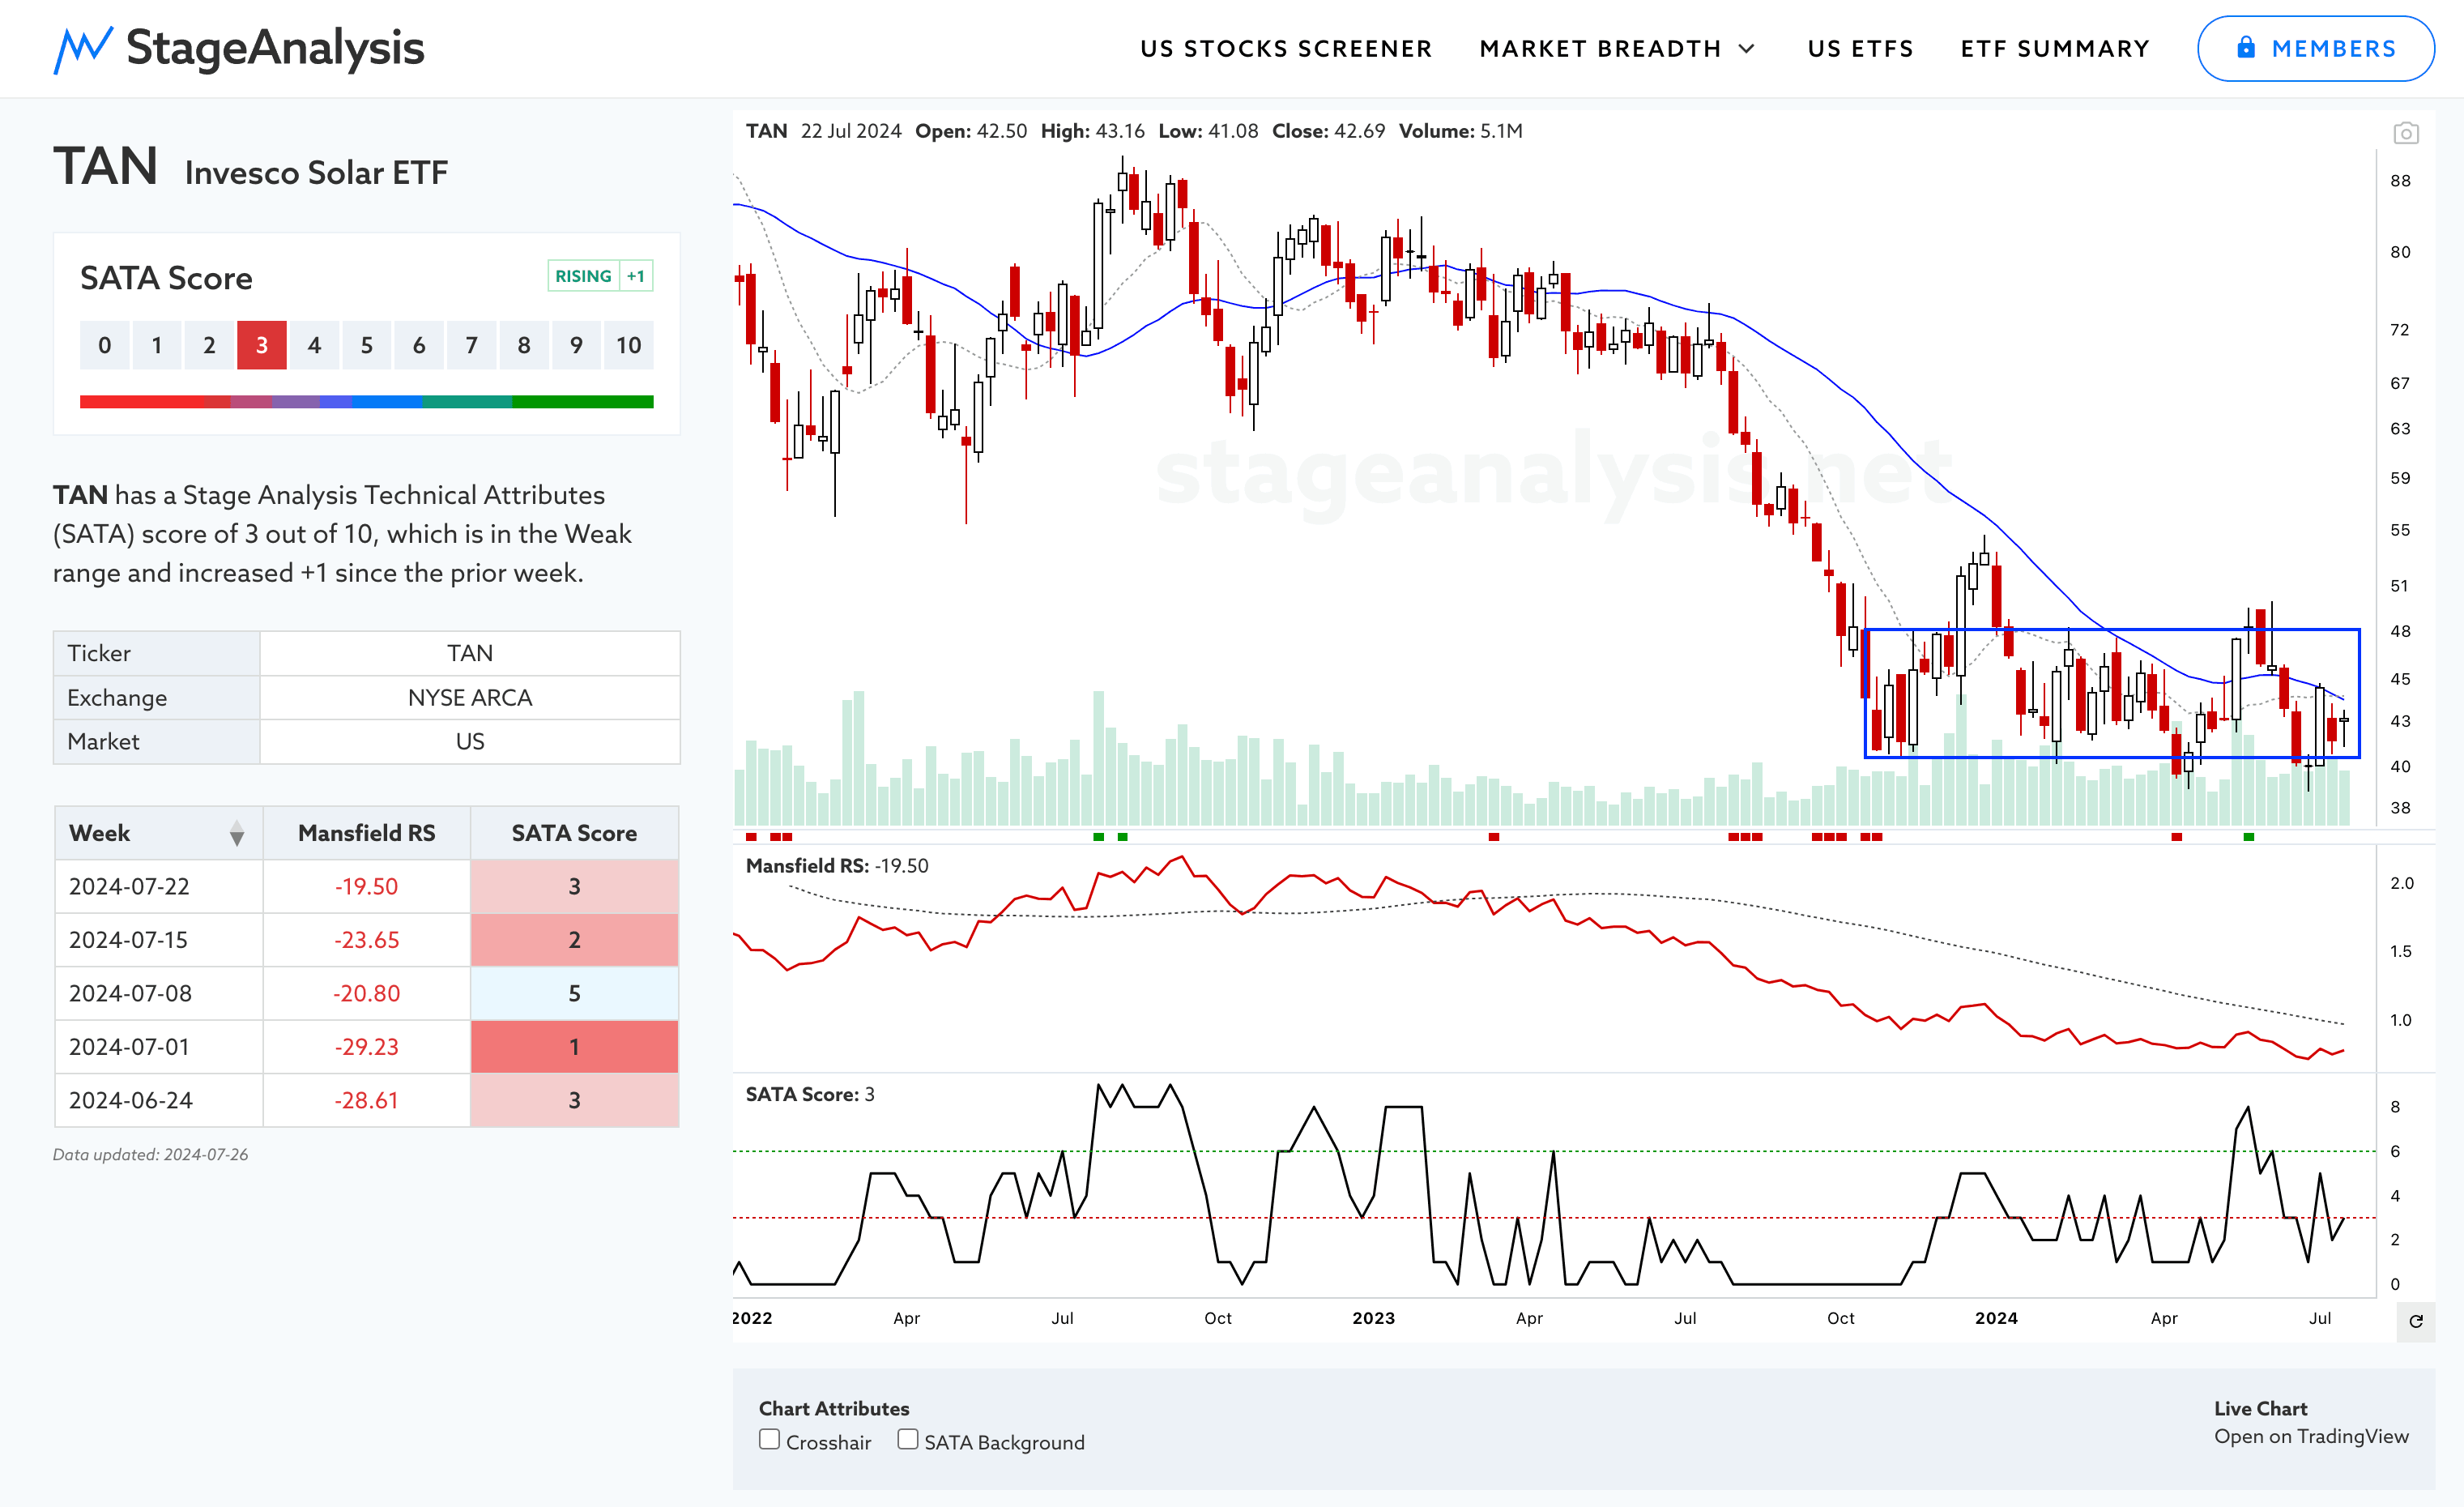
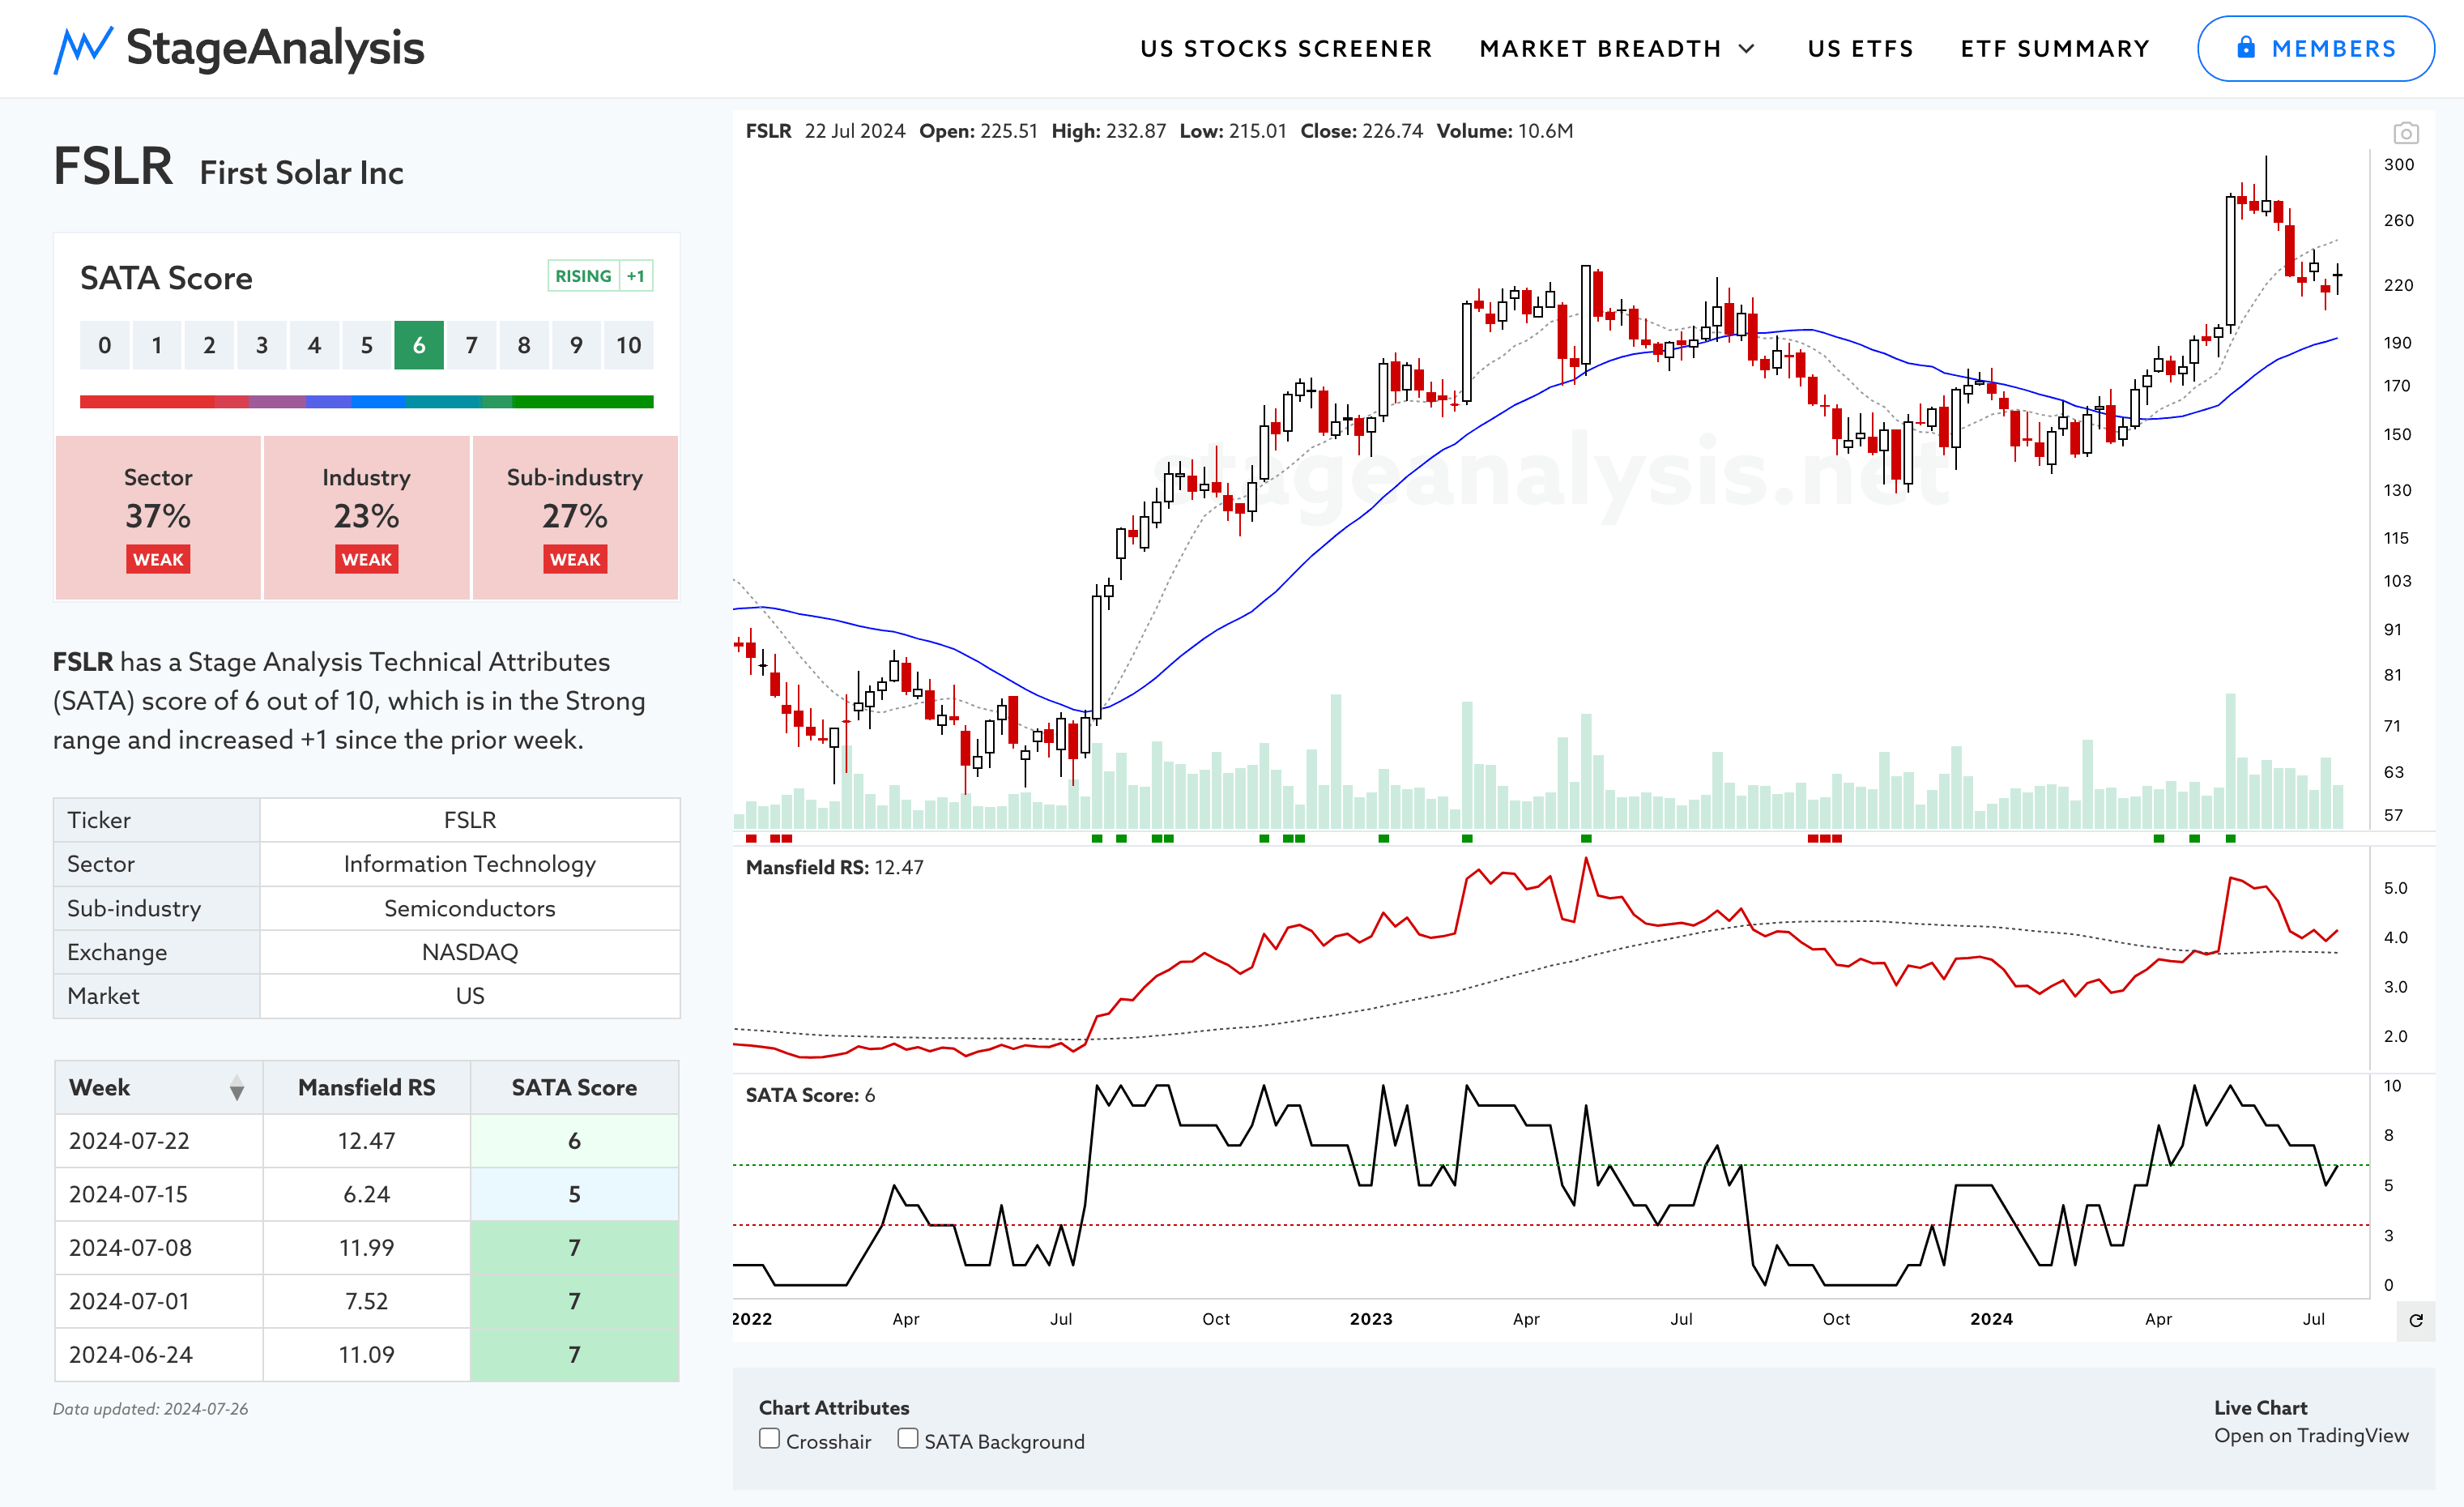
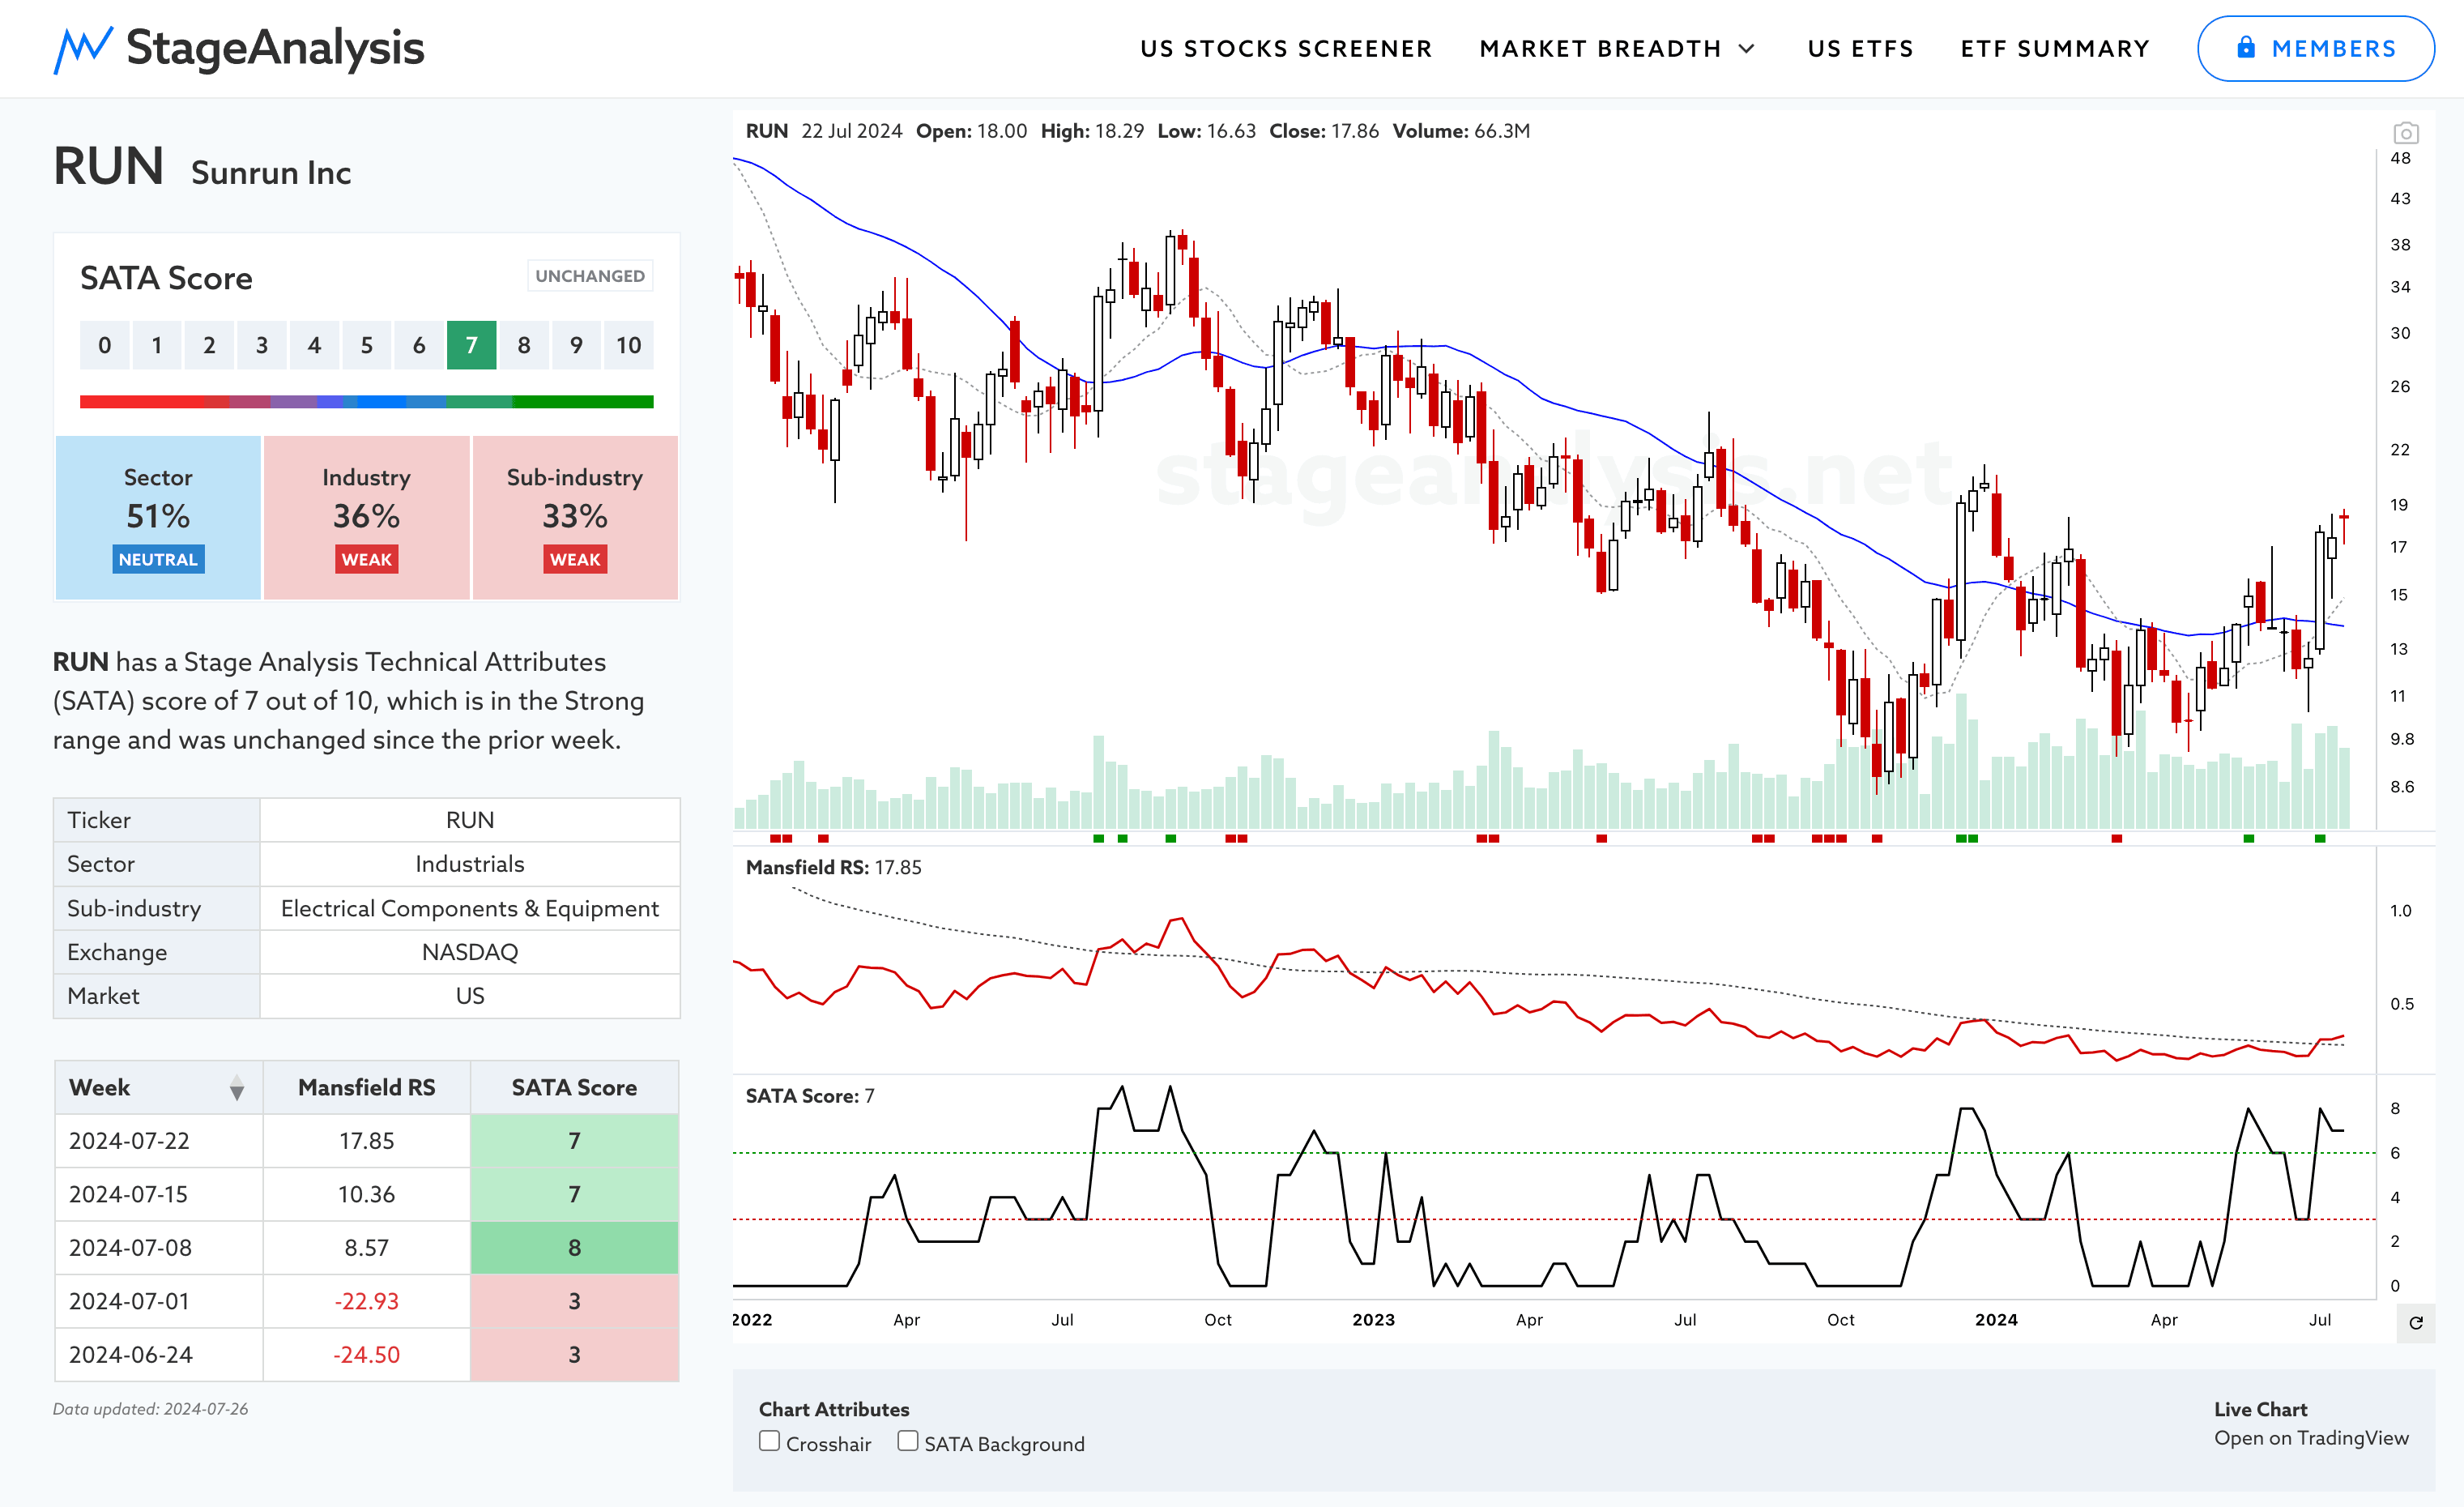
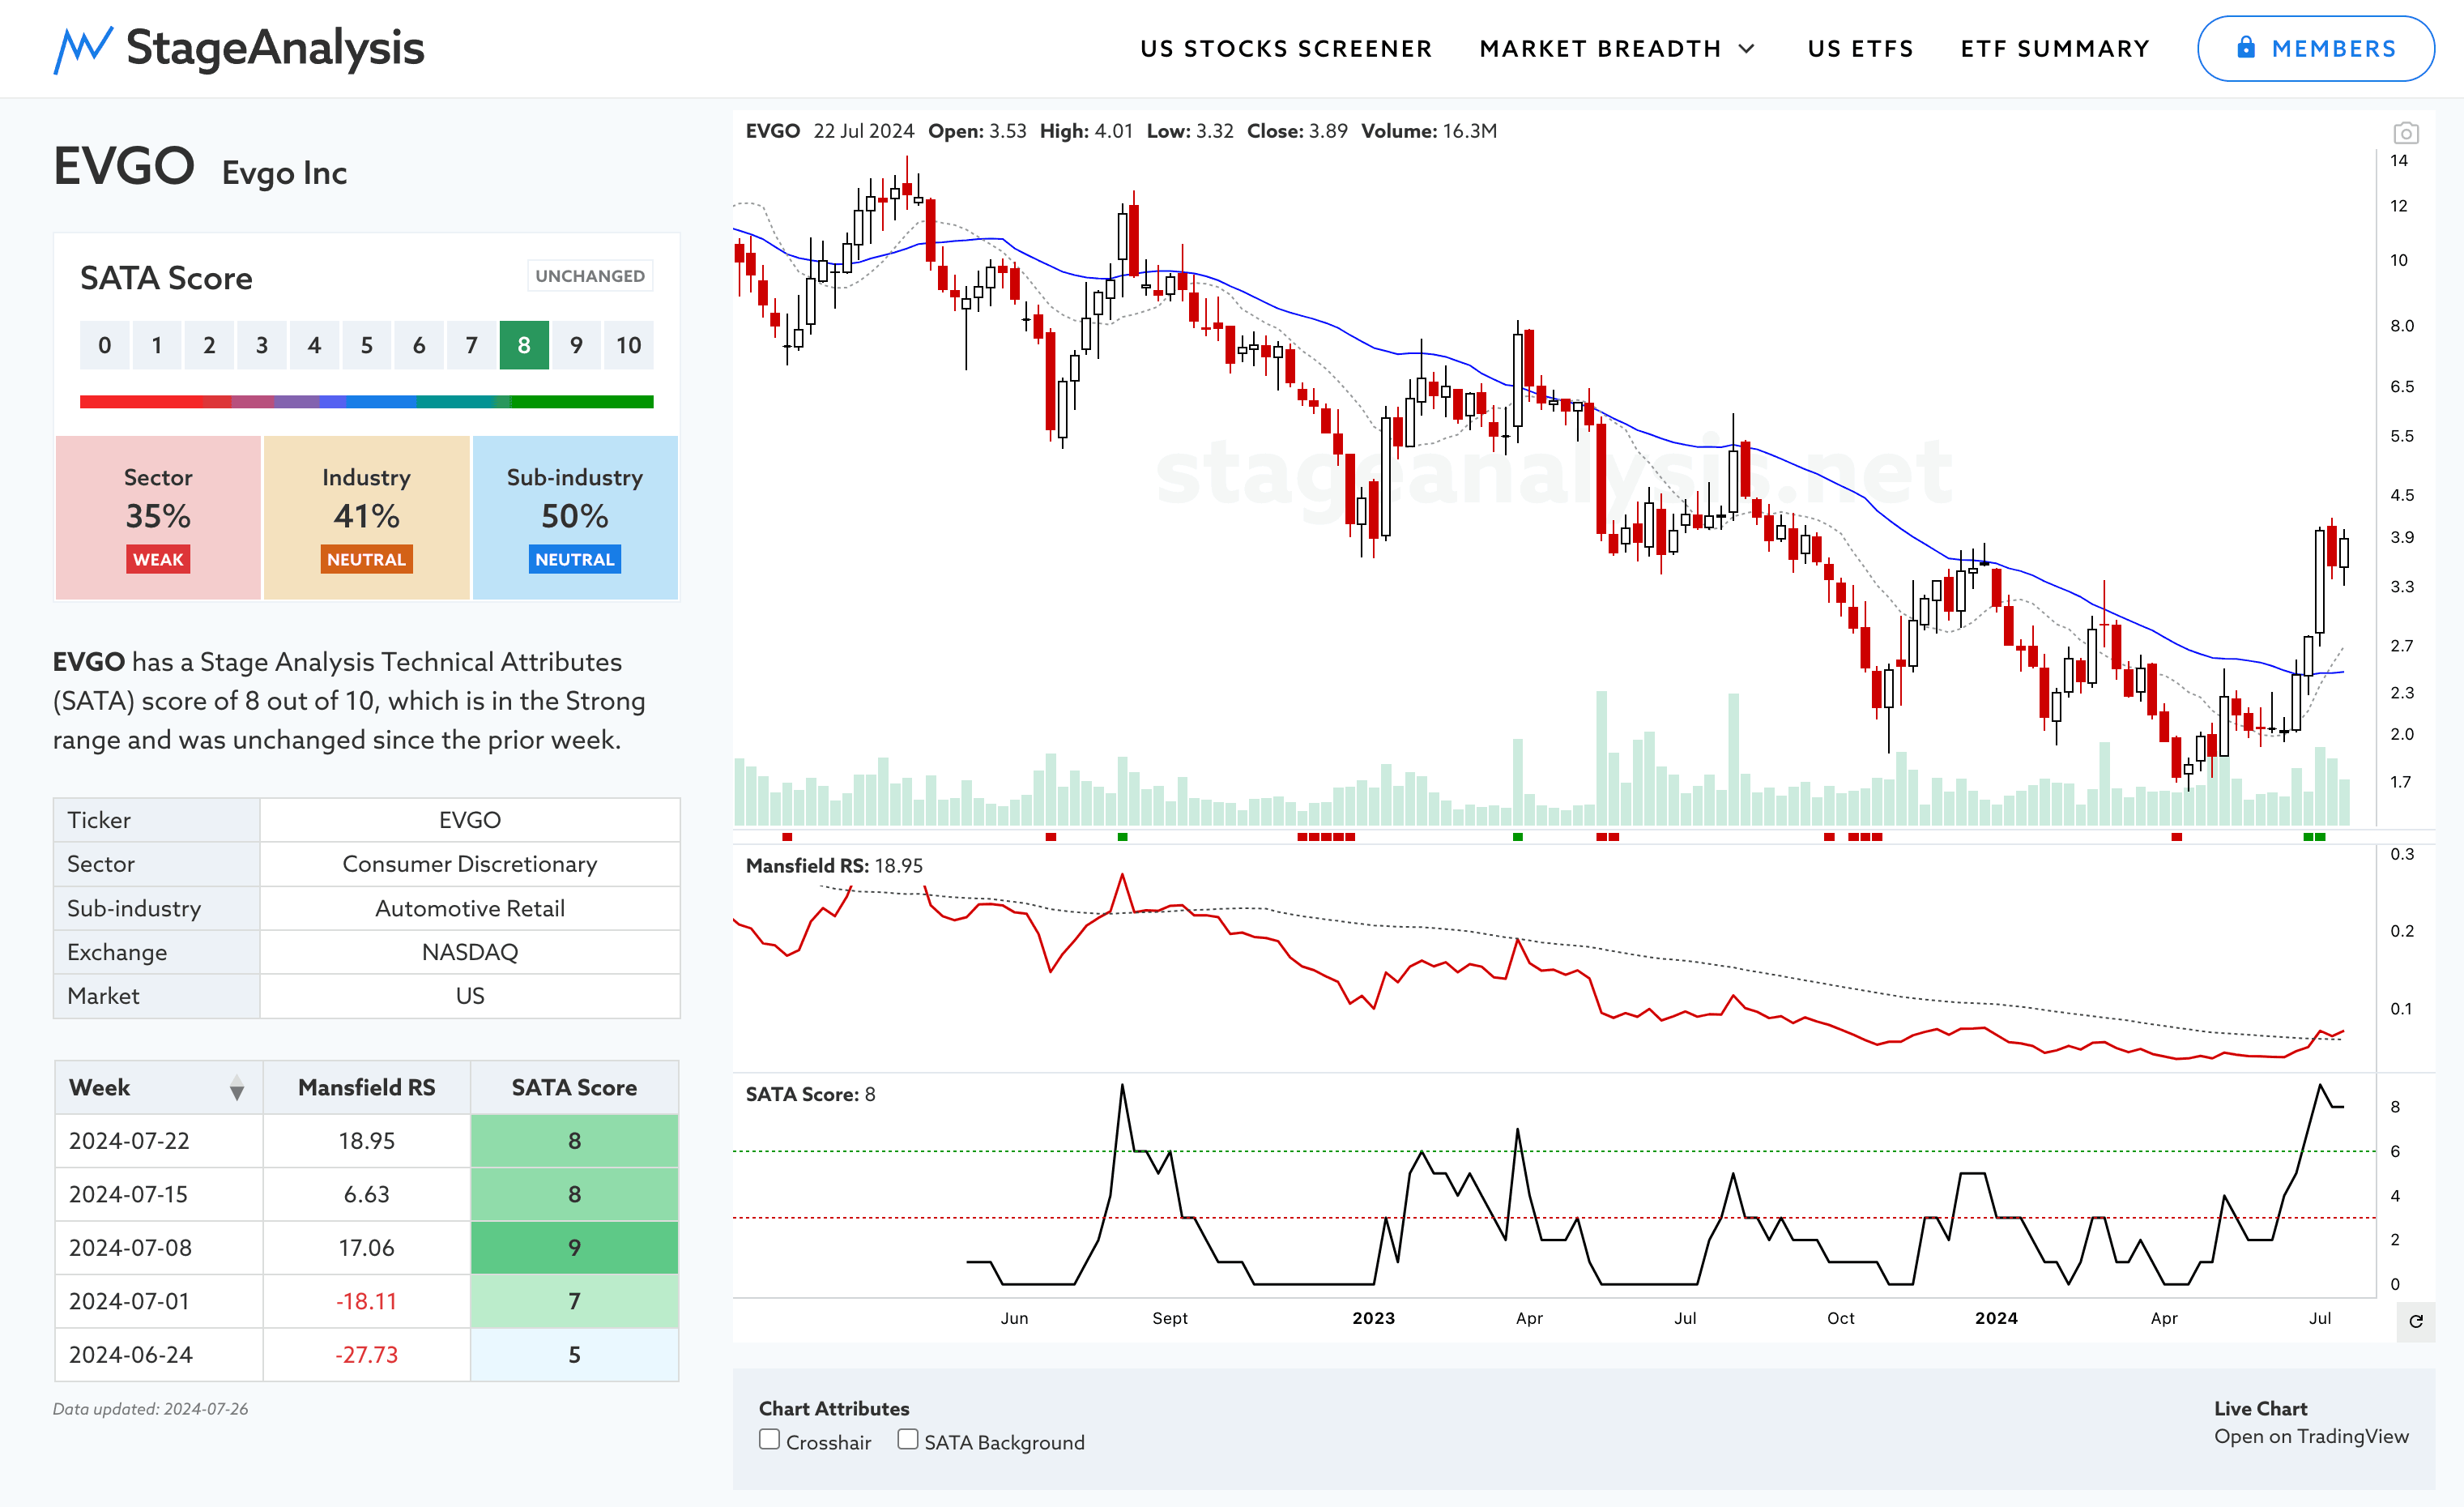
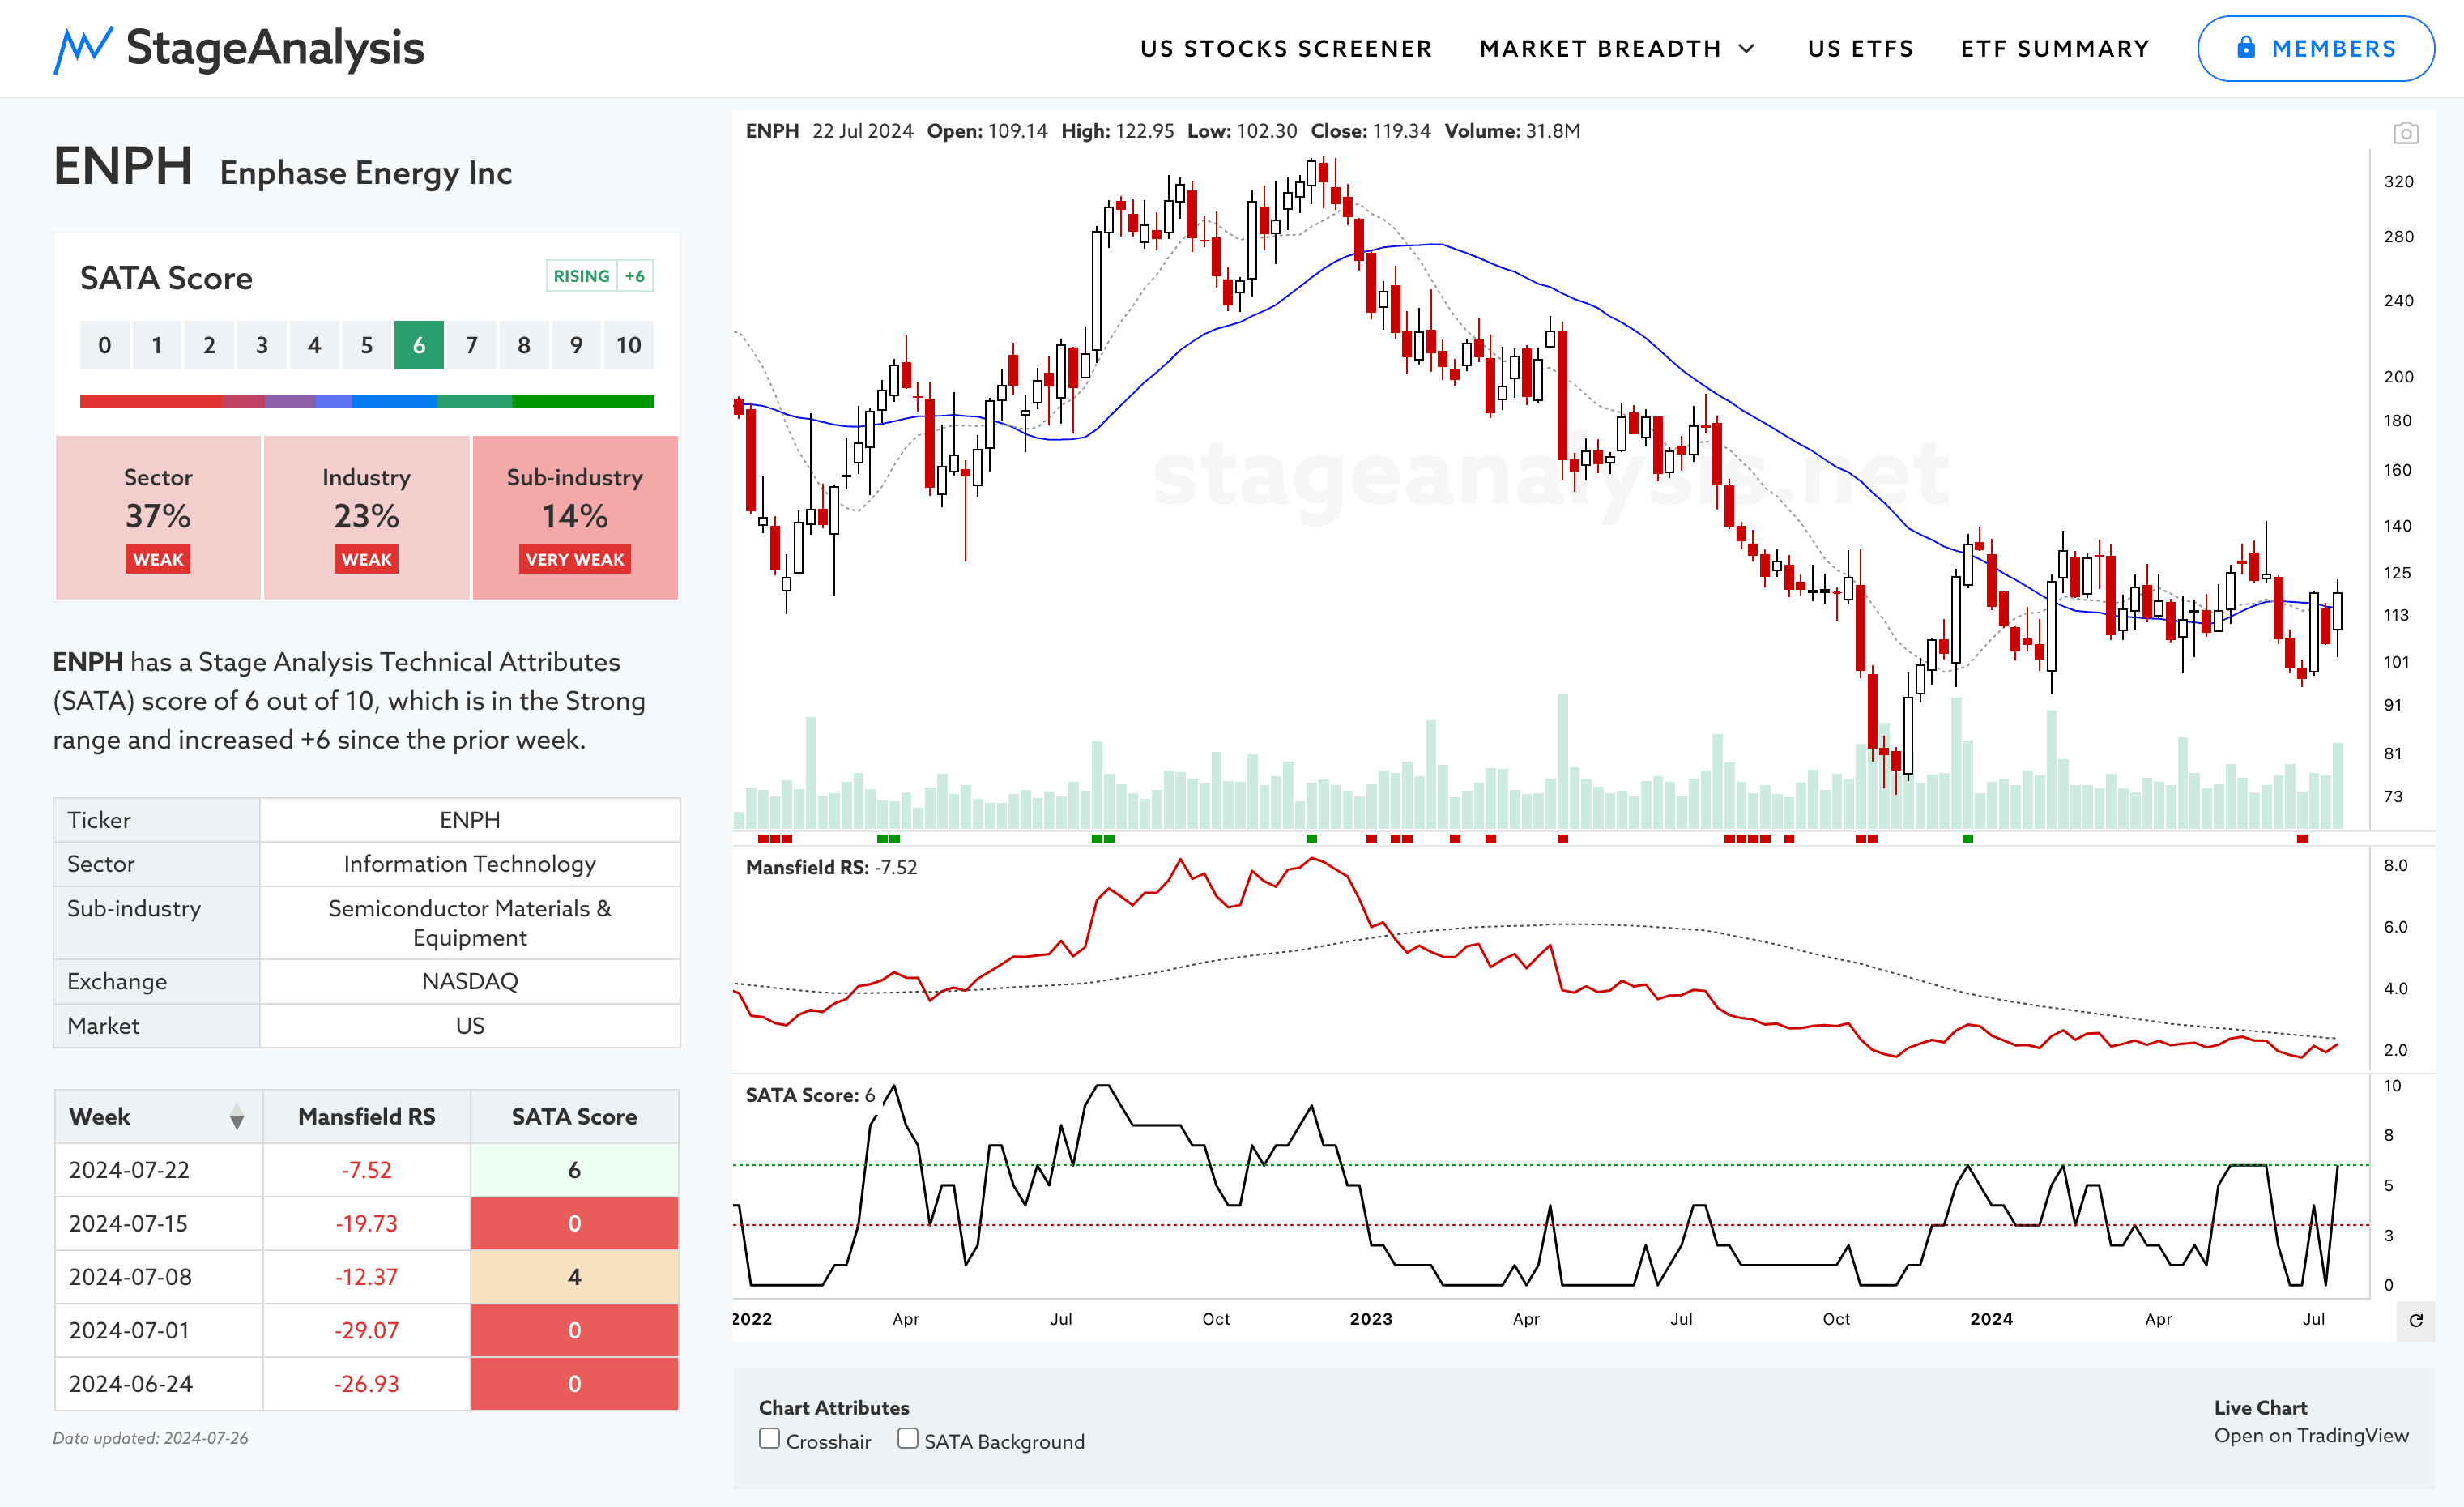
Another area that I discussed multiple times during early 2024, is the Renewable Energy Equipment group, which doesn't have a defined group in the GICS data. But it comprises of the Solar, Wind, Hydrogen and other renewables, but with a heavy weighting in Solar stocks. So the group can be kept track of via the TAN etf, which has been basing in Stage 1 for most of the year, and by tracking the various individual stocks that are leading the group, such as: FSLR (Stage 2), RUN (early Stage 2), EVGO (early Stage 2) and ENPH (Stage 1). The majority of the group are still languishing in Stage 4 declines, but of note in TAN and ENPH also, is the recent Spring and Test patterns that may indicate potential Wyckoff Phase C of the base structure/s. So they now need to see follow through above the recent pivots to give more confidence of that.
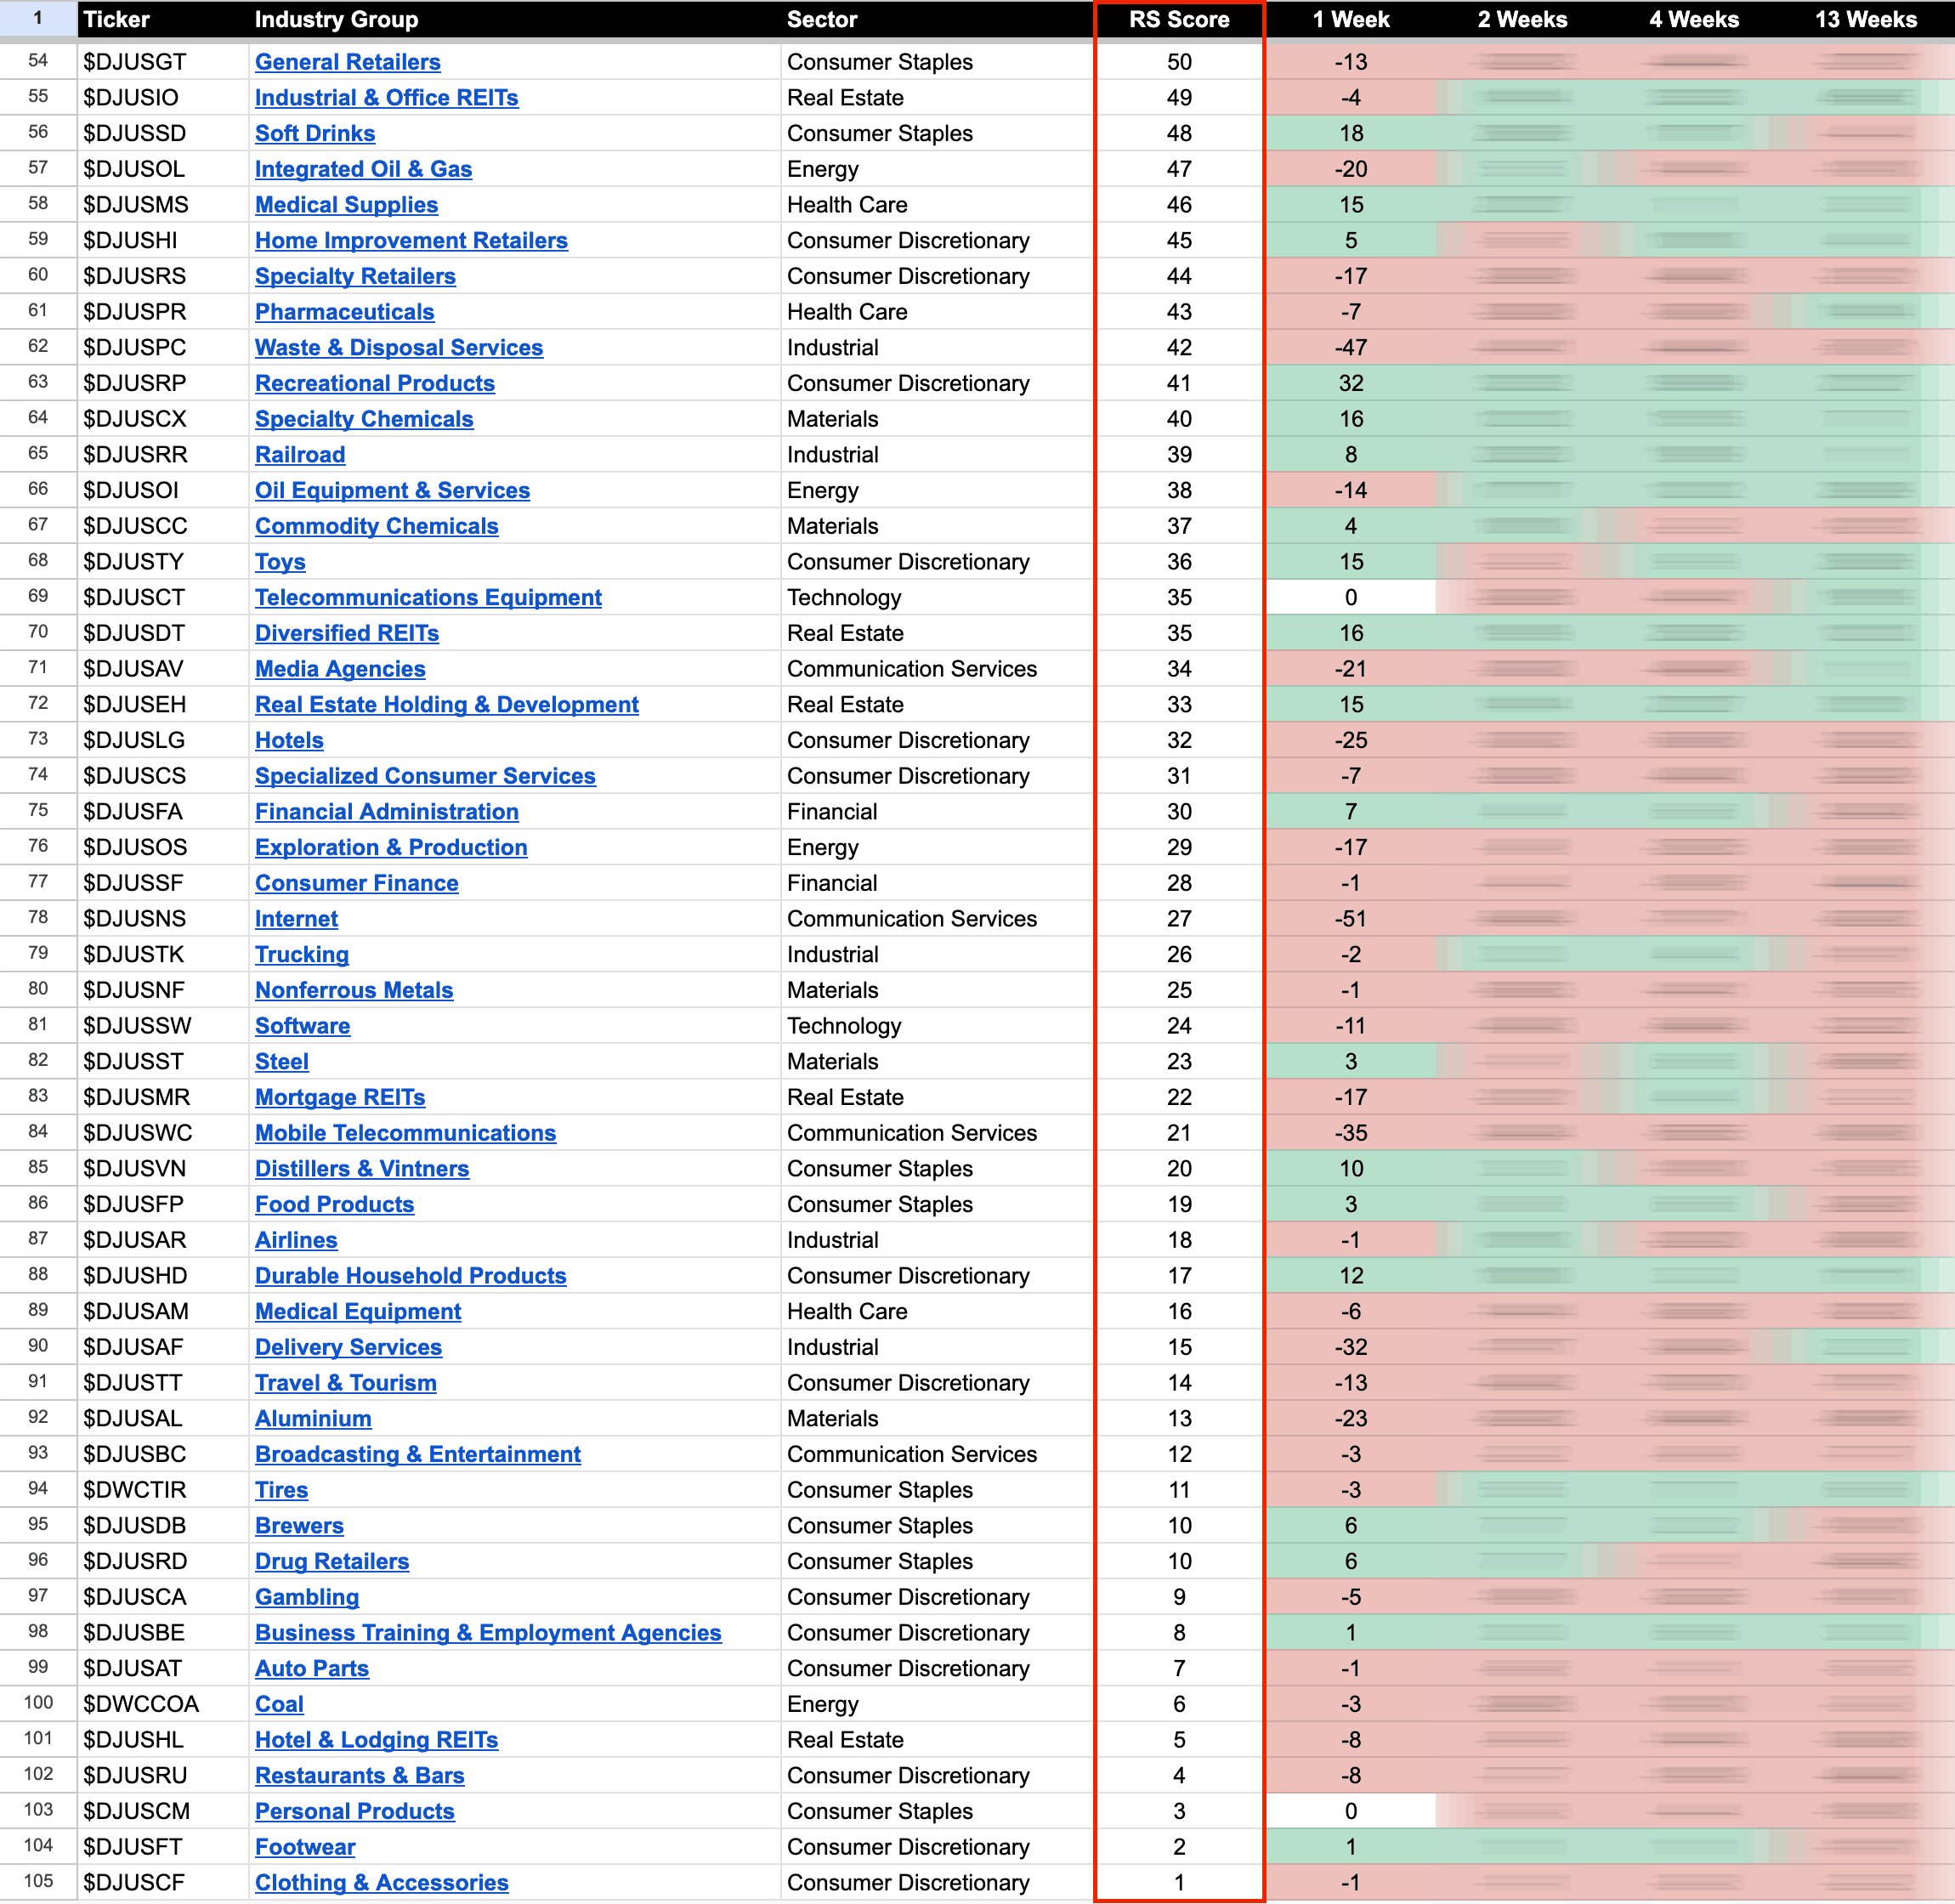
US Industry Groups by Weakest RS Score
US Industry Groups sorted by Relative Strength
The purpose of the Relative Strength (RS) tables is to track the short, medium and long-term RS changes of the individual groups to find the new leadership earlier than the crowd.
RS Score of 100 is the strongest, and 0 is the weakest.
In the Stage Analysis method we are looking to focus on the strongest groups, as what is strong, tends to stay strong for a long time. But we also want to find the improving / up and coming groups that are starting to rise up strongly through the RS table from the lower zone, in order to find the future leading stocks before they break out from a Stage 1 base and move into a Stage 2 advancing phase.
Each week I go through the most interesting groups on the move in more detail during the Stage Analysis Members weekend video – as Industry Group analysis is a key part of Stan Weinstein's Stage Analysis method.
There are now multiple ways on the Stage Analysis website to view individual groups and sectors via the GICS Sub-industries (123), Industries (74) and Groups (25) pages and the new US Stocks Screener, in which you can easily filter via the Sectors and Sub-industries to see the component stocks and their current SATA and Mansfield RS data.
Note: The GICS Sub-industries, Industries and Groups are different to the DJ US Industry Groups used in this post, which I'm gradually retiring as the new Stage Analysis tools are developed, and will be moving this post over to use the GICS Industries or Sub-Industries data in the coming months.
Become a Stage Analysis Member:
To see more like this – US Stocks watchlist posts, detailed videos each weekend, use our unique Stage Analysis tools, such as the US Stocks & ETFs Screener, Charts, Market Breadth, Group Relative Strength and more...
Join Today
Disclaimer: For educational purpose only. Not investment advice. Seek professional advice from a financial advisor before making any investing decisions.