
US Stocks Industry Groups Relative Strength Rankings
The full post is available to view by members only. For immediate access:
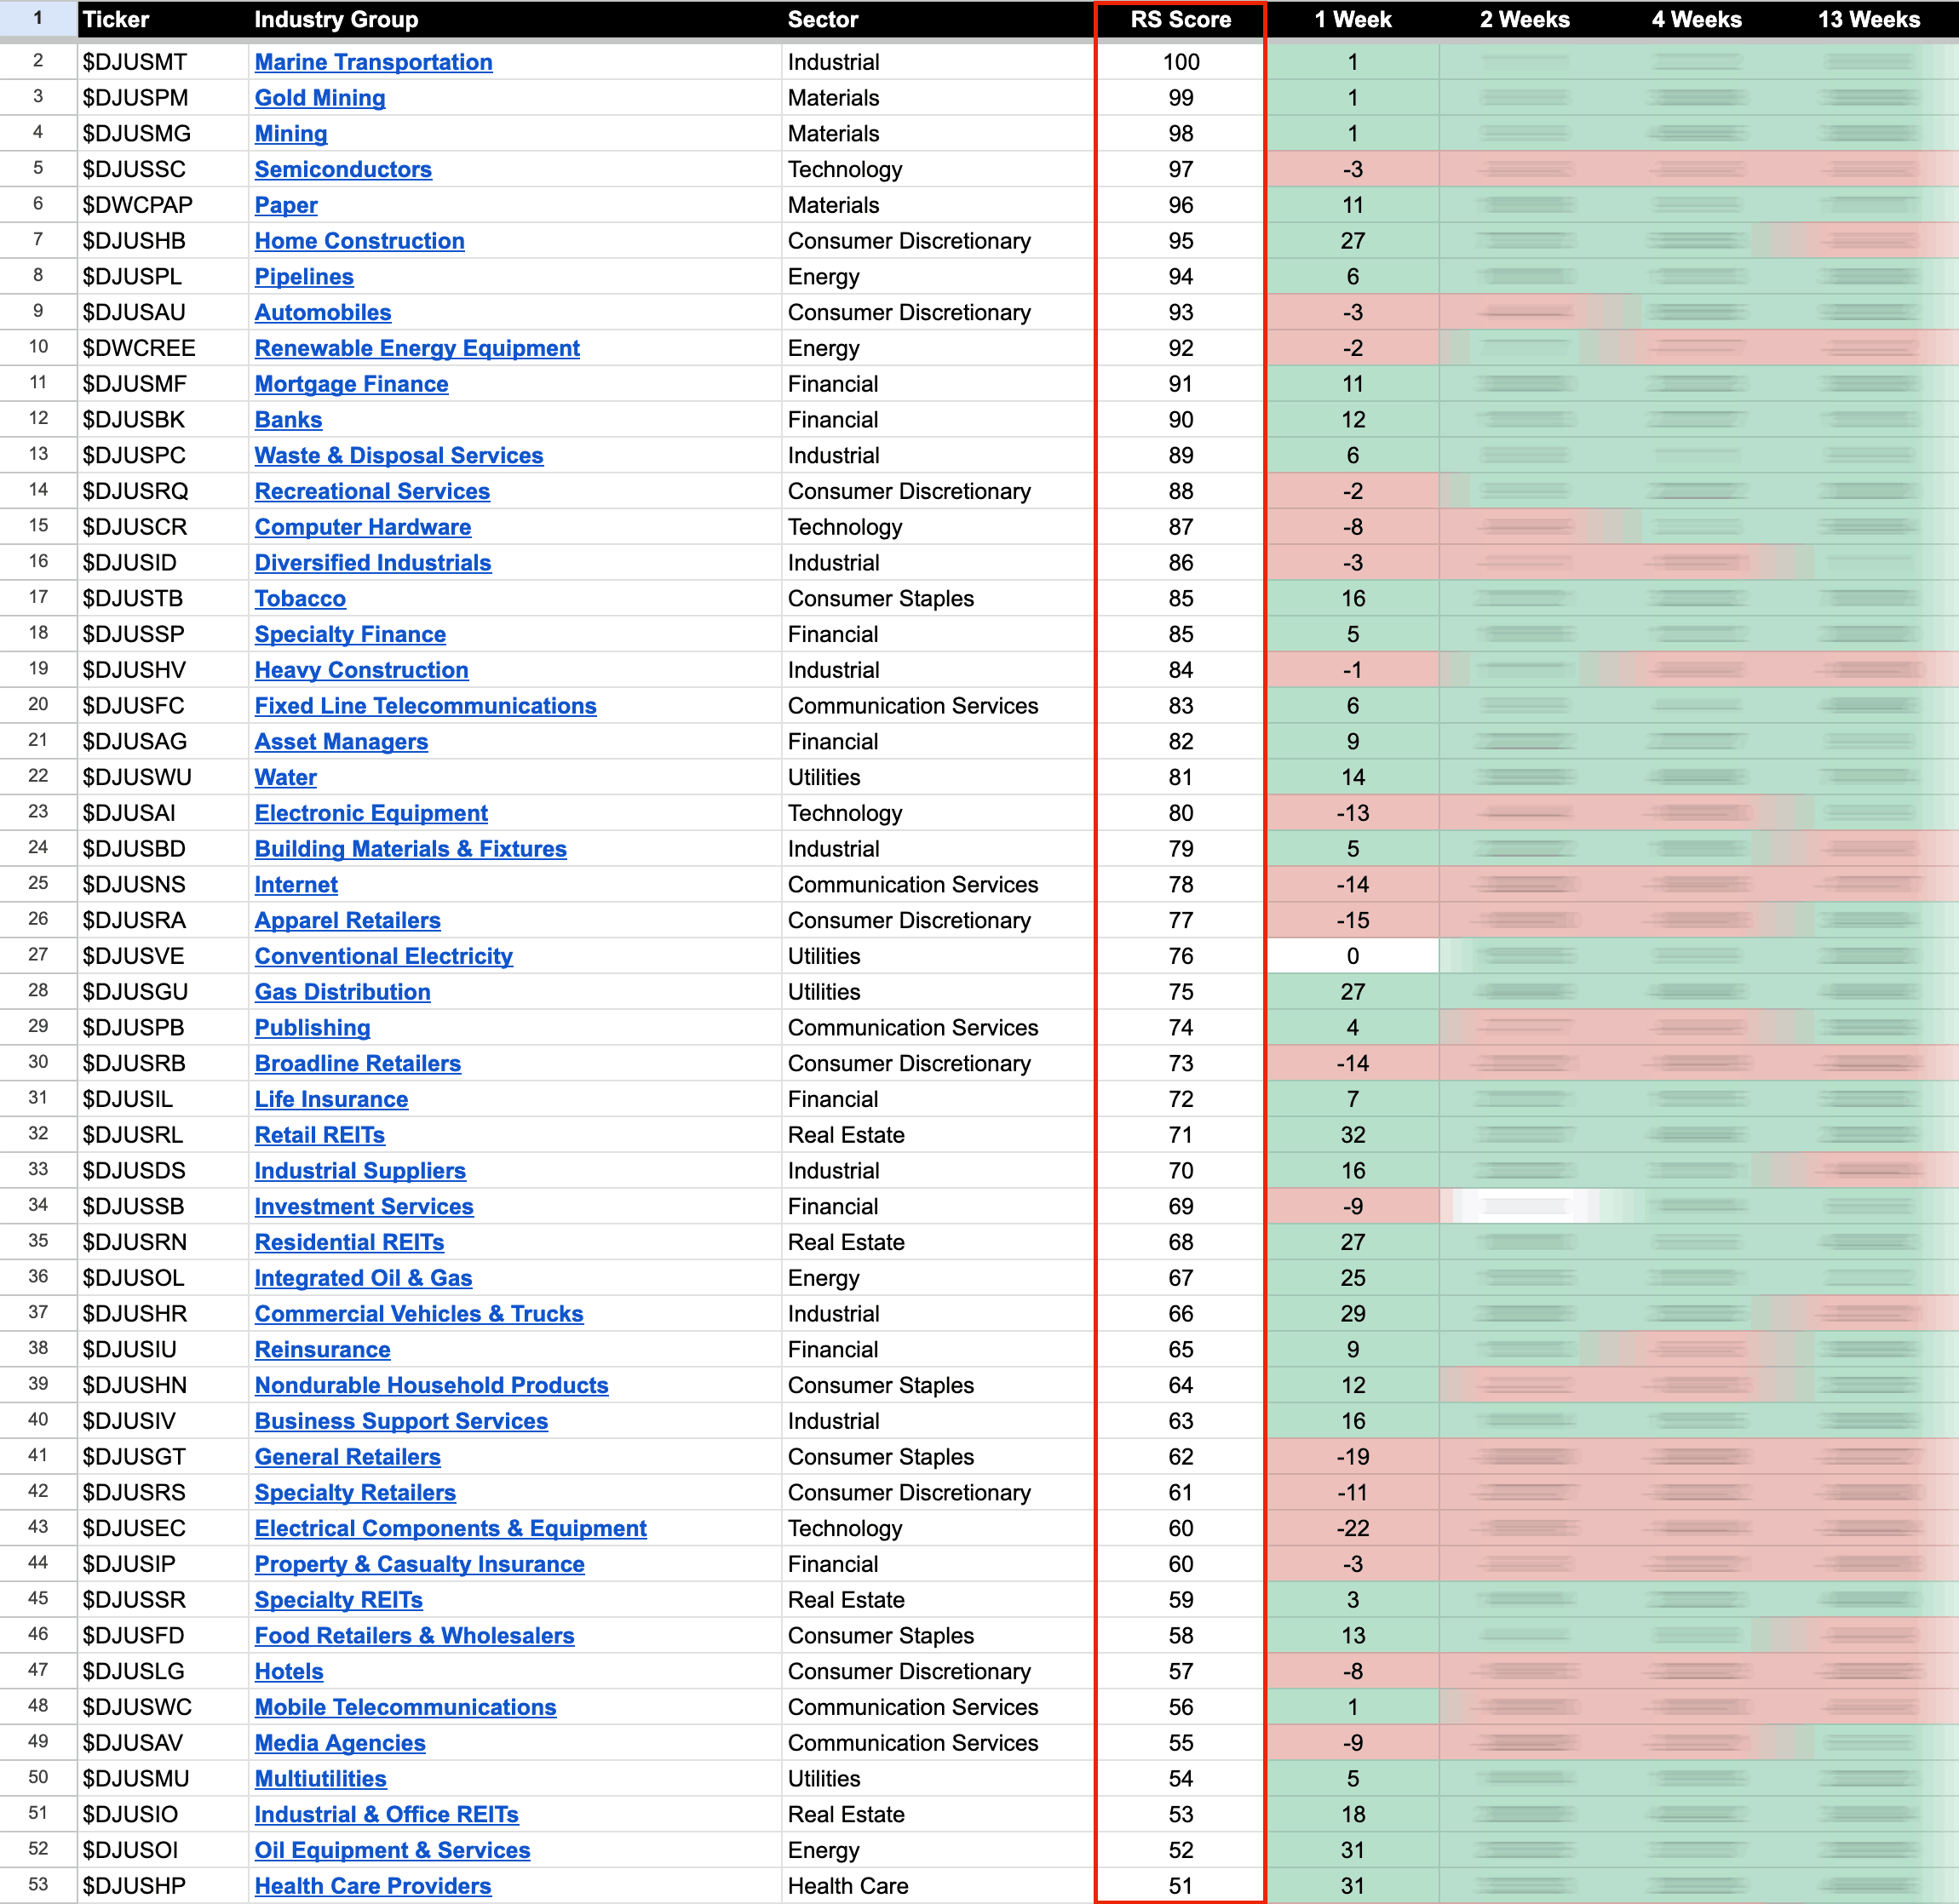
US Industry Groups by Highest RS Score
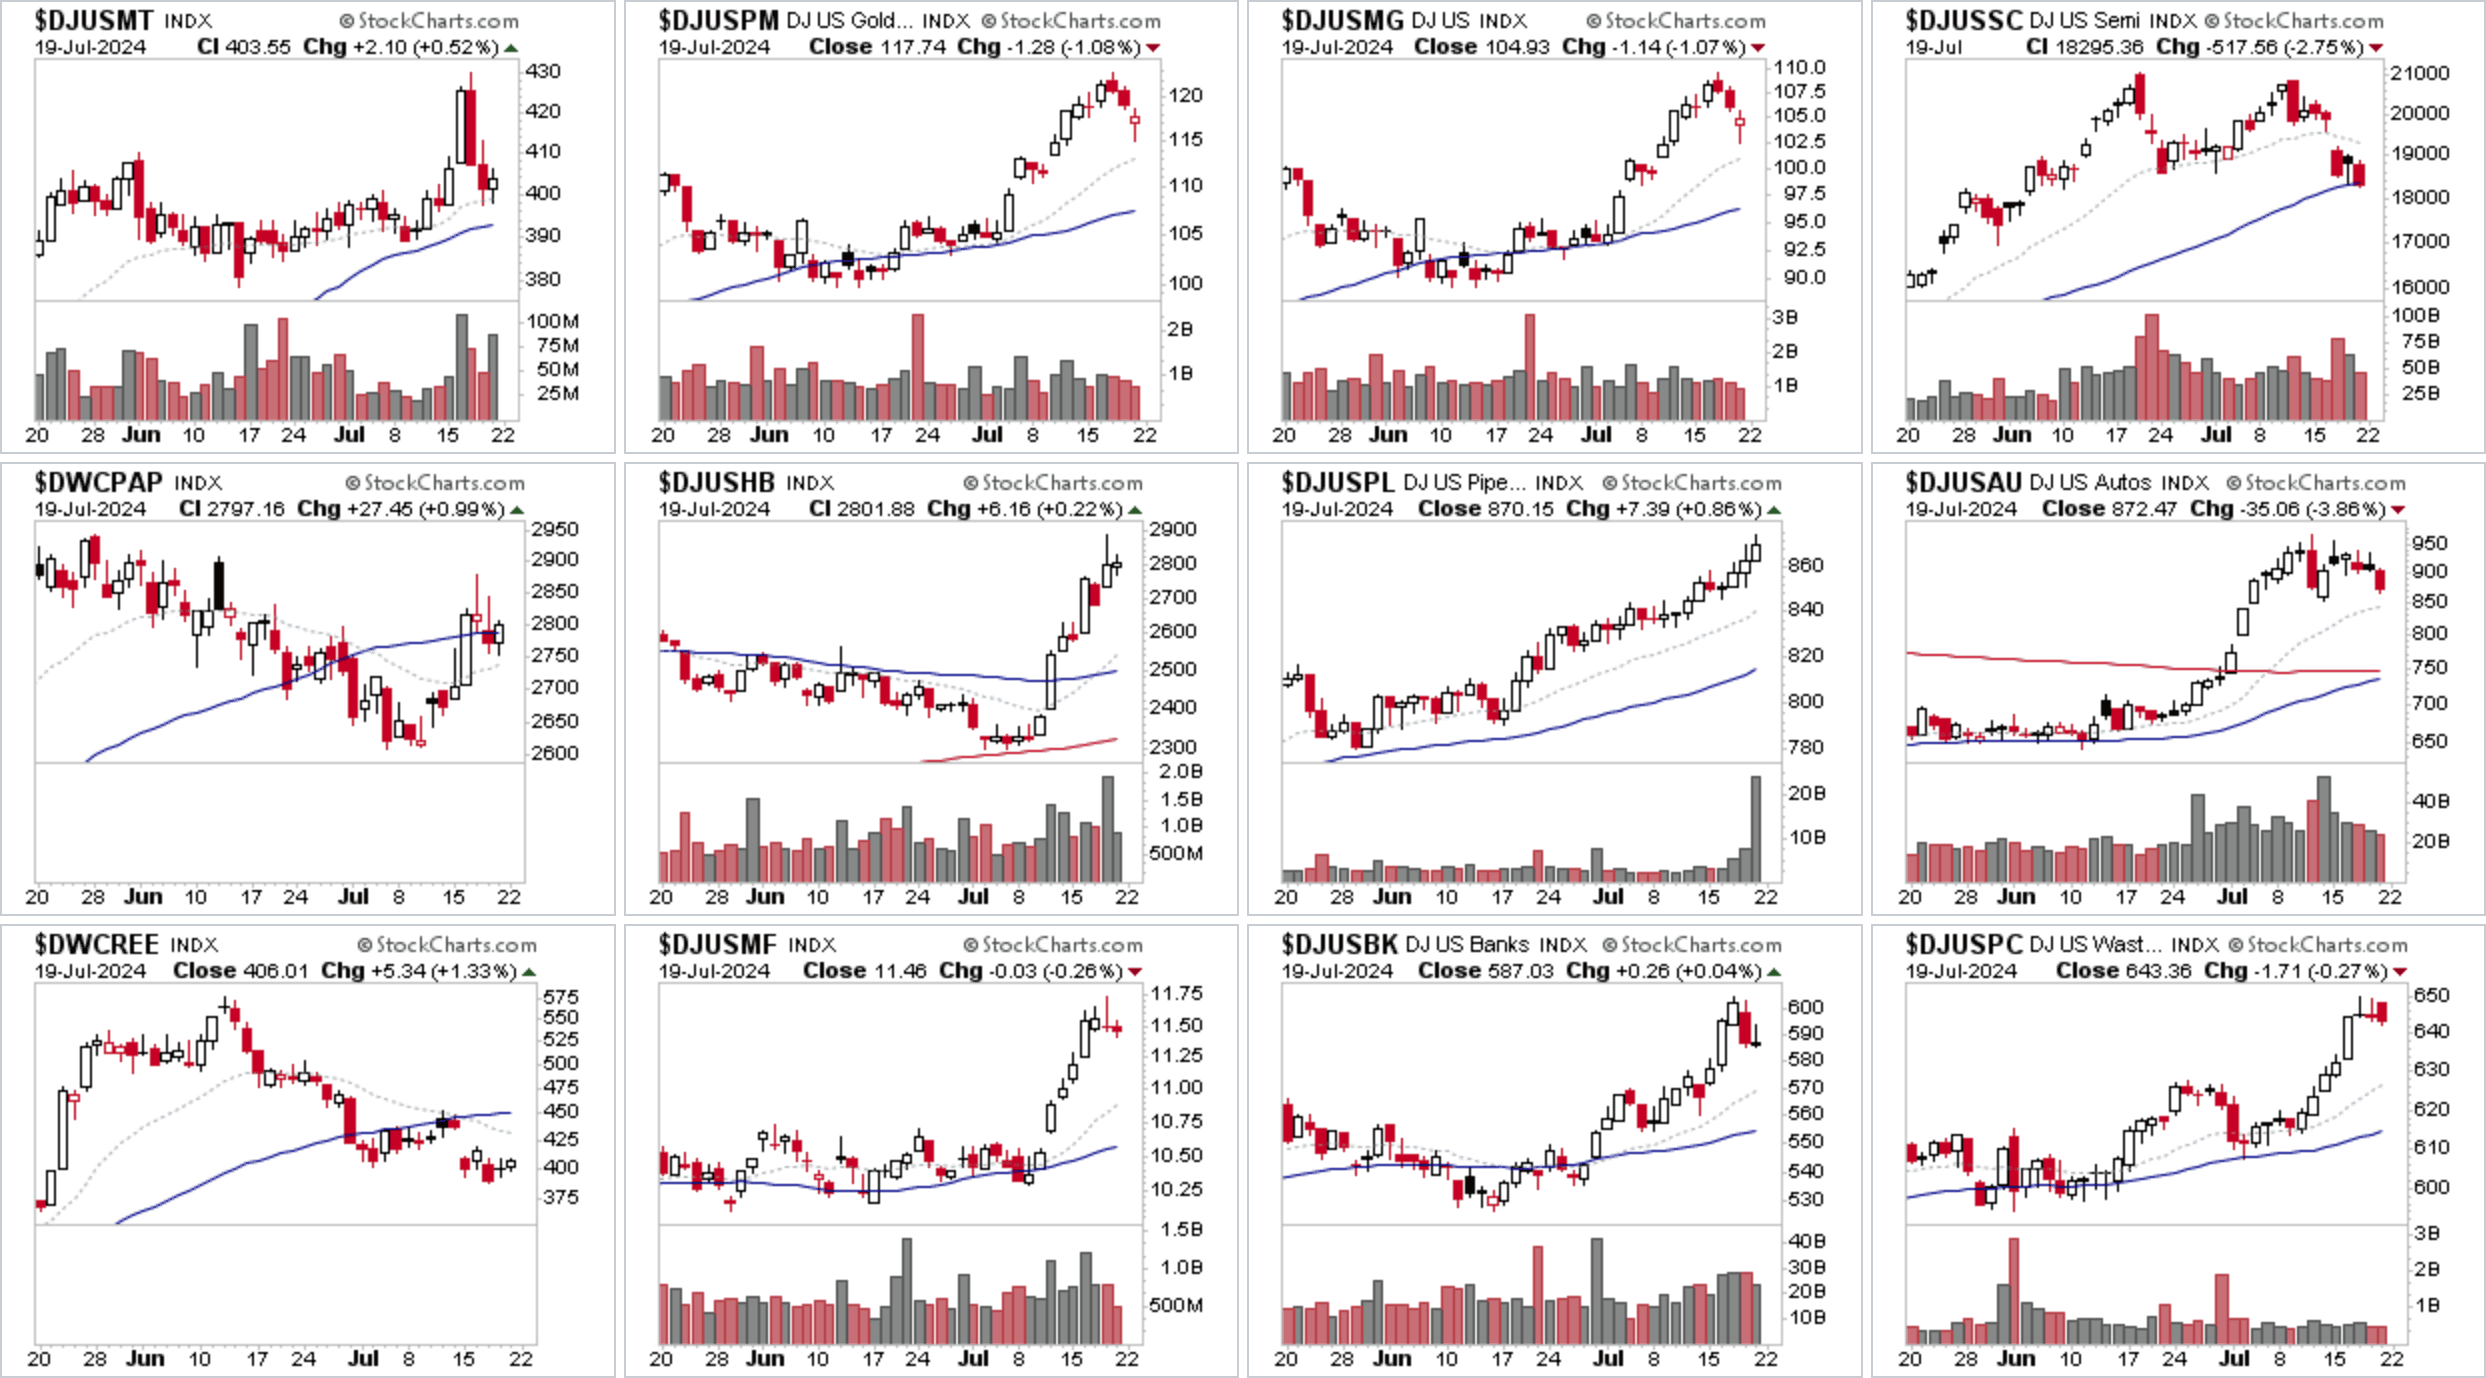
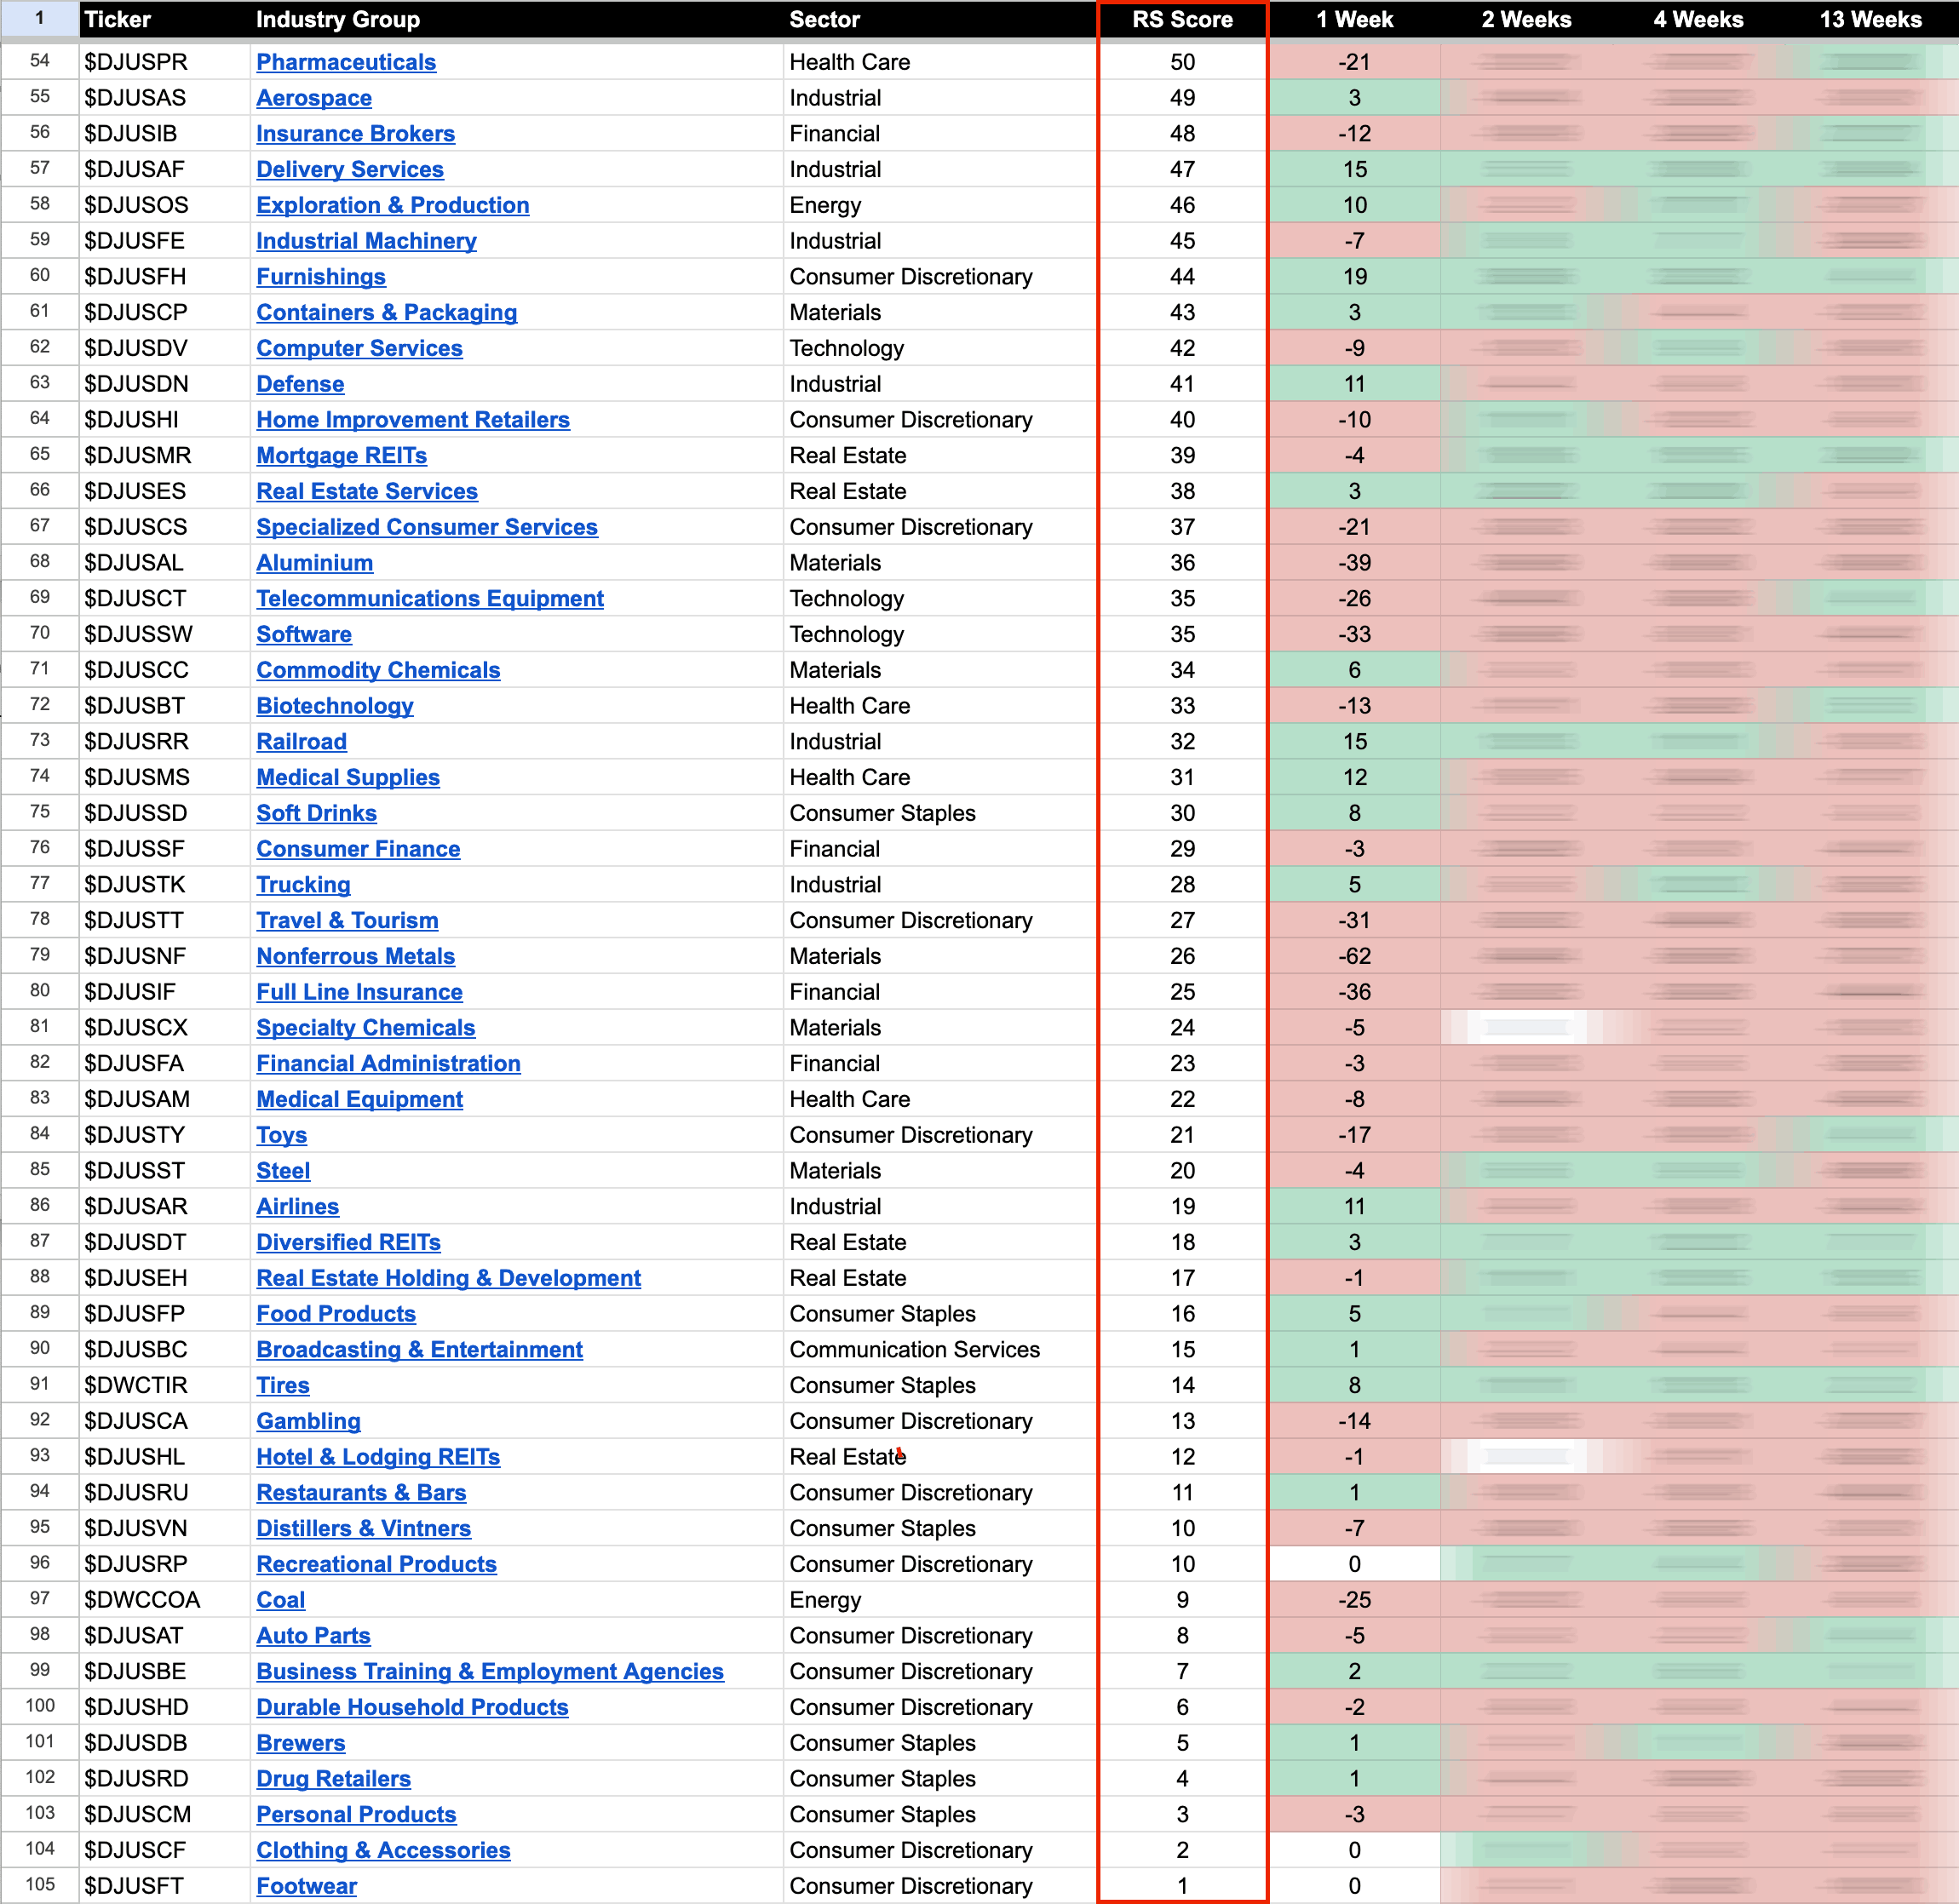
Financials and Real Estate groups saw the majority of the RS gains this week, as others areas such as Technology, Consumer Discretionary and Materials groups got hit hard. Semiconductors dropped from the top spot into 4th place with a heavy -8.80% decline for the week, and Non-Ferrous Metals (Copper, Silver stocks etc) had the largest percentage decline at -10.49%, which dropped it down -3 RS places to 13th overall.
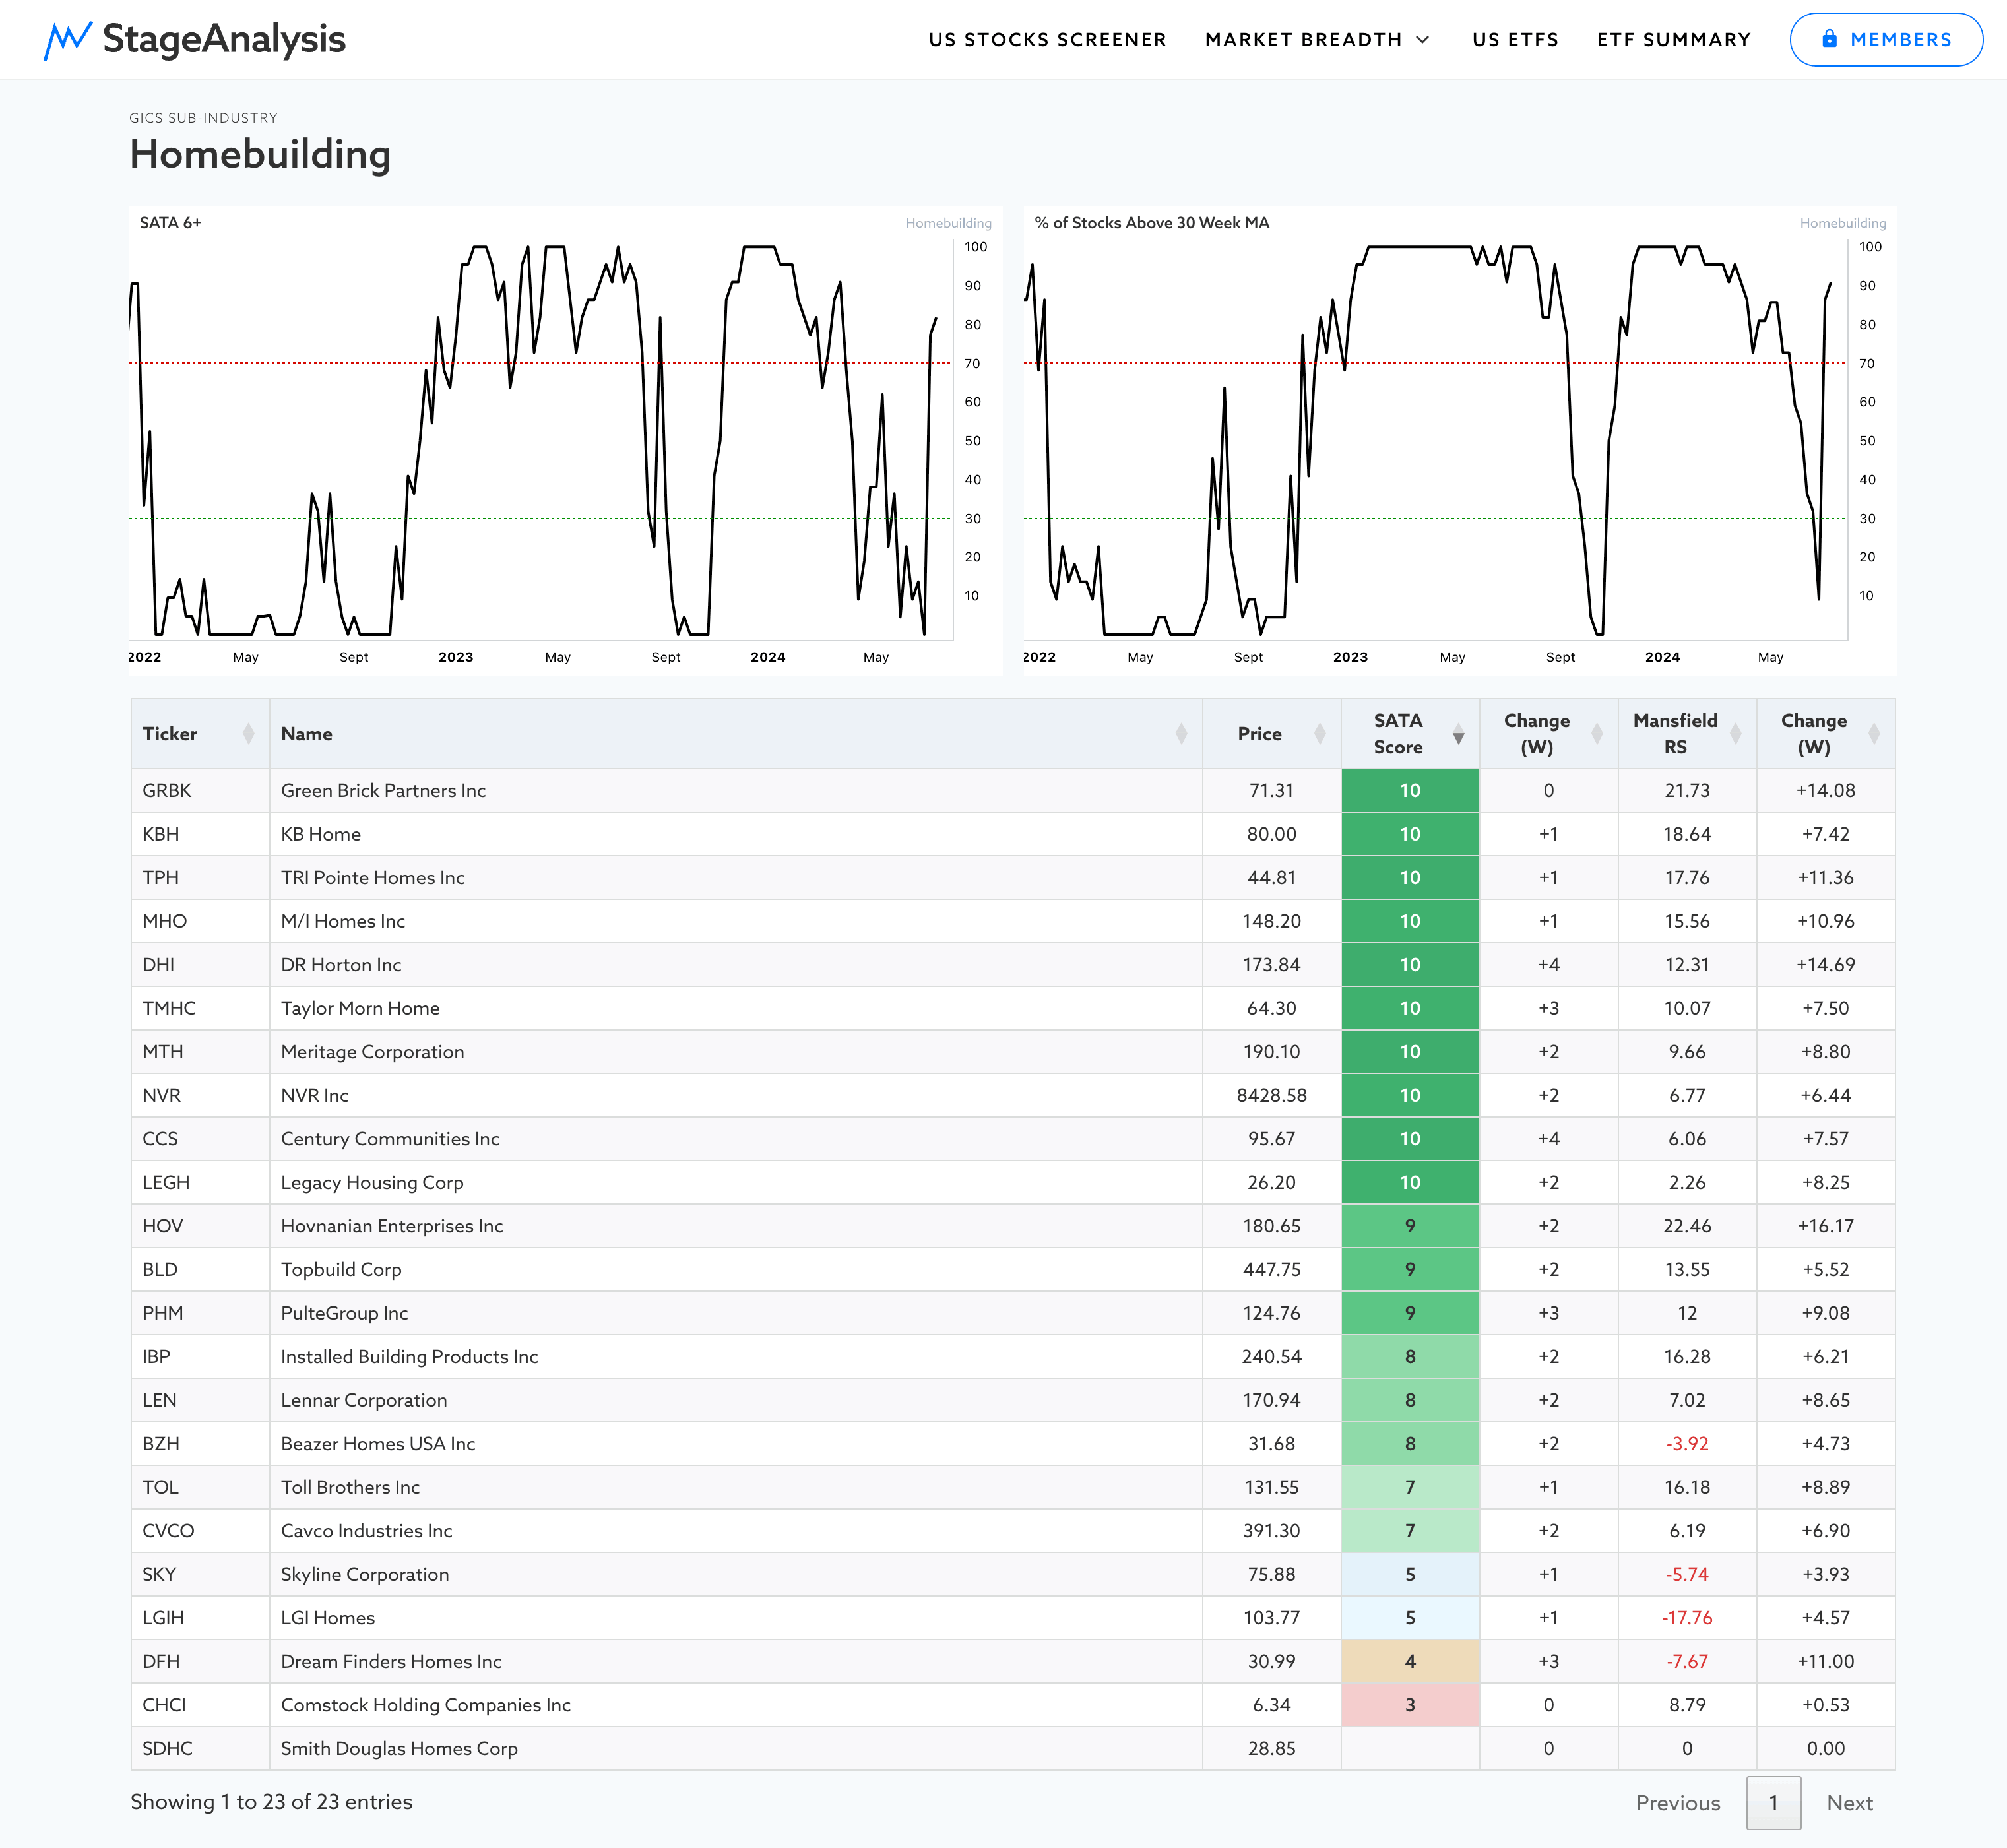
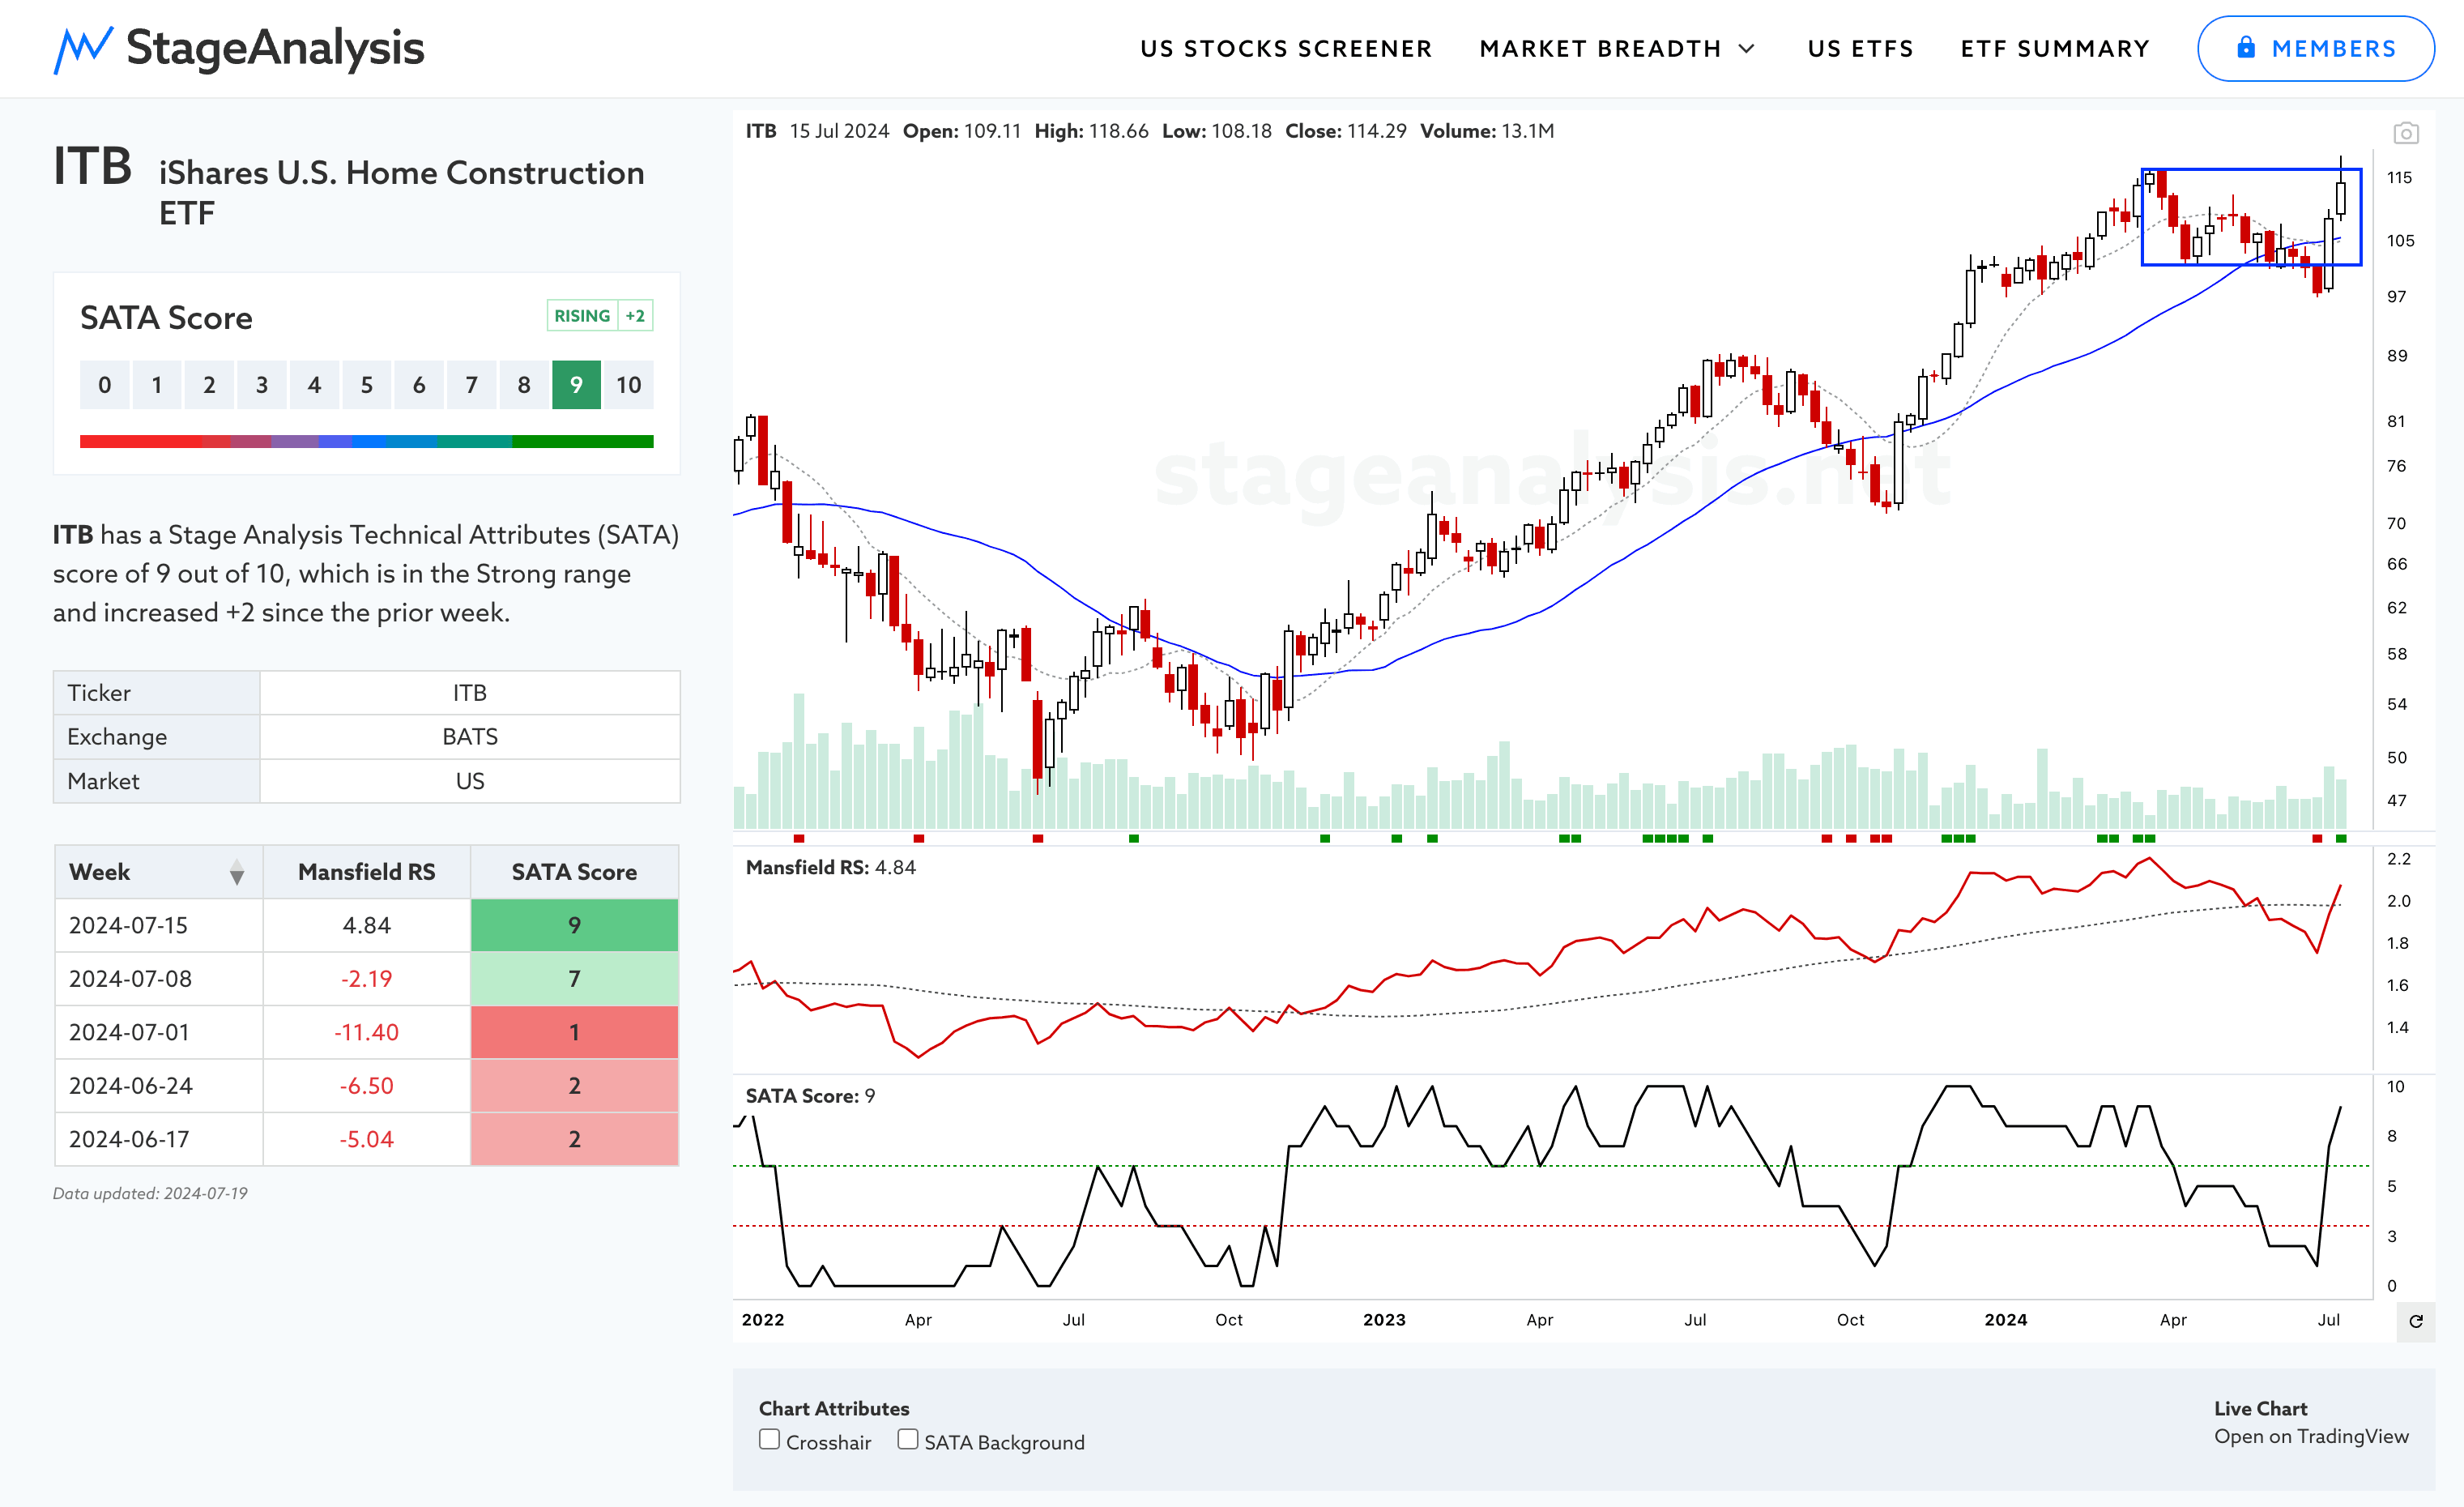
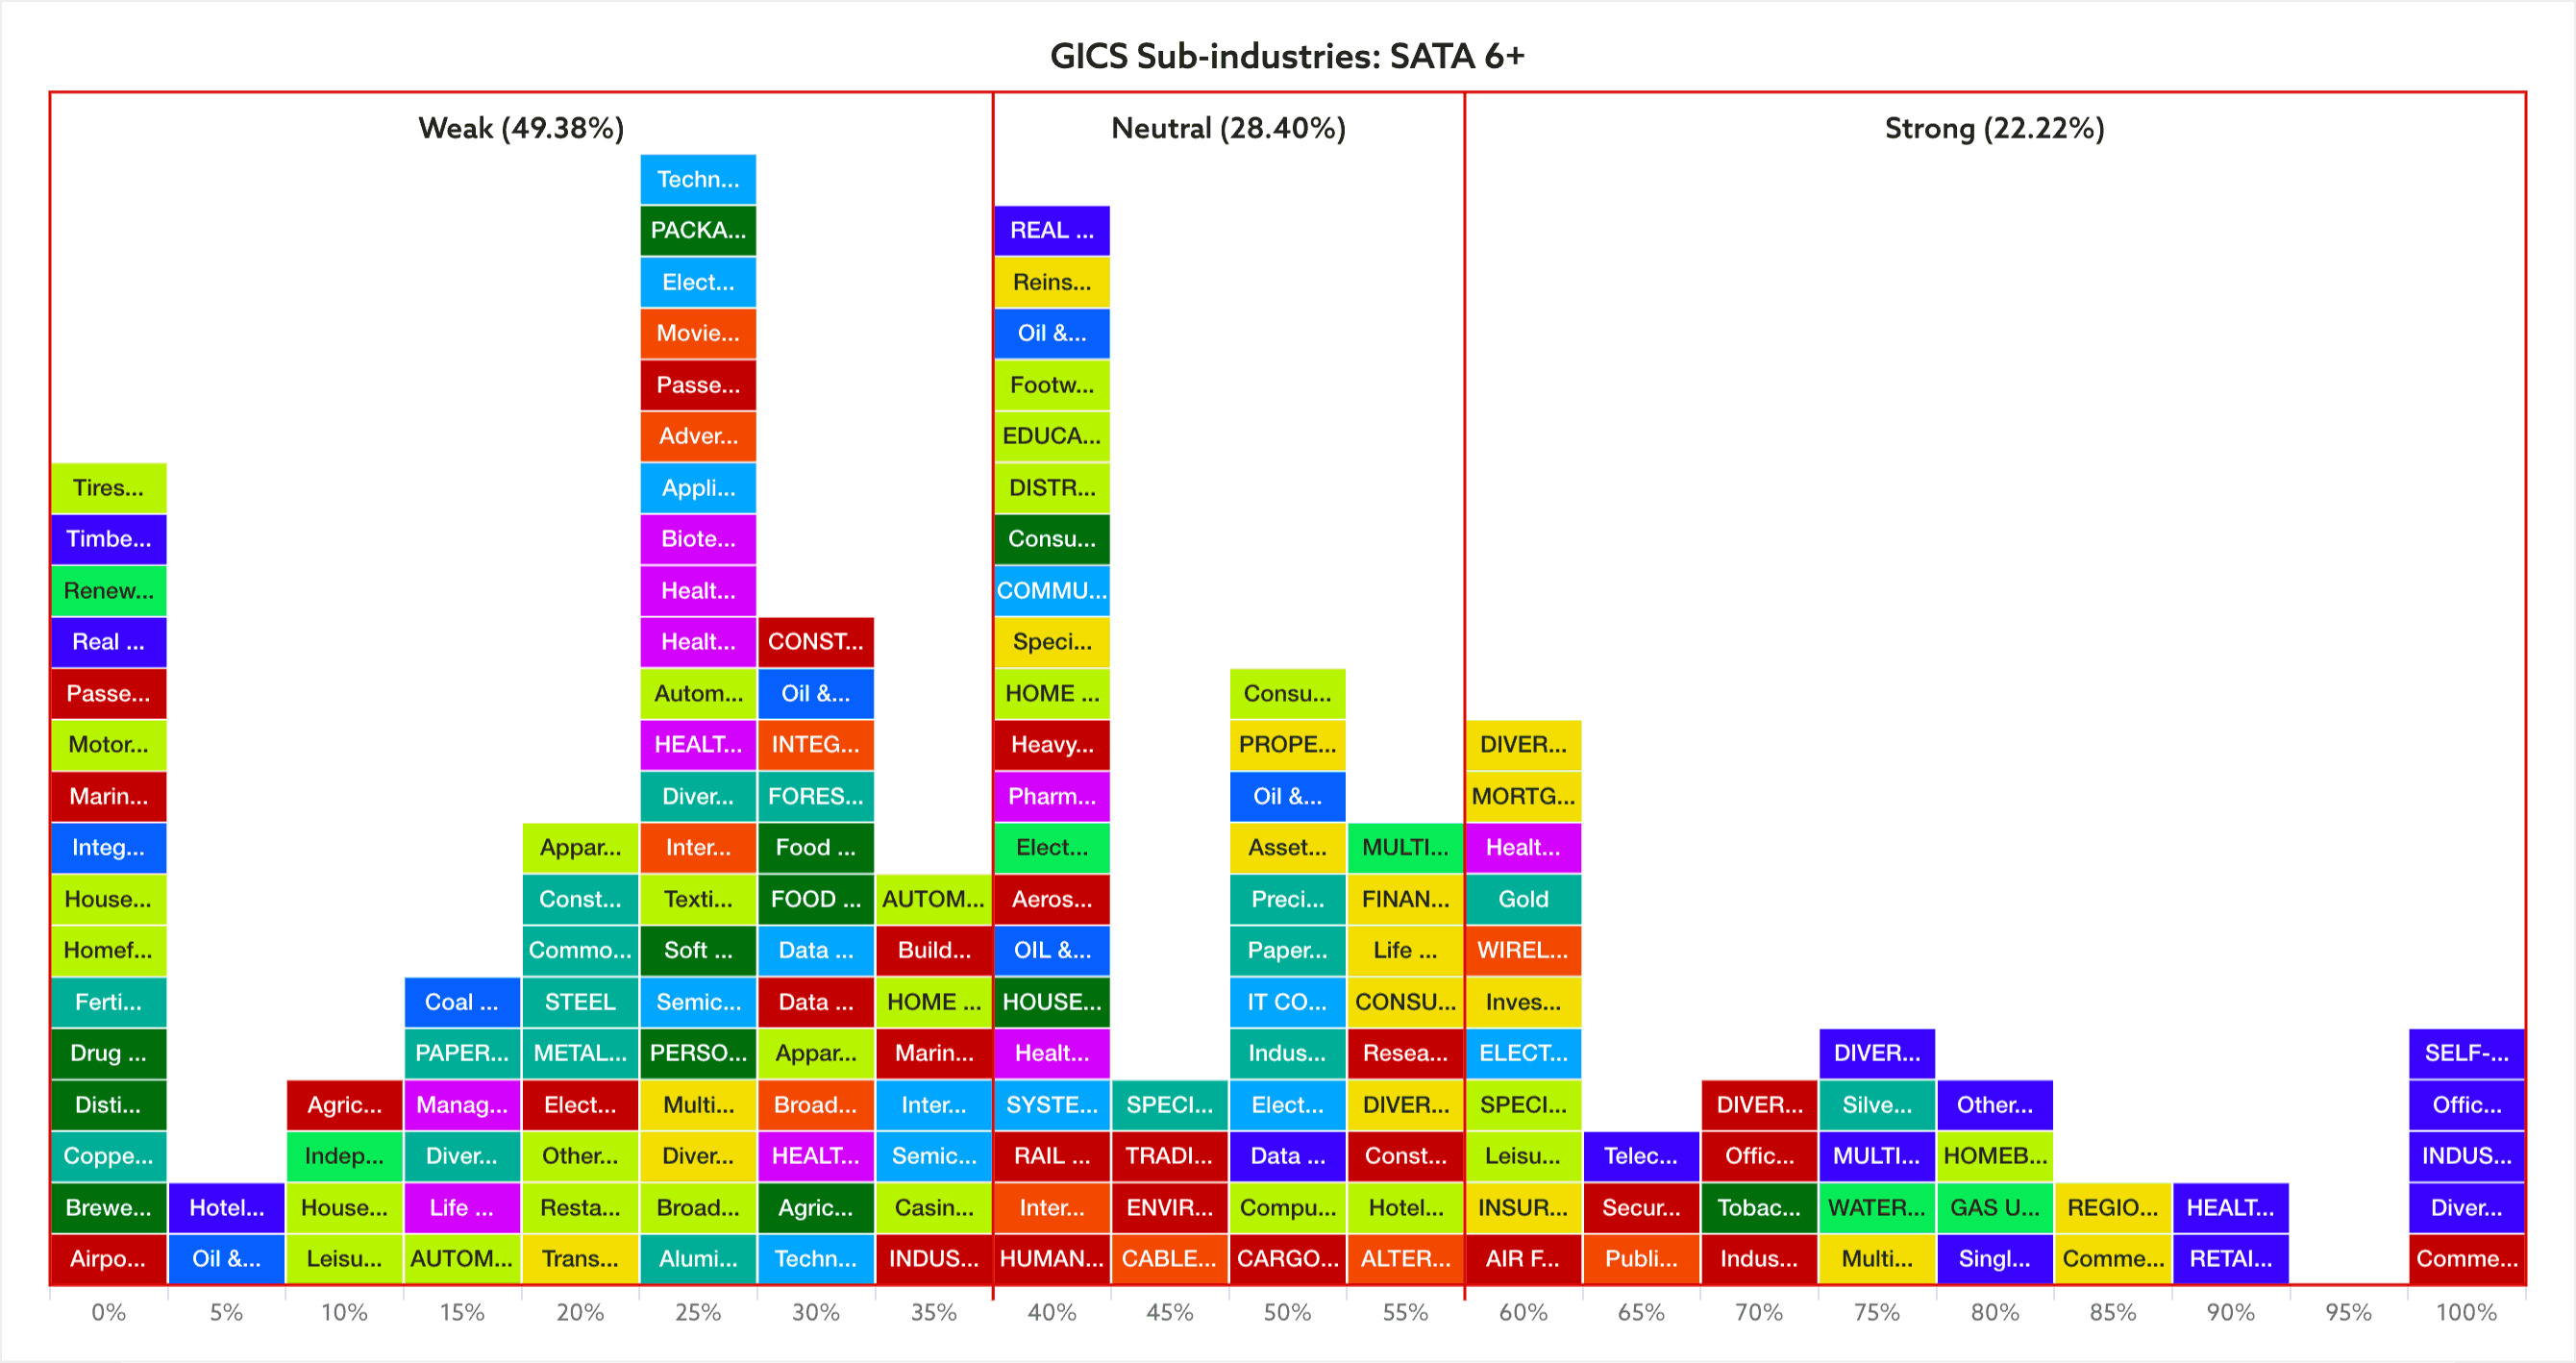
Last weeks featured group – Homebuilding, was the standout group once more this week. Gaining +8.03% on its price chart, and continuing to improve the amount of stocks on a strong Stage Analysis Technical Attributes (SATA) score by a further +4.55% to 81.82% on SATA 6+ (which can be seen on the SATA 6+ chart below). However, more than half of the group have got earnings coming up in the next 2 to 3 weeks. With NVR, PHM, CCS, MTH, TMHC and TPH reporting in the coming week. So be aware of the earnings dates if you are trading any of the Homebuilding stocks.
US Industry Groups by Weakest RS Score
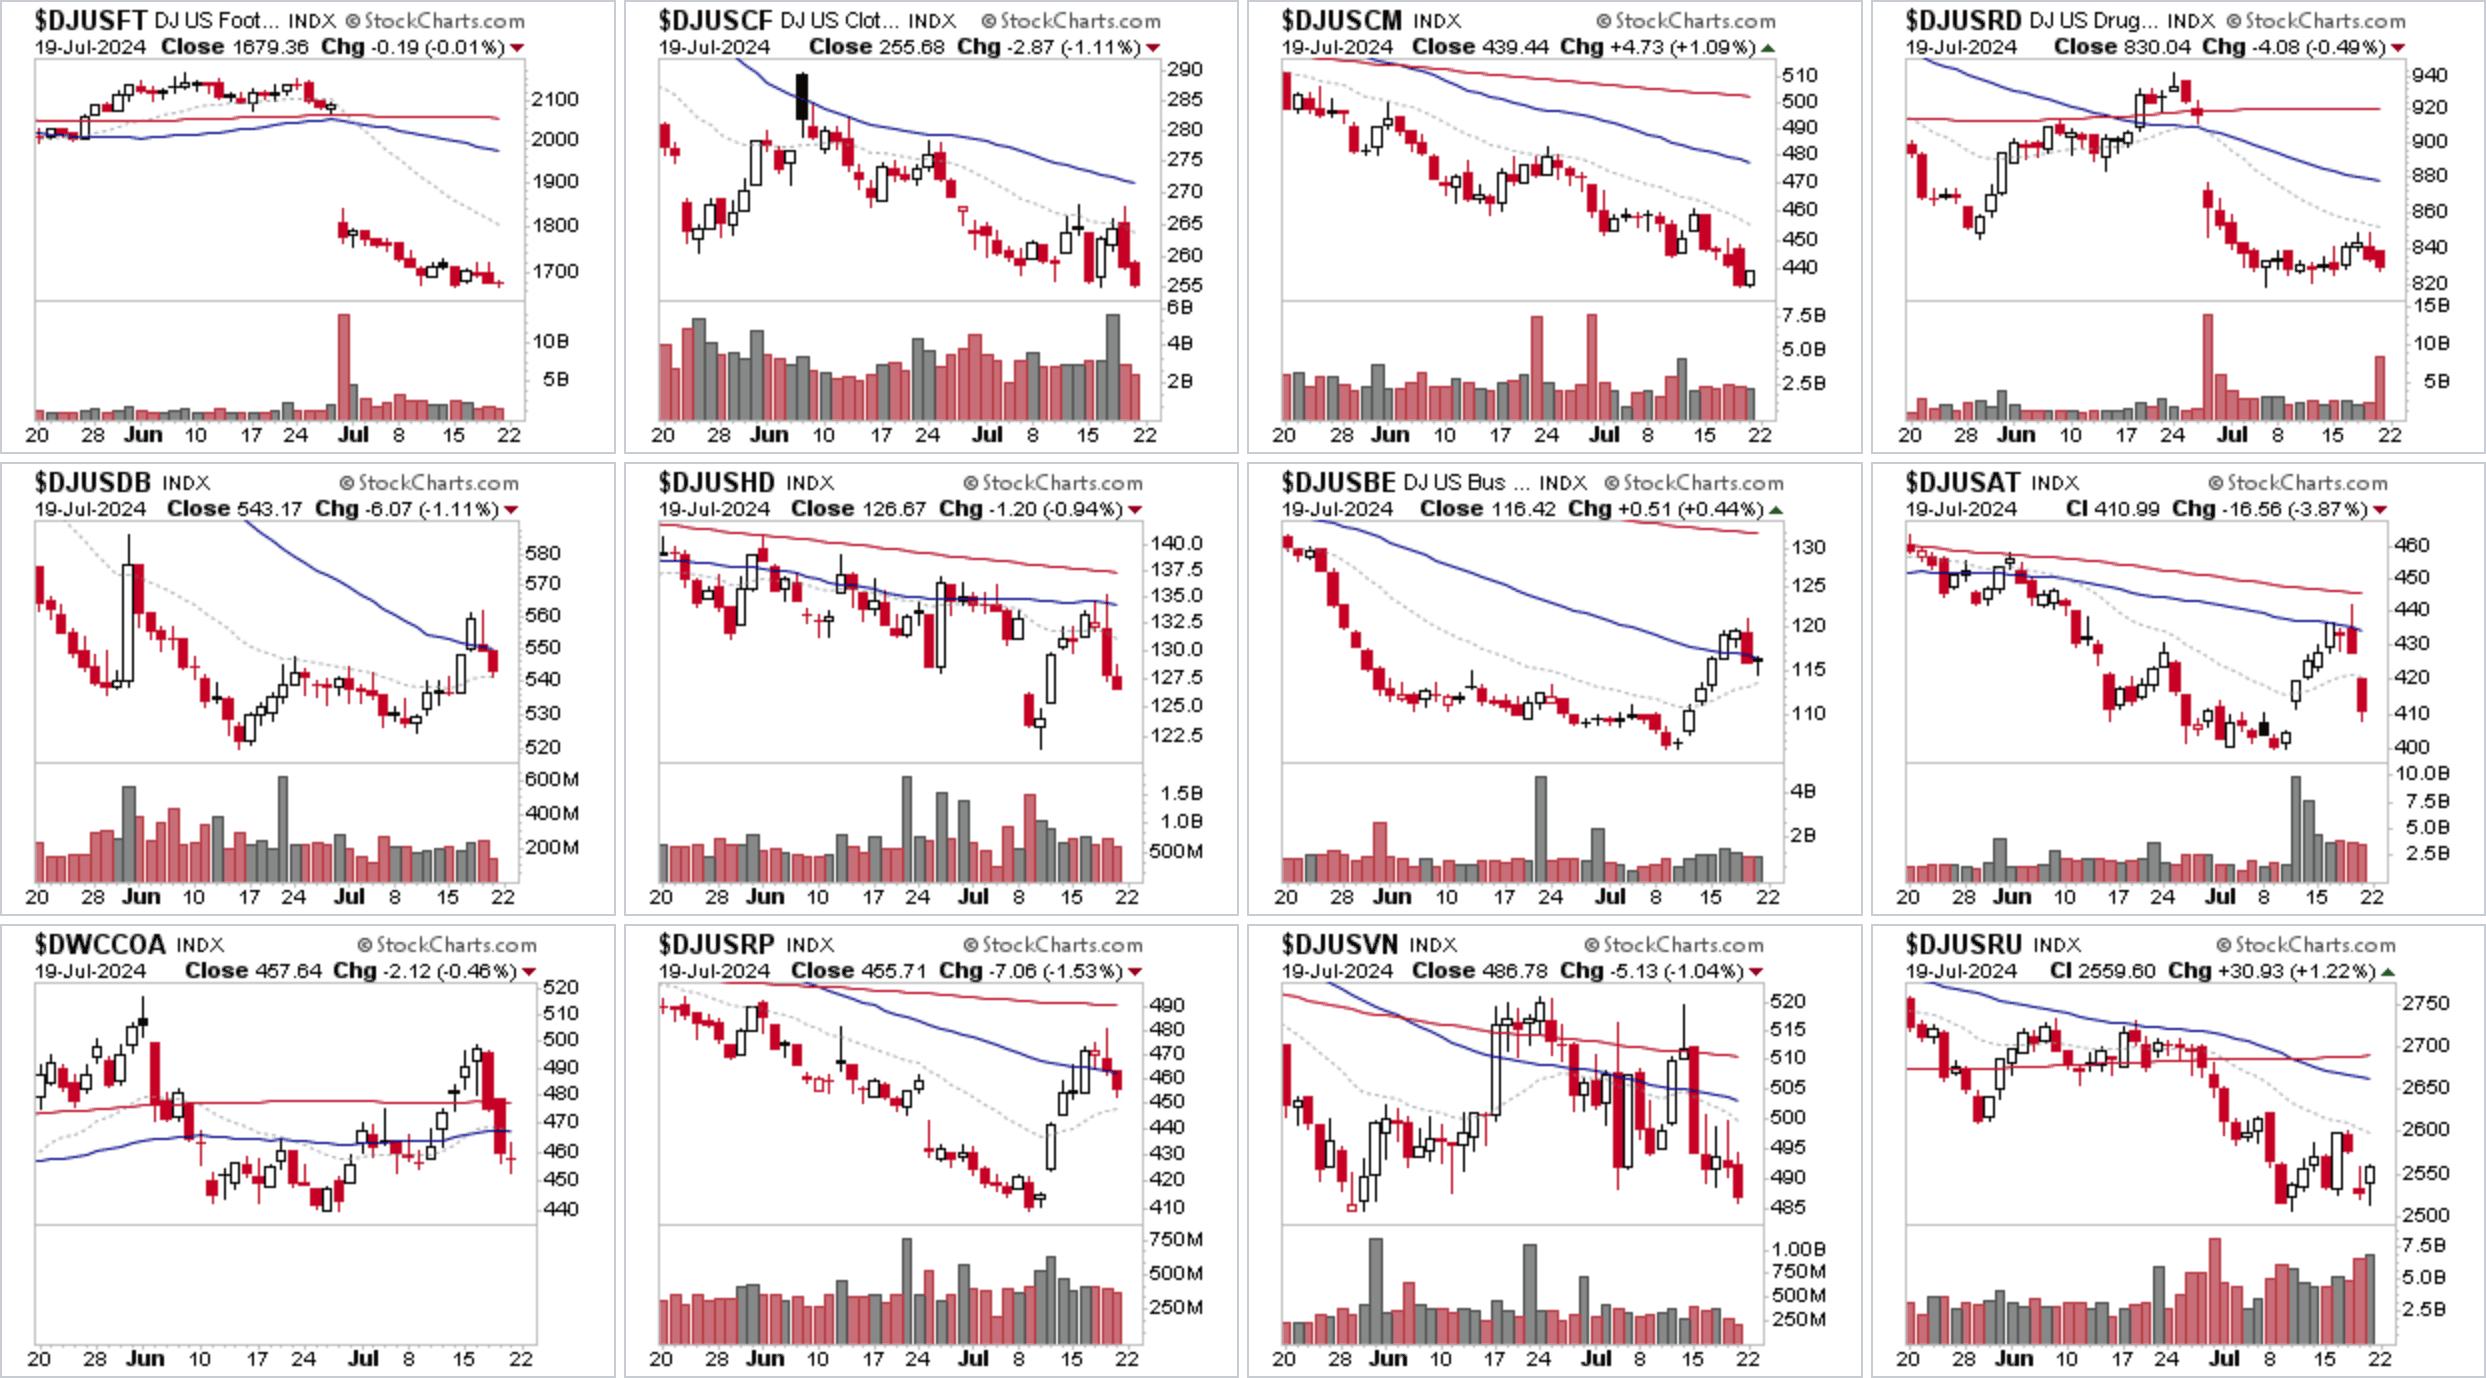
US Industry Groups sorted by Relative Strength
The purpose of the Relative Strength (RS) tables is to track the short, medium and long-term RS changes of the individual groups to find the new leadership earlier than the crowd.
RS Score of 100 is the strongest, and 0 is the weakest.
In the Stage Analysis method we are looking to focus on the strongest groups, as what is strong, tends to stay strong for a long time. But we also want to find the improving / up and coming groups that are starting to rise up strongly through the RS table from the lower zone, in order to find the future leading stocks before they break out from a Stage 1 base and move into a Stage 2 advancing phase.
Each week I go through the most interesting groups on the move in more detail during the Stage Analysis Members weekend video – as Industry Group analysis is a key part of Stan Weinstein's Stage Analysis method.
There are now multiple ways on the Stage Analysis website to view individual groups and sectors via the GICS Sub-industries (123), Industries (74) and Groups (25) pages and the new US Stocks Screener, in which you can easily filter via the Sectors and Sub-industries to see the component stocks and their current SATA and Mansfield RS data.
Note: The GICS Sub-industries, Industries and Groups are different to the DJ US Industry Groups used in this post, which I'm gradually retiring as the new Stage Analysis tools are developed, and will be moving this post over to use the GICS Industries or Sub-Industries data in the coming months.
Become a Stage Analysis Member:
To see more like this and other premium content, such as the regular US Stocks watchlist, detailed videos and intraday posts, become a Stage Analysis member.
Join Today
Disclaimer: For educational purpose only. Not investment advice. Seek professional advice from a financial advisor before making any investing decisions.