
Scanning for Stage 4 Breakdown Attempts
One of the great things about the US Stocks Screener on the Stage Analysis website is that it makes it easy to find stocks making both Stage 2 breakouts and Stage 4 breakdowns. So I thought today I would focus on showing you how to find the find Stage 4 breakdowns.
Step 1: Go to the US Stocks Screener page
Step 2: Set the screener filters to your requirements.
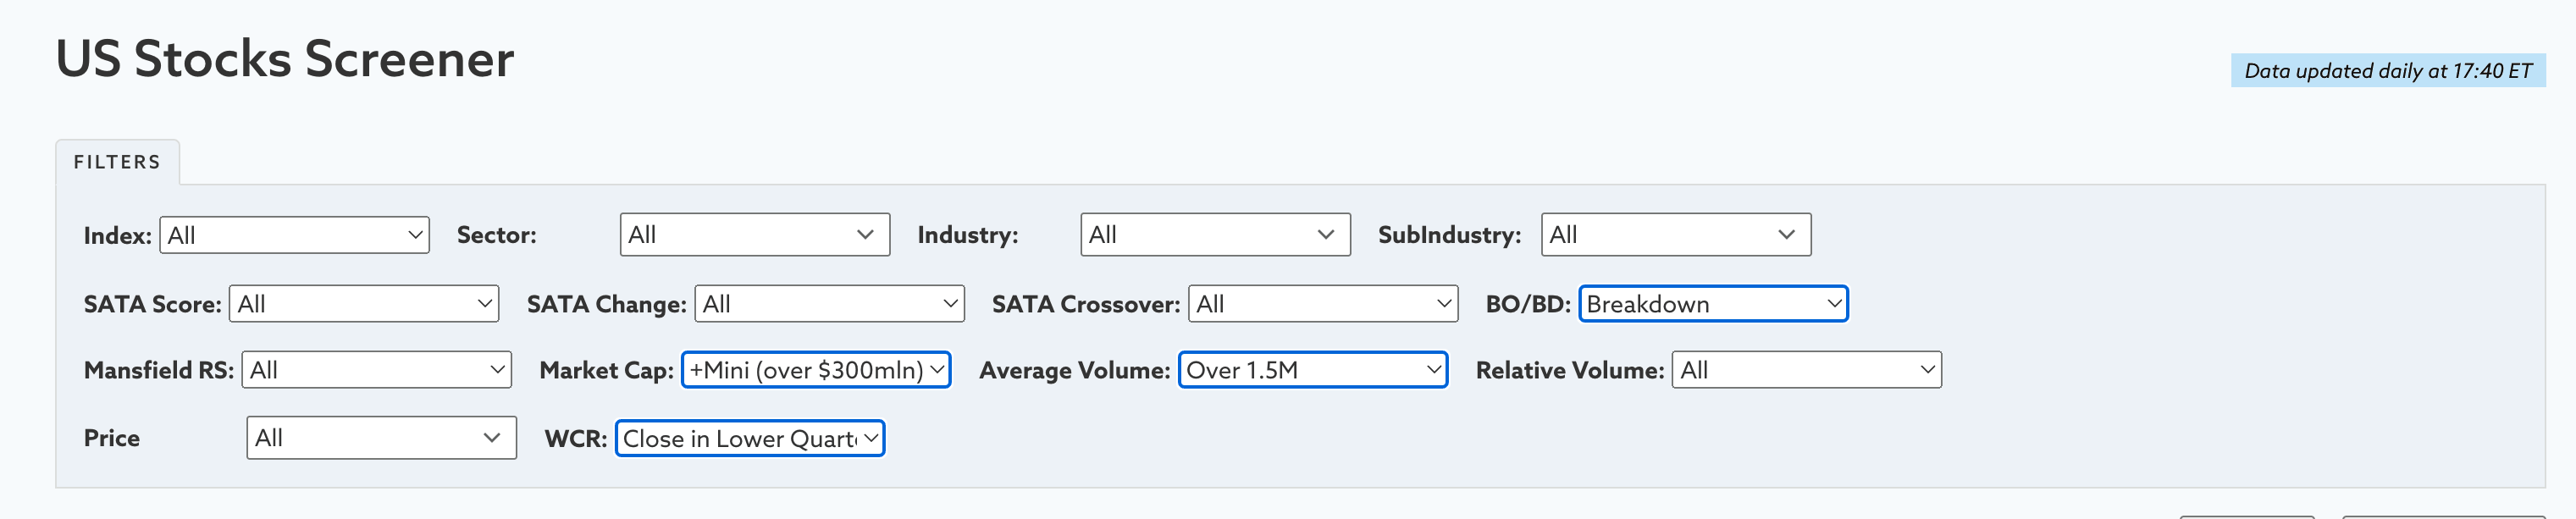
To find stocks making Stage 4 breakdown attempts I recommend the following filter settings as a starting point:
- BO/BD: Breakdown
- Market Cap: +Mini (over $300mln)
- Average Volume: Over 1.5M (Note: it is weekly volume. So 1.5M average weekly volume is equivalent of 300k average daily volume)
- WCR: Close in the Lower Quarter of Bar
- Additional filters may also be useful to reduce the amount results to go through. i.e. you might want to Exclude a number of the Sectors, such as Health Care, Real Estate, Utilities etc.
Step 3: The filters will give you a list of results in order of strongest SATA score and Mansfield RS (see below screenshot). So you might want to change the sort order of the columns, by clicking on the top of the column. For example in the screenshot below the results have been sorted first by their Sub-industry and then by their Sector. In order to group them with their related stocks and to more easily identify potential group themes.
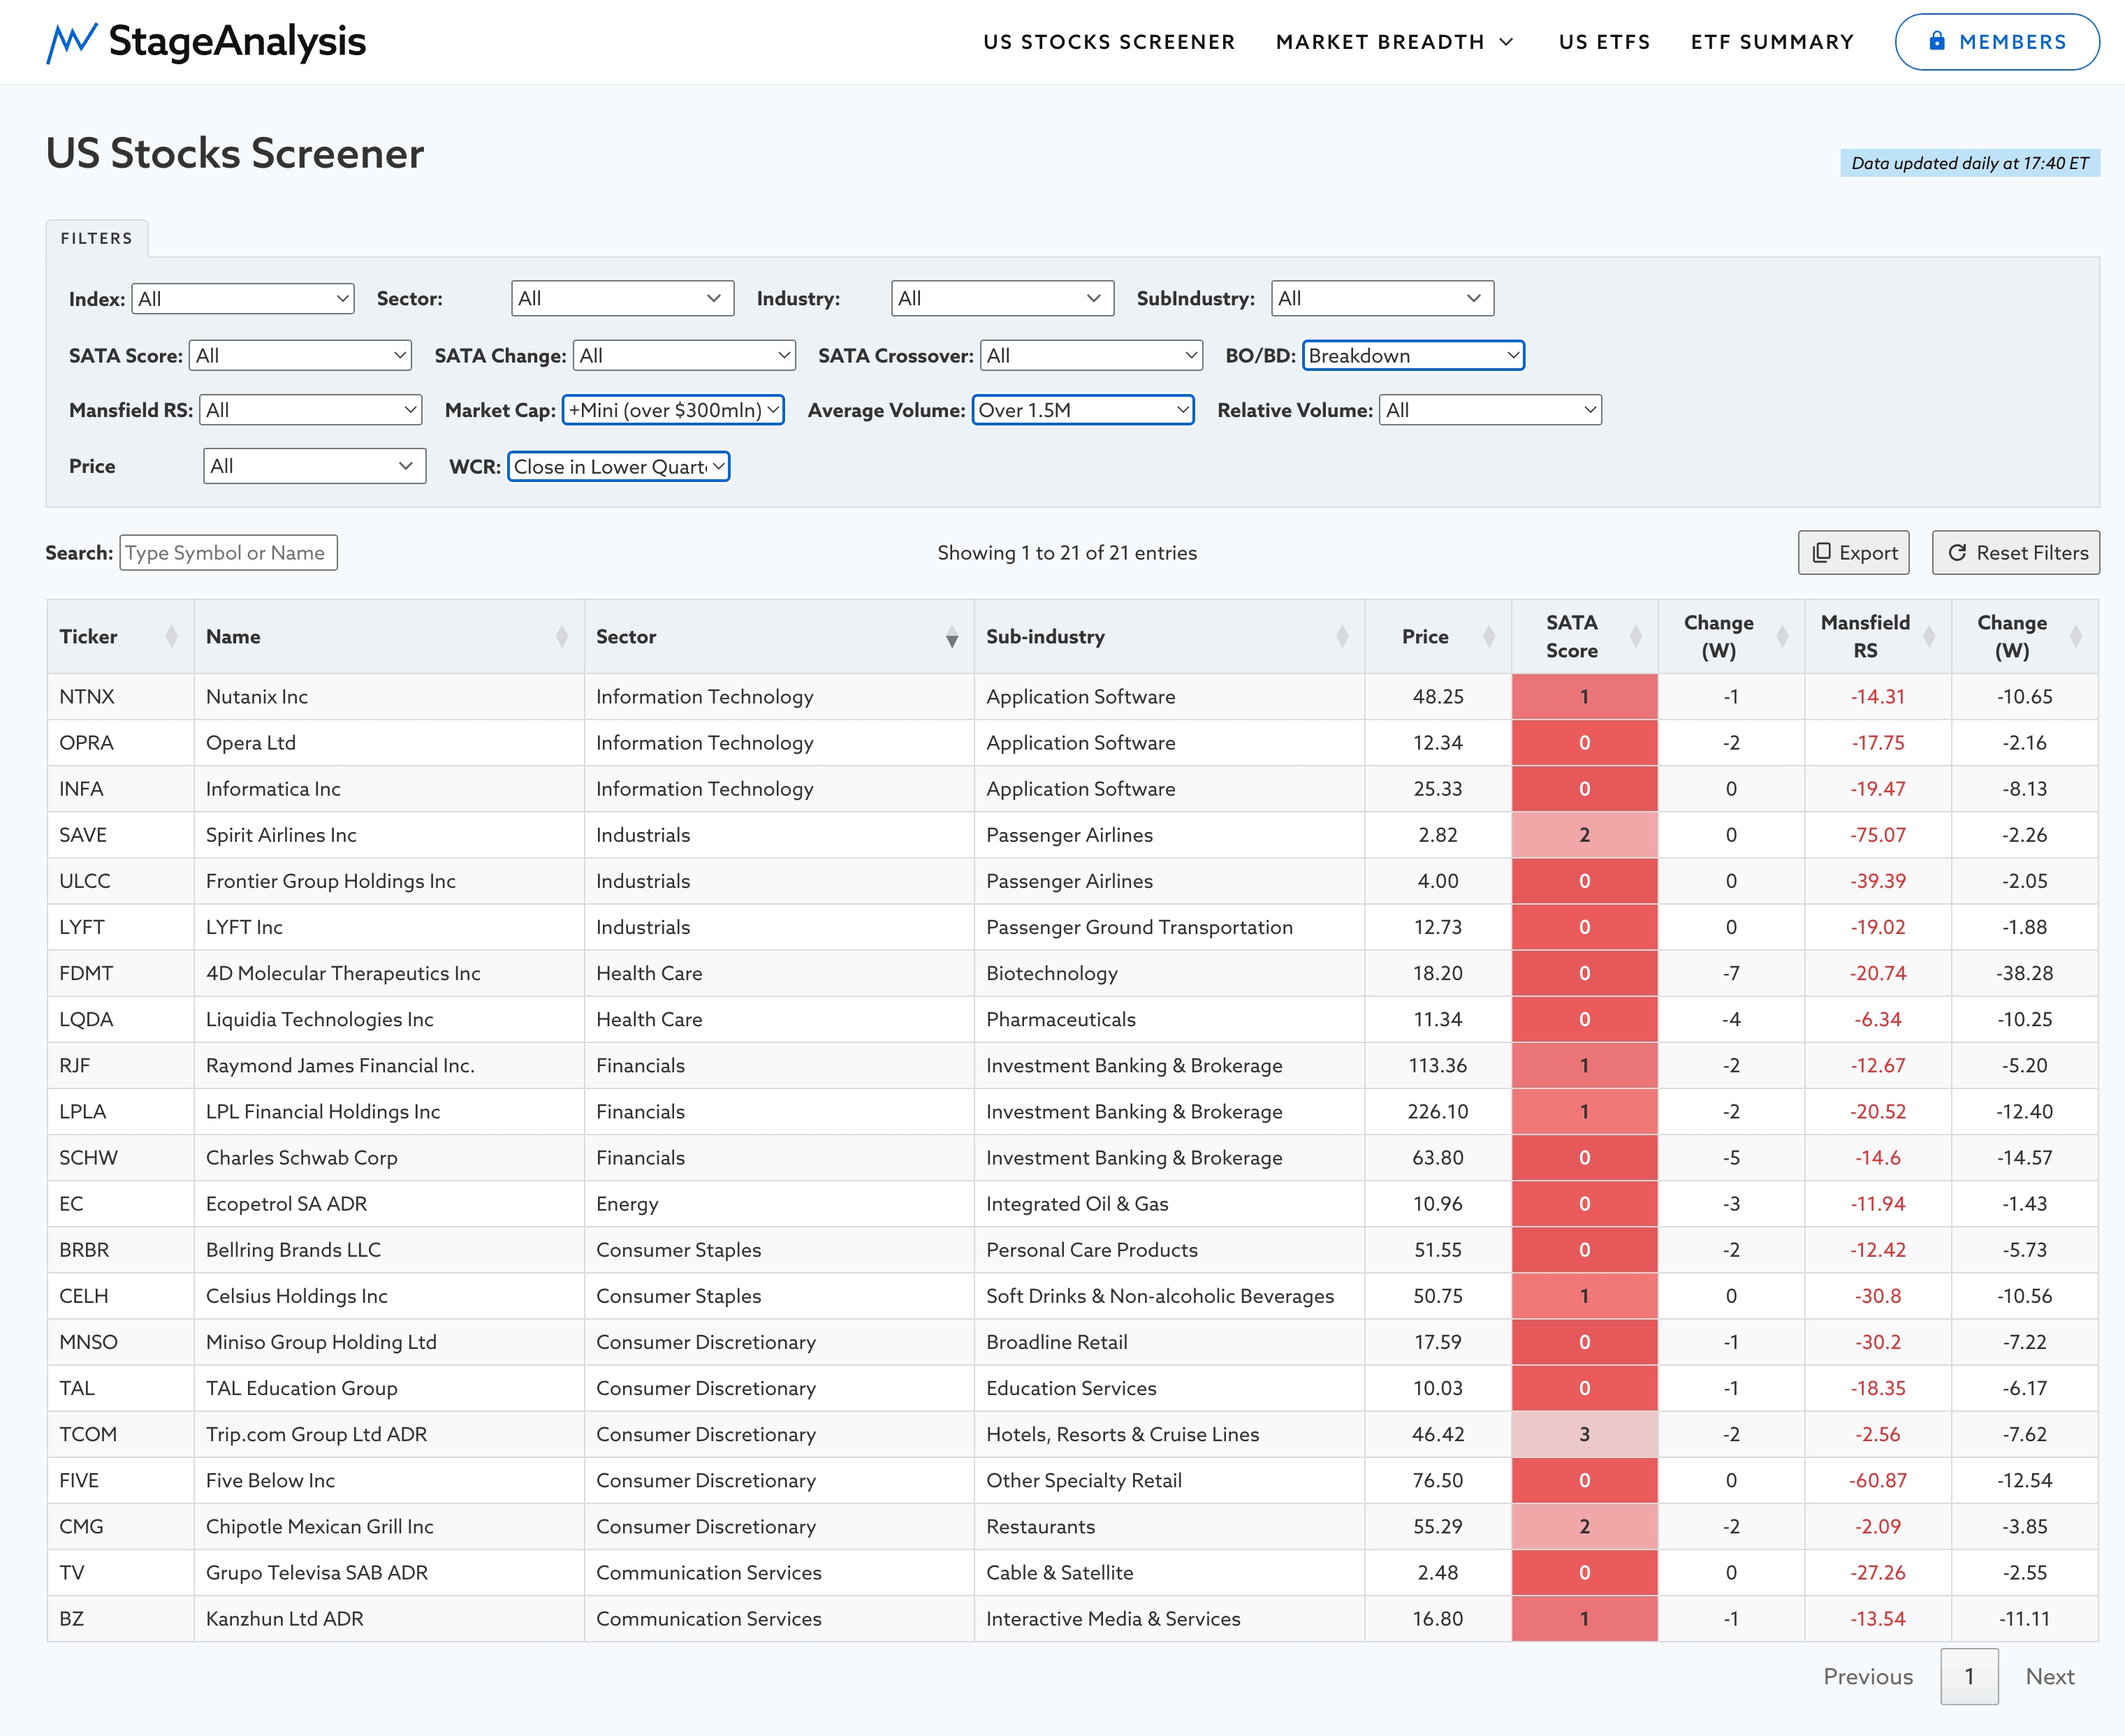
Step 4: Click the Ticker or Name of each stock to open the individual page of each stock, so that you can view their weekly Stage Analysis Technical Attributes (SATA) chart and SATA data, and compare where the stock is relative to it peers by viewing the Sector and Sub-industry panels that pop out on click. Or you might want to Export the ticker list to you preferred live chart program such as Tradingview or Stockcharts in order to view the stocks on multiple time frames.
To do that you just need to click on the Export button top right of the table, and it will give you a comma separated list, that you can copy and paste into your charting software as a watchlist or chart list etc.
Step 5: Manually go through the weekly charts and determine which are Stage 4 breakdowns and which are lower lows etc, and then start to filter down to your chosen stocks. Which in this case is: NTNX, INFA, BRBR, LQDA, MNSO, LYFT (where LYFT is an outlier as its not the Stage 4 breakdown week, but it it is still close to the breakdown level)
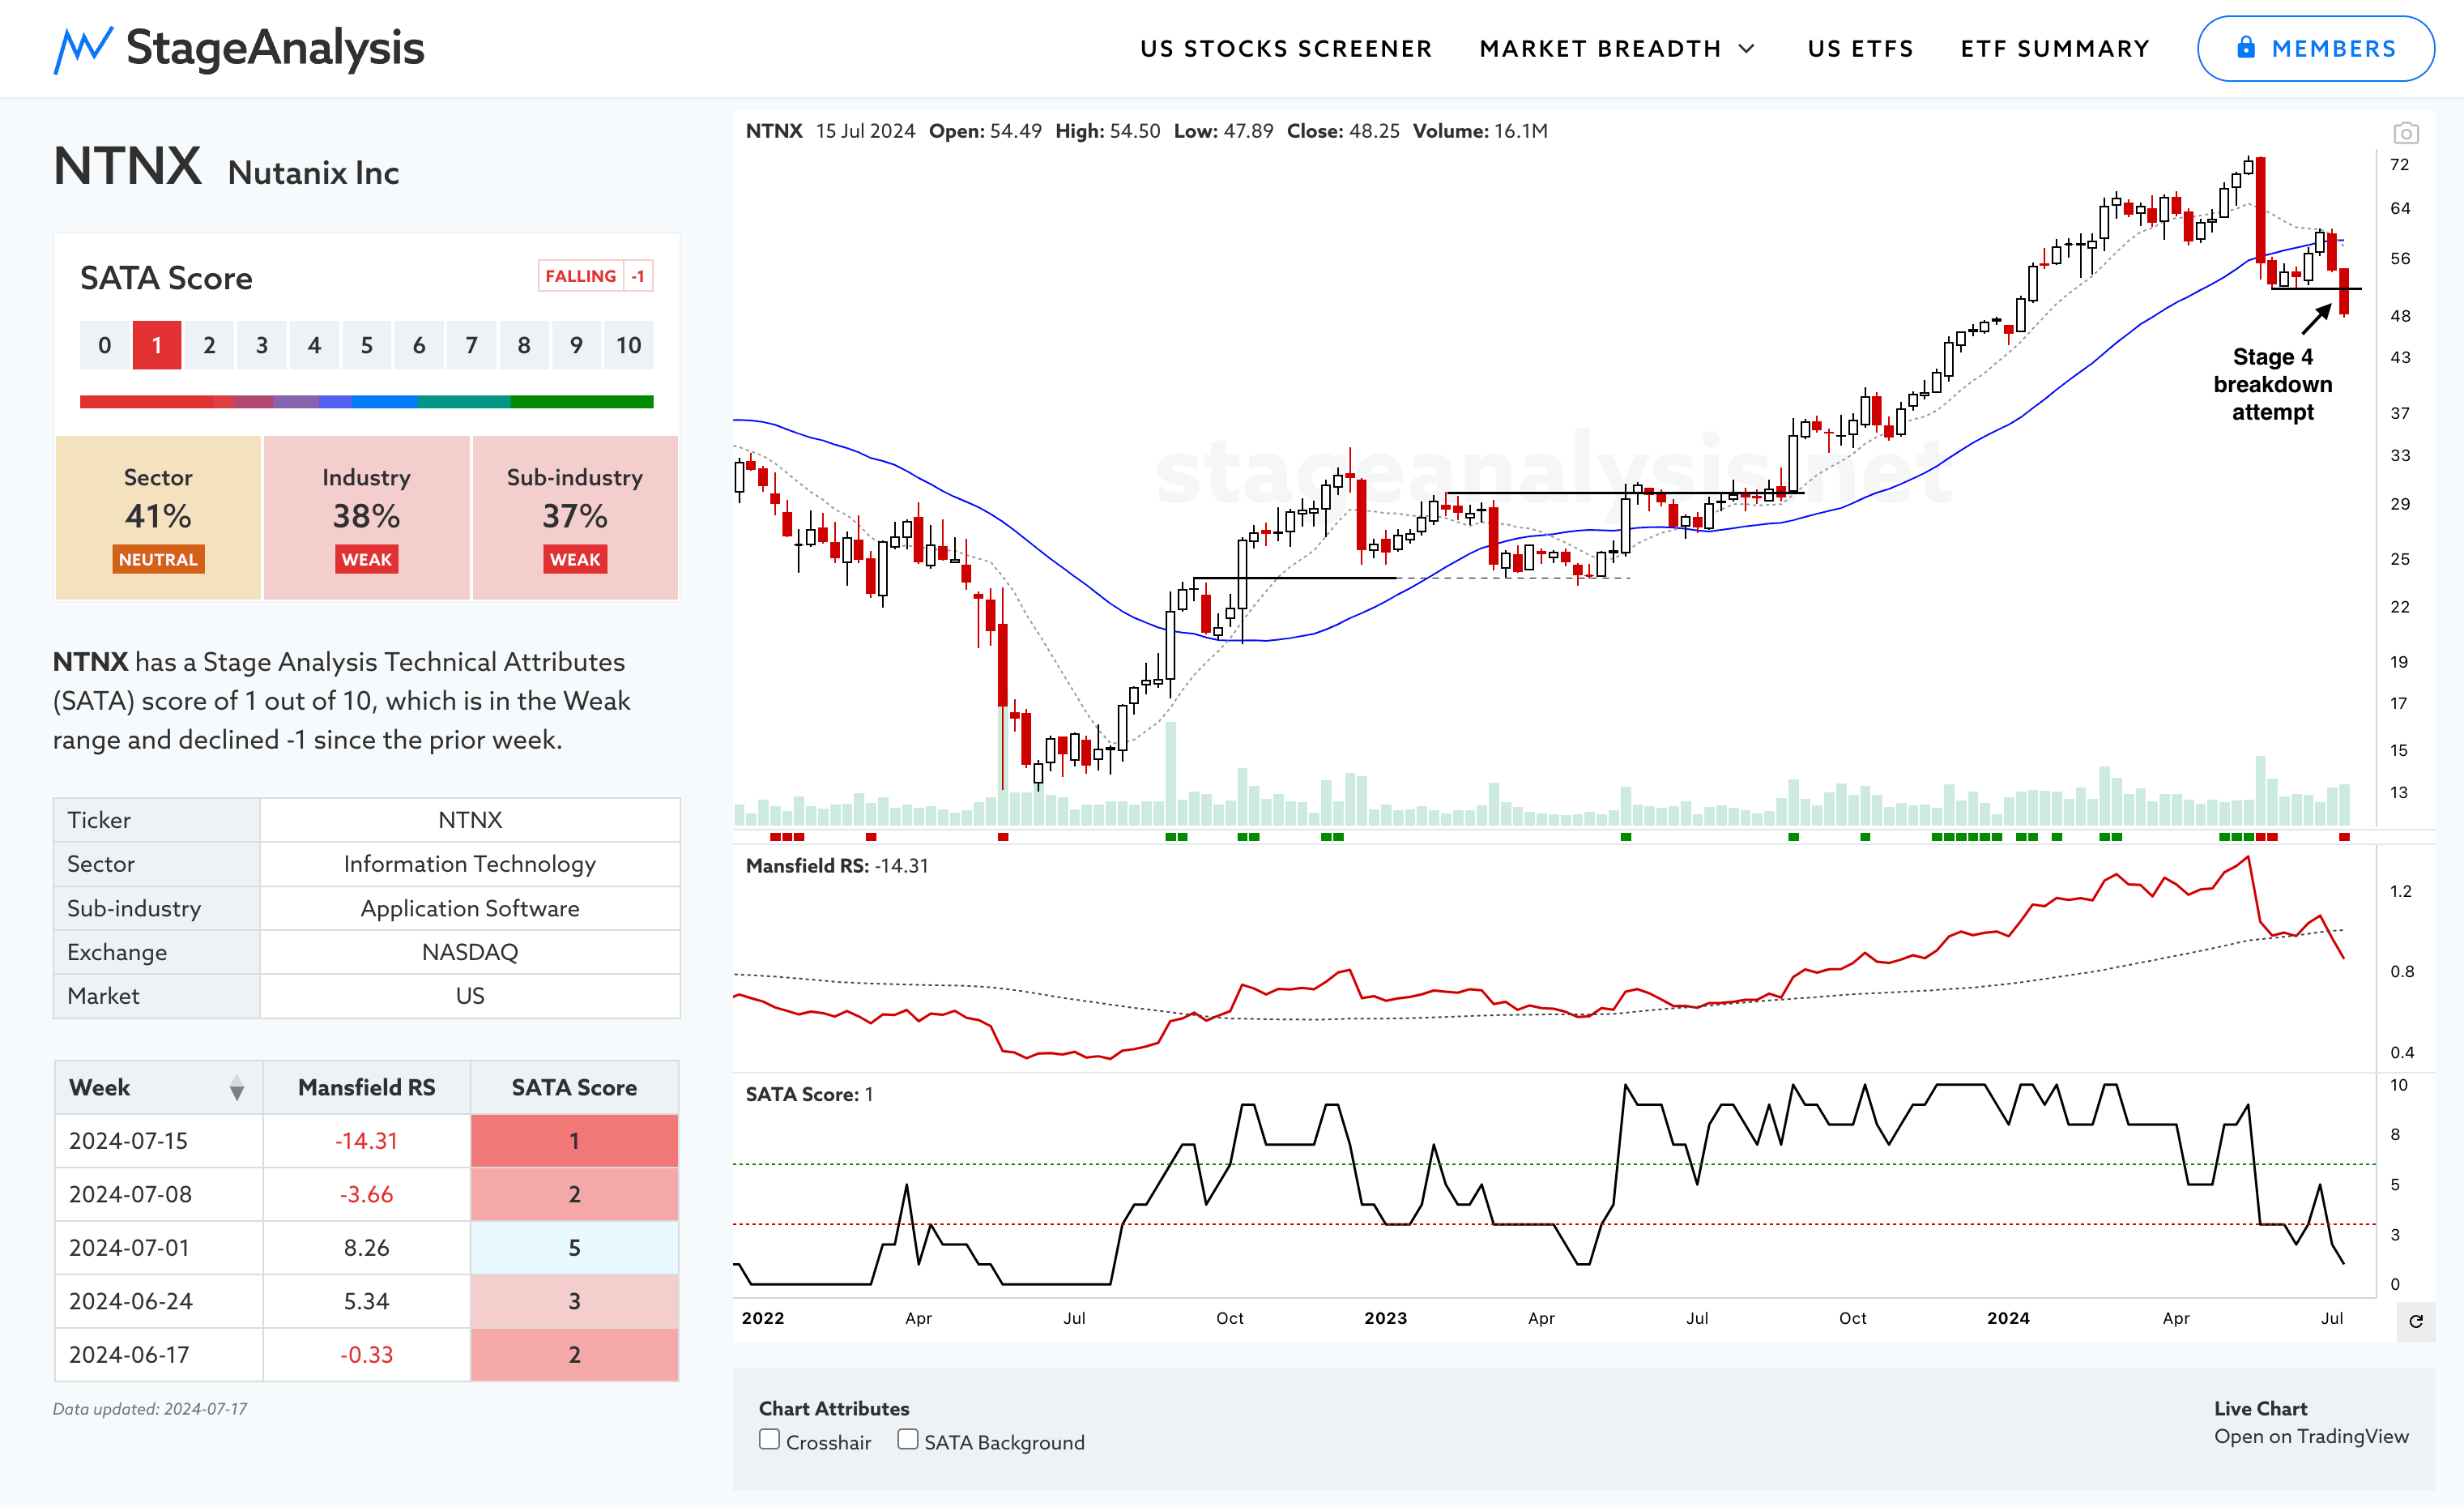
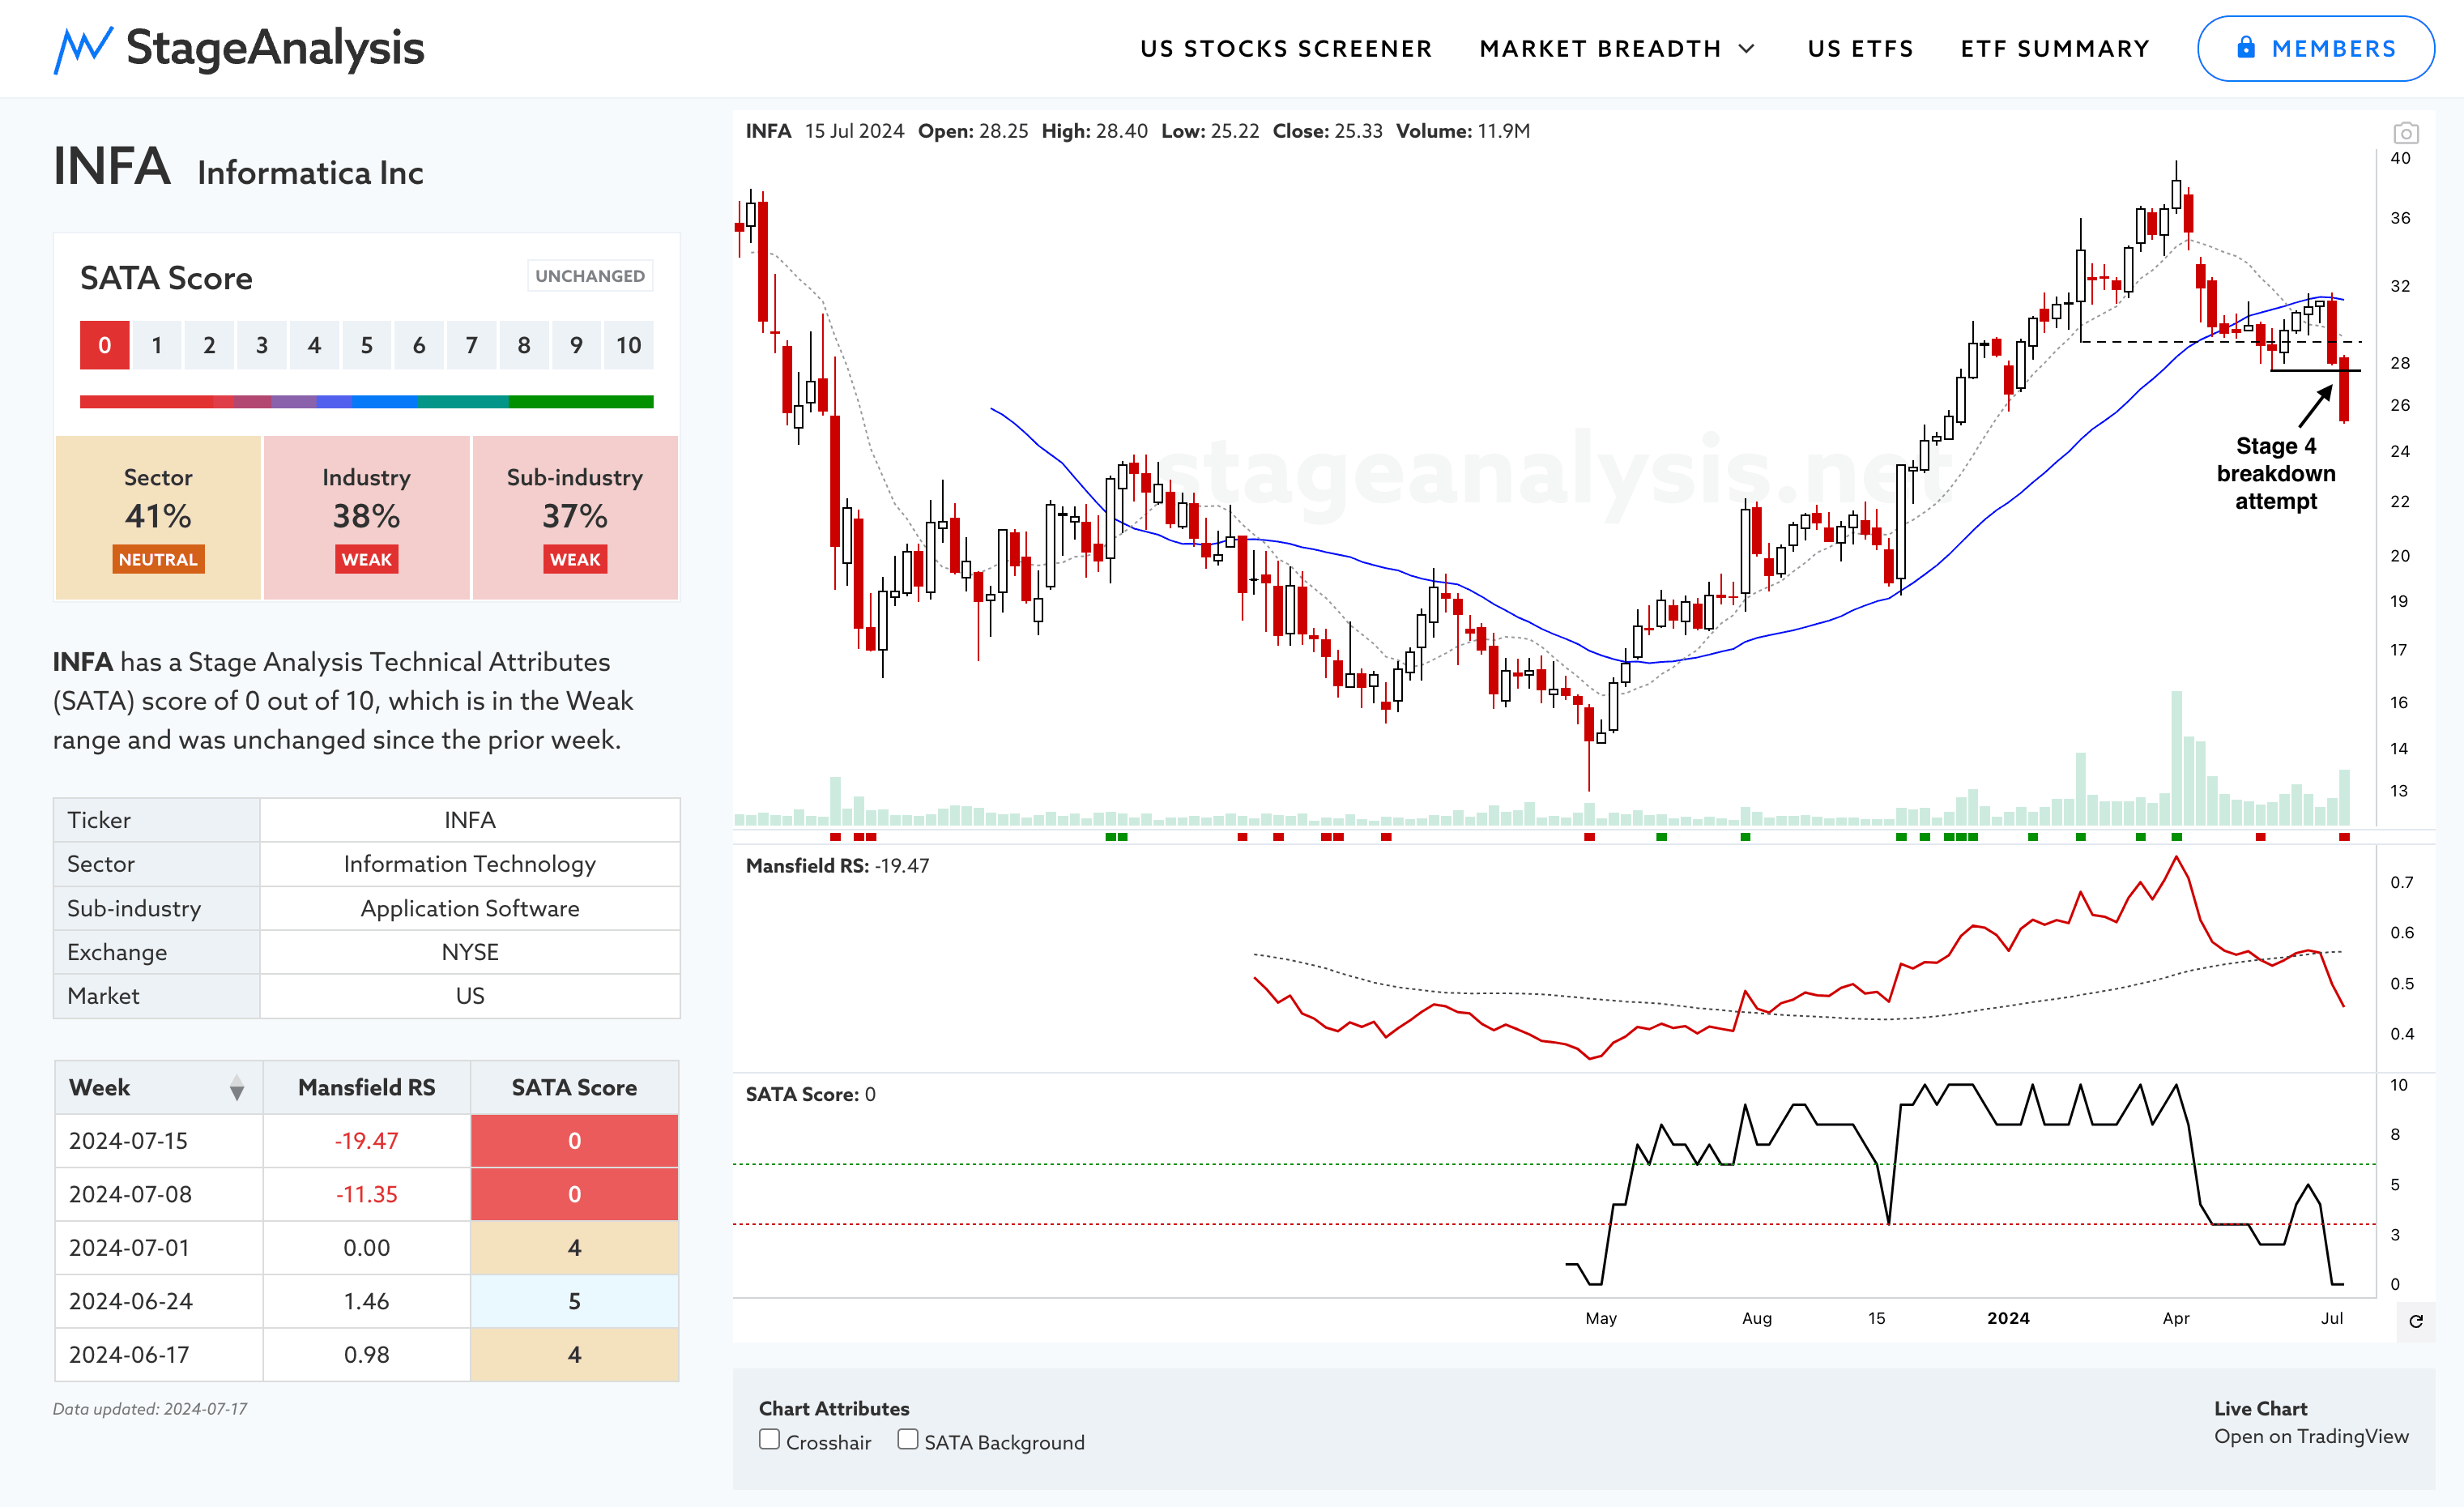
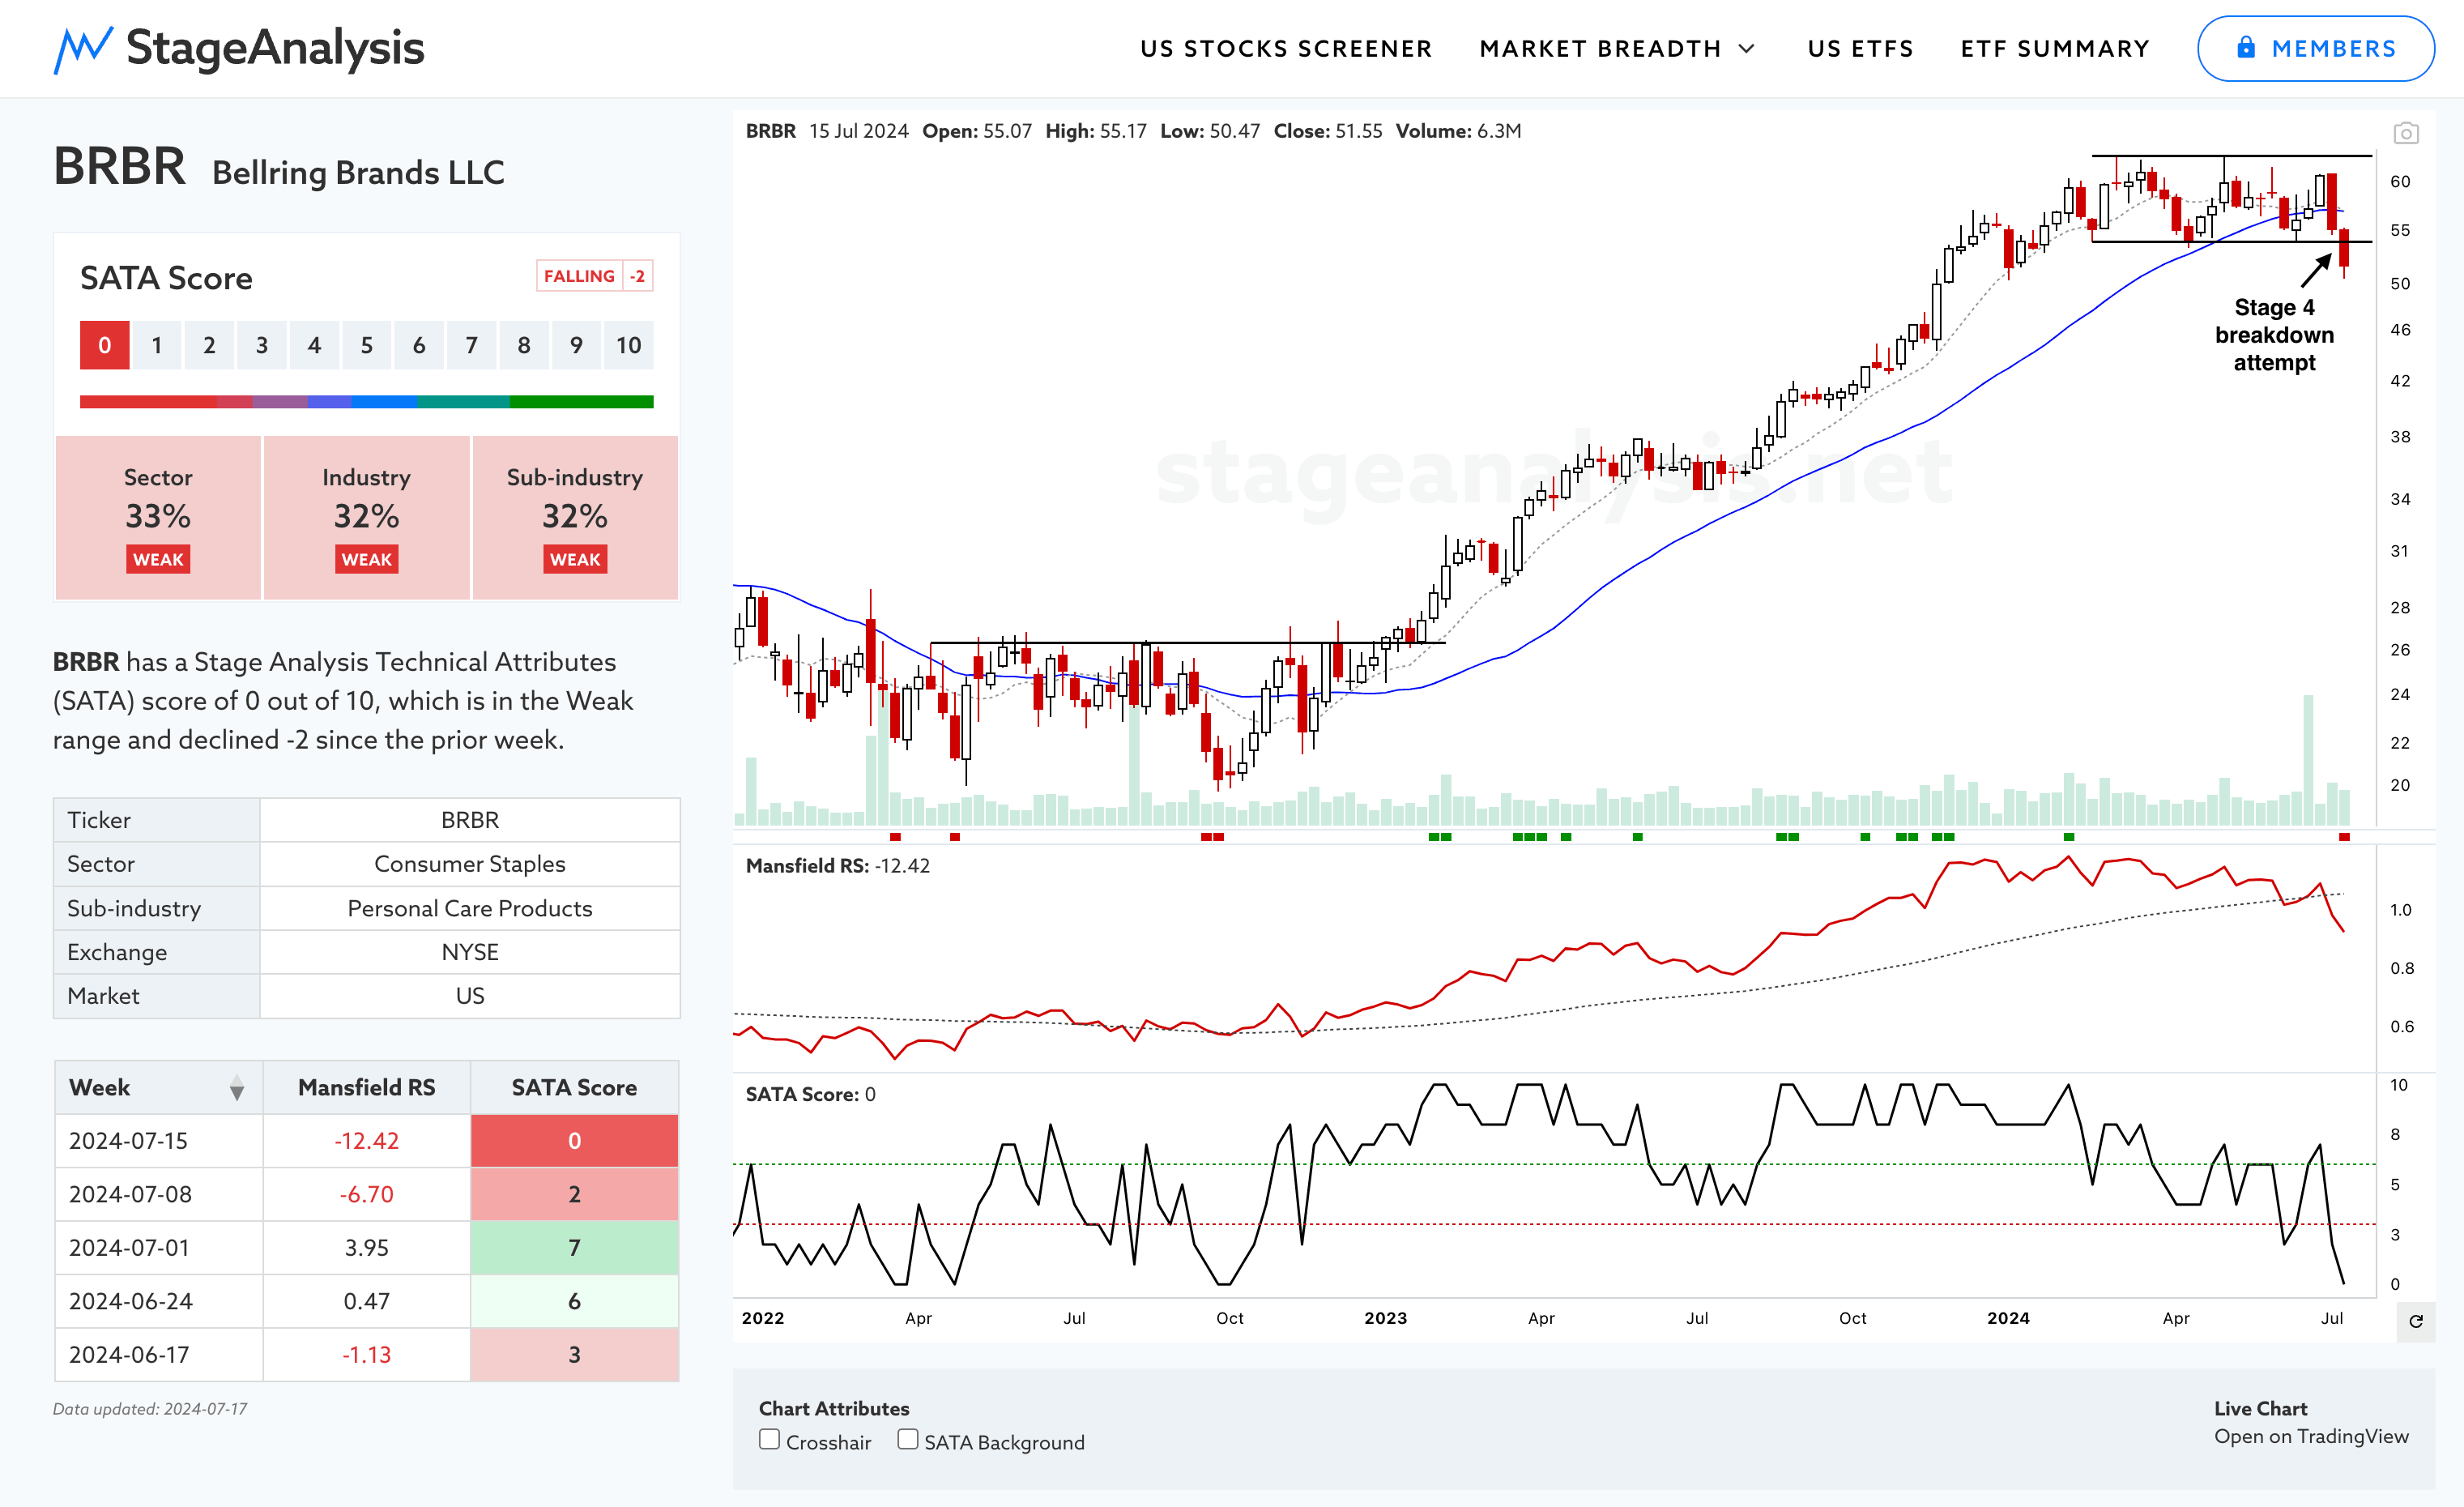
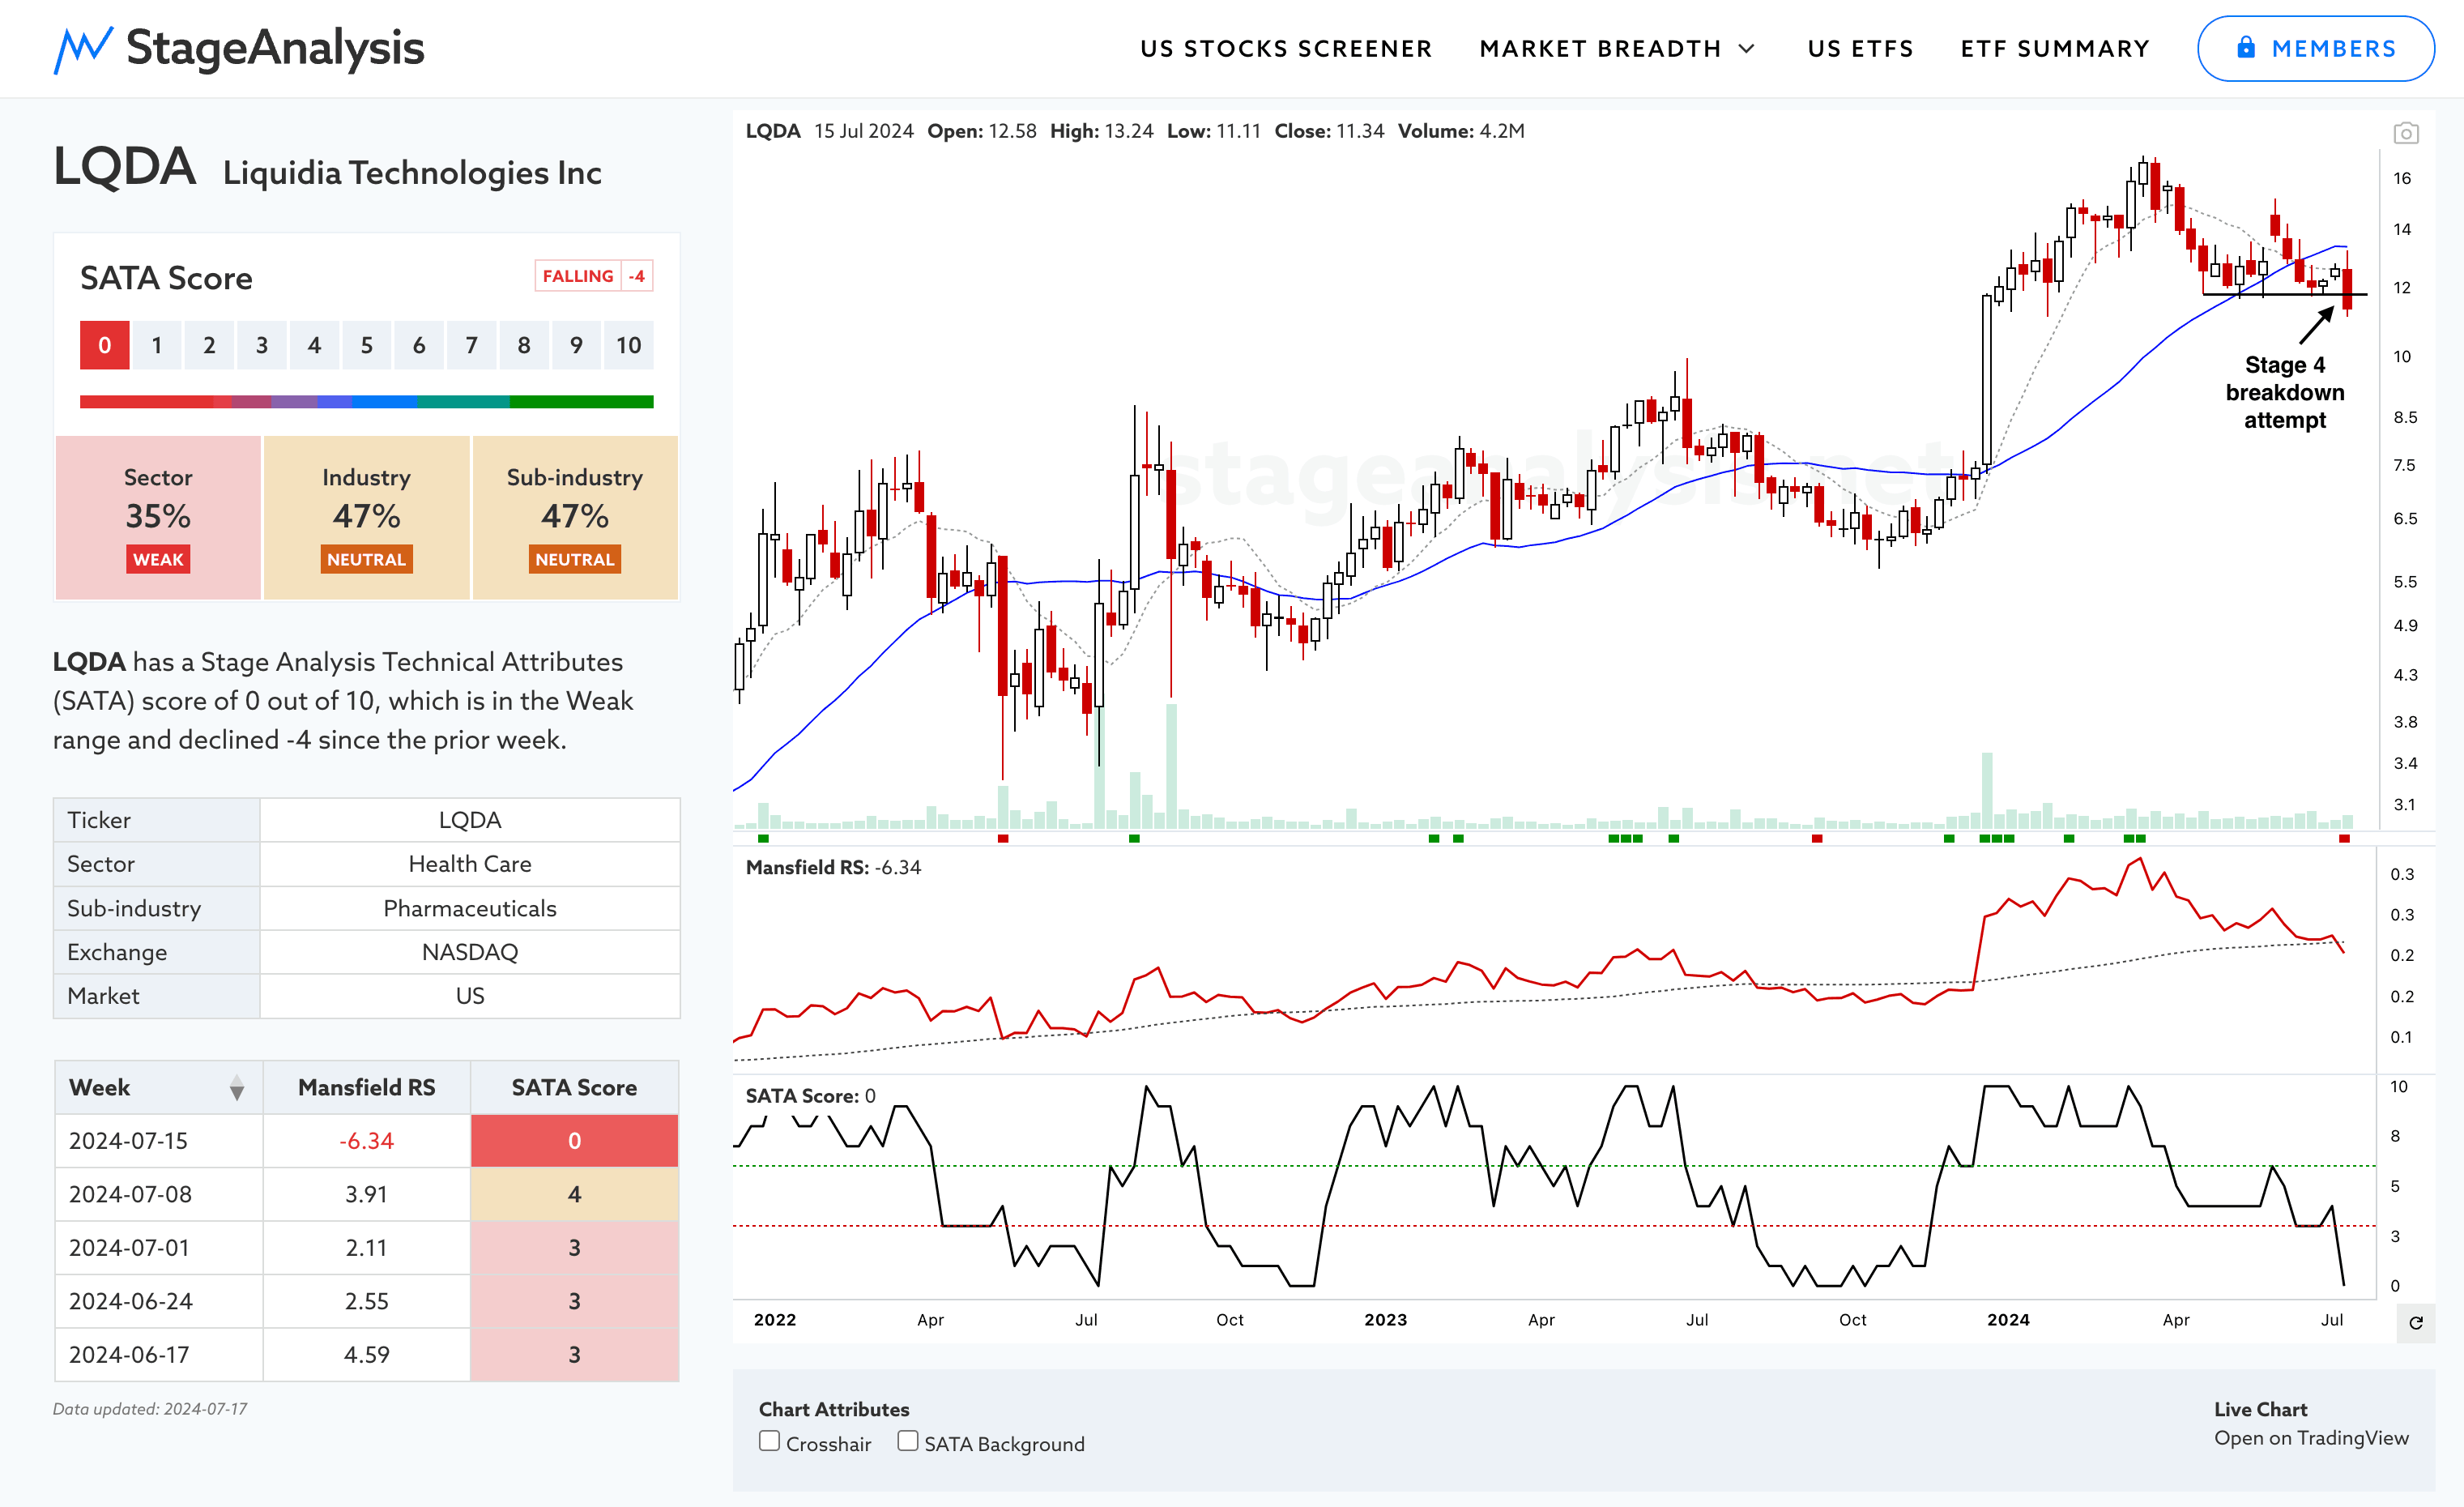
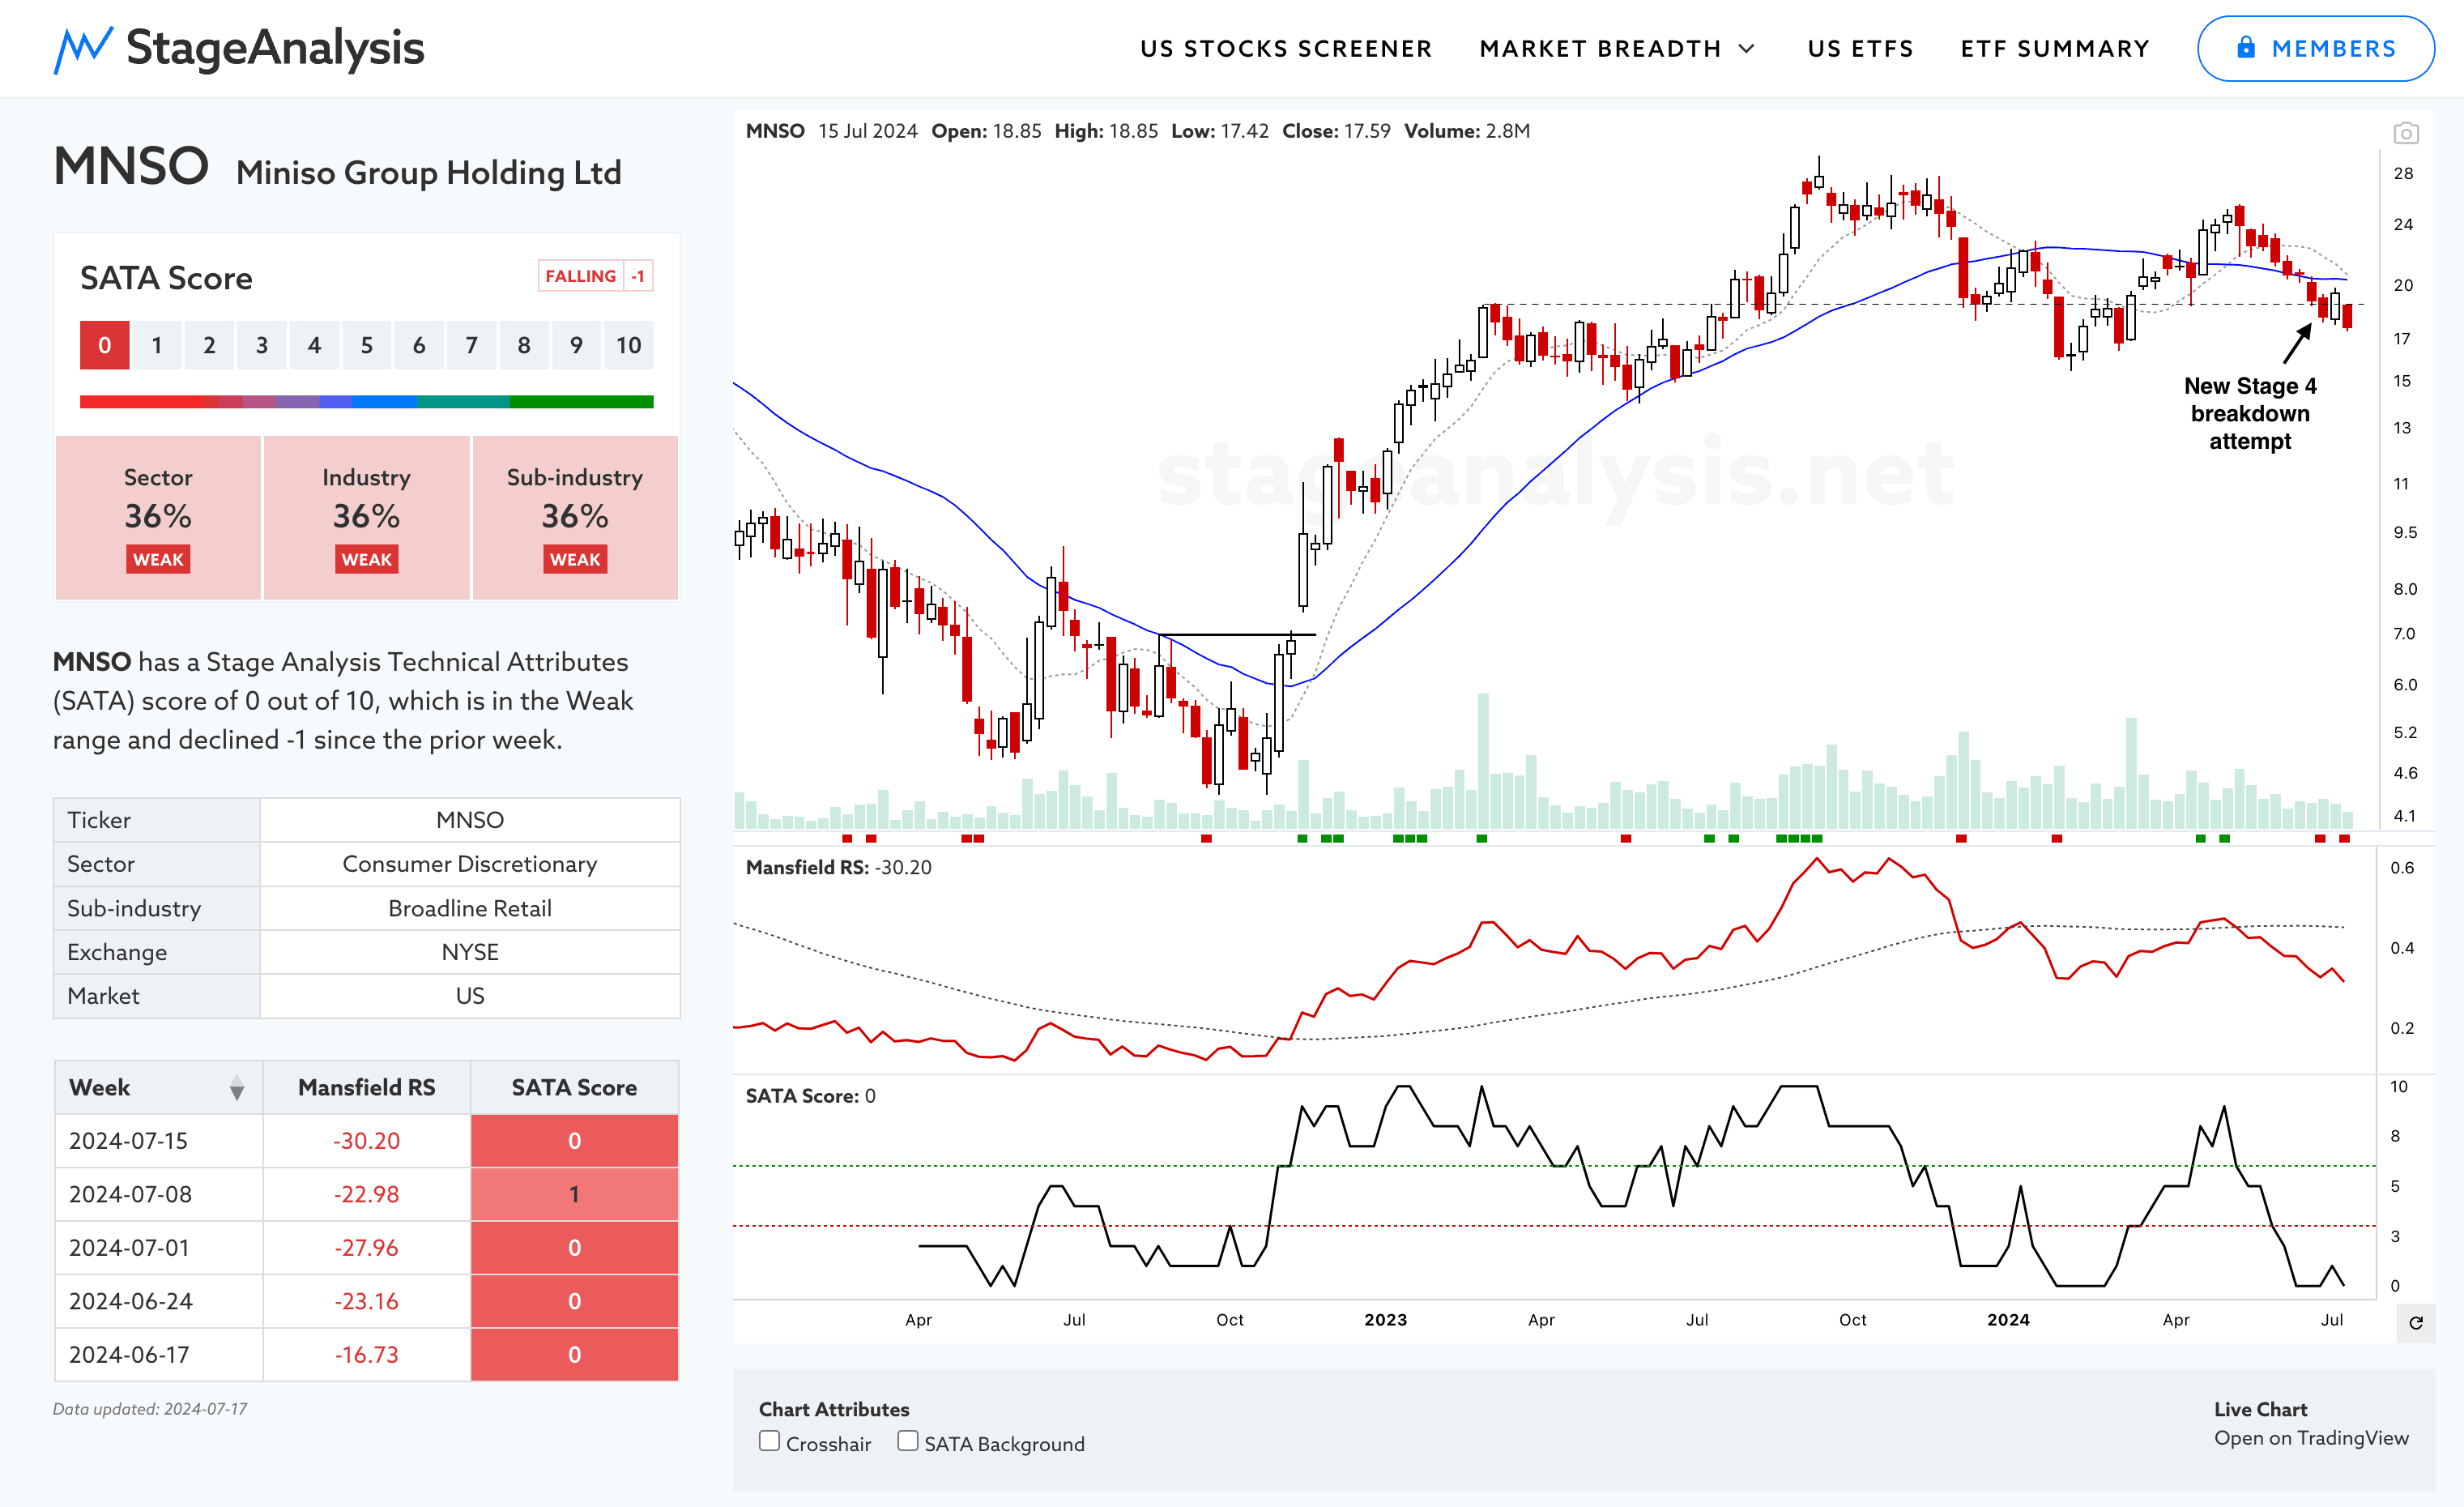
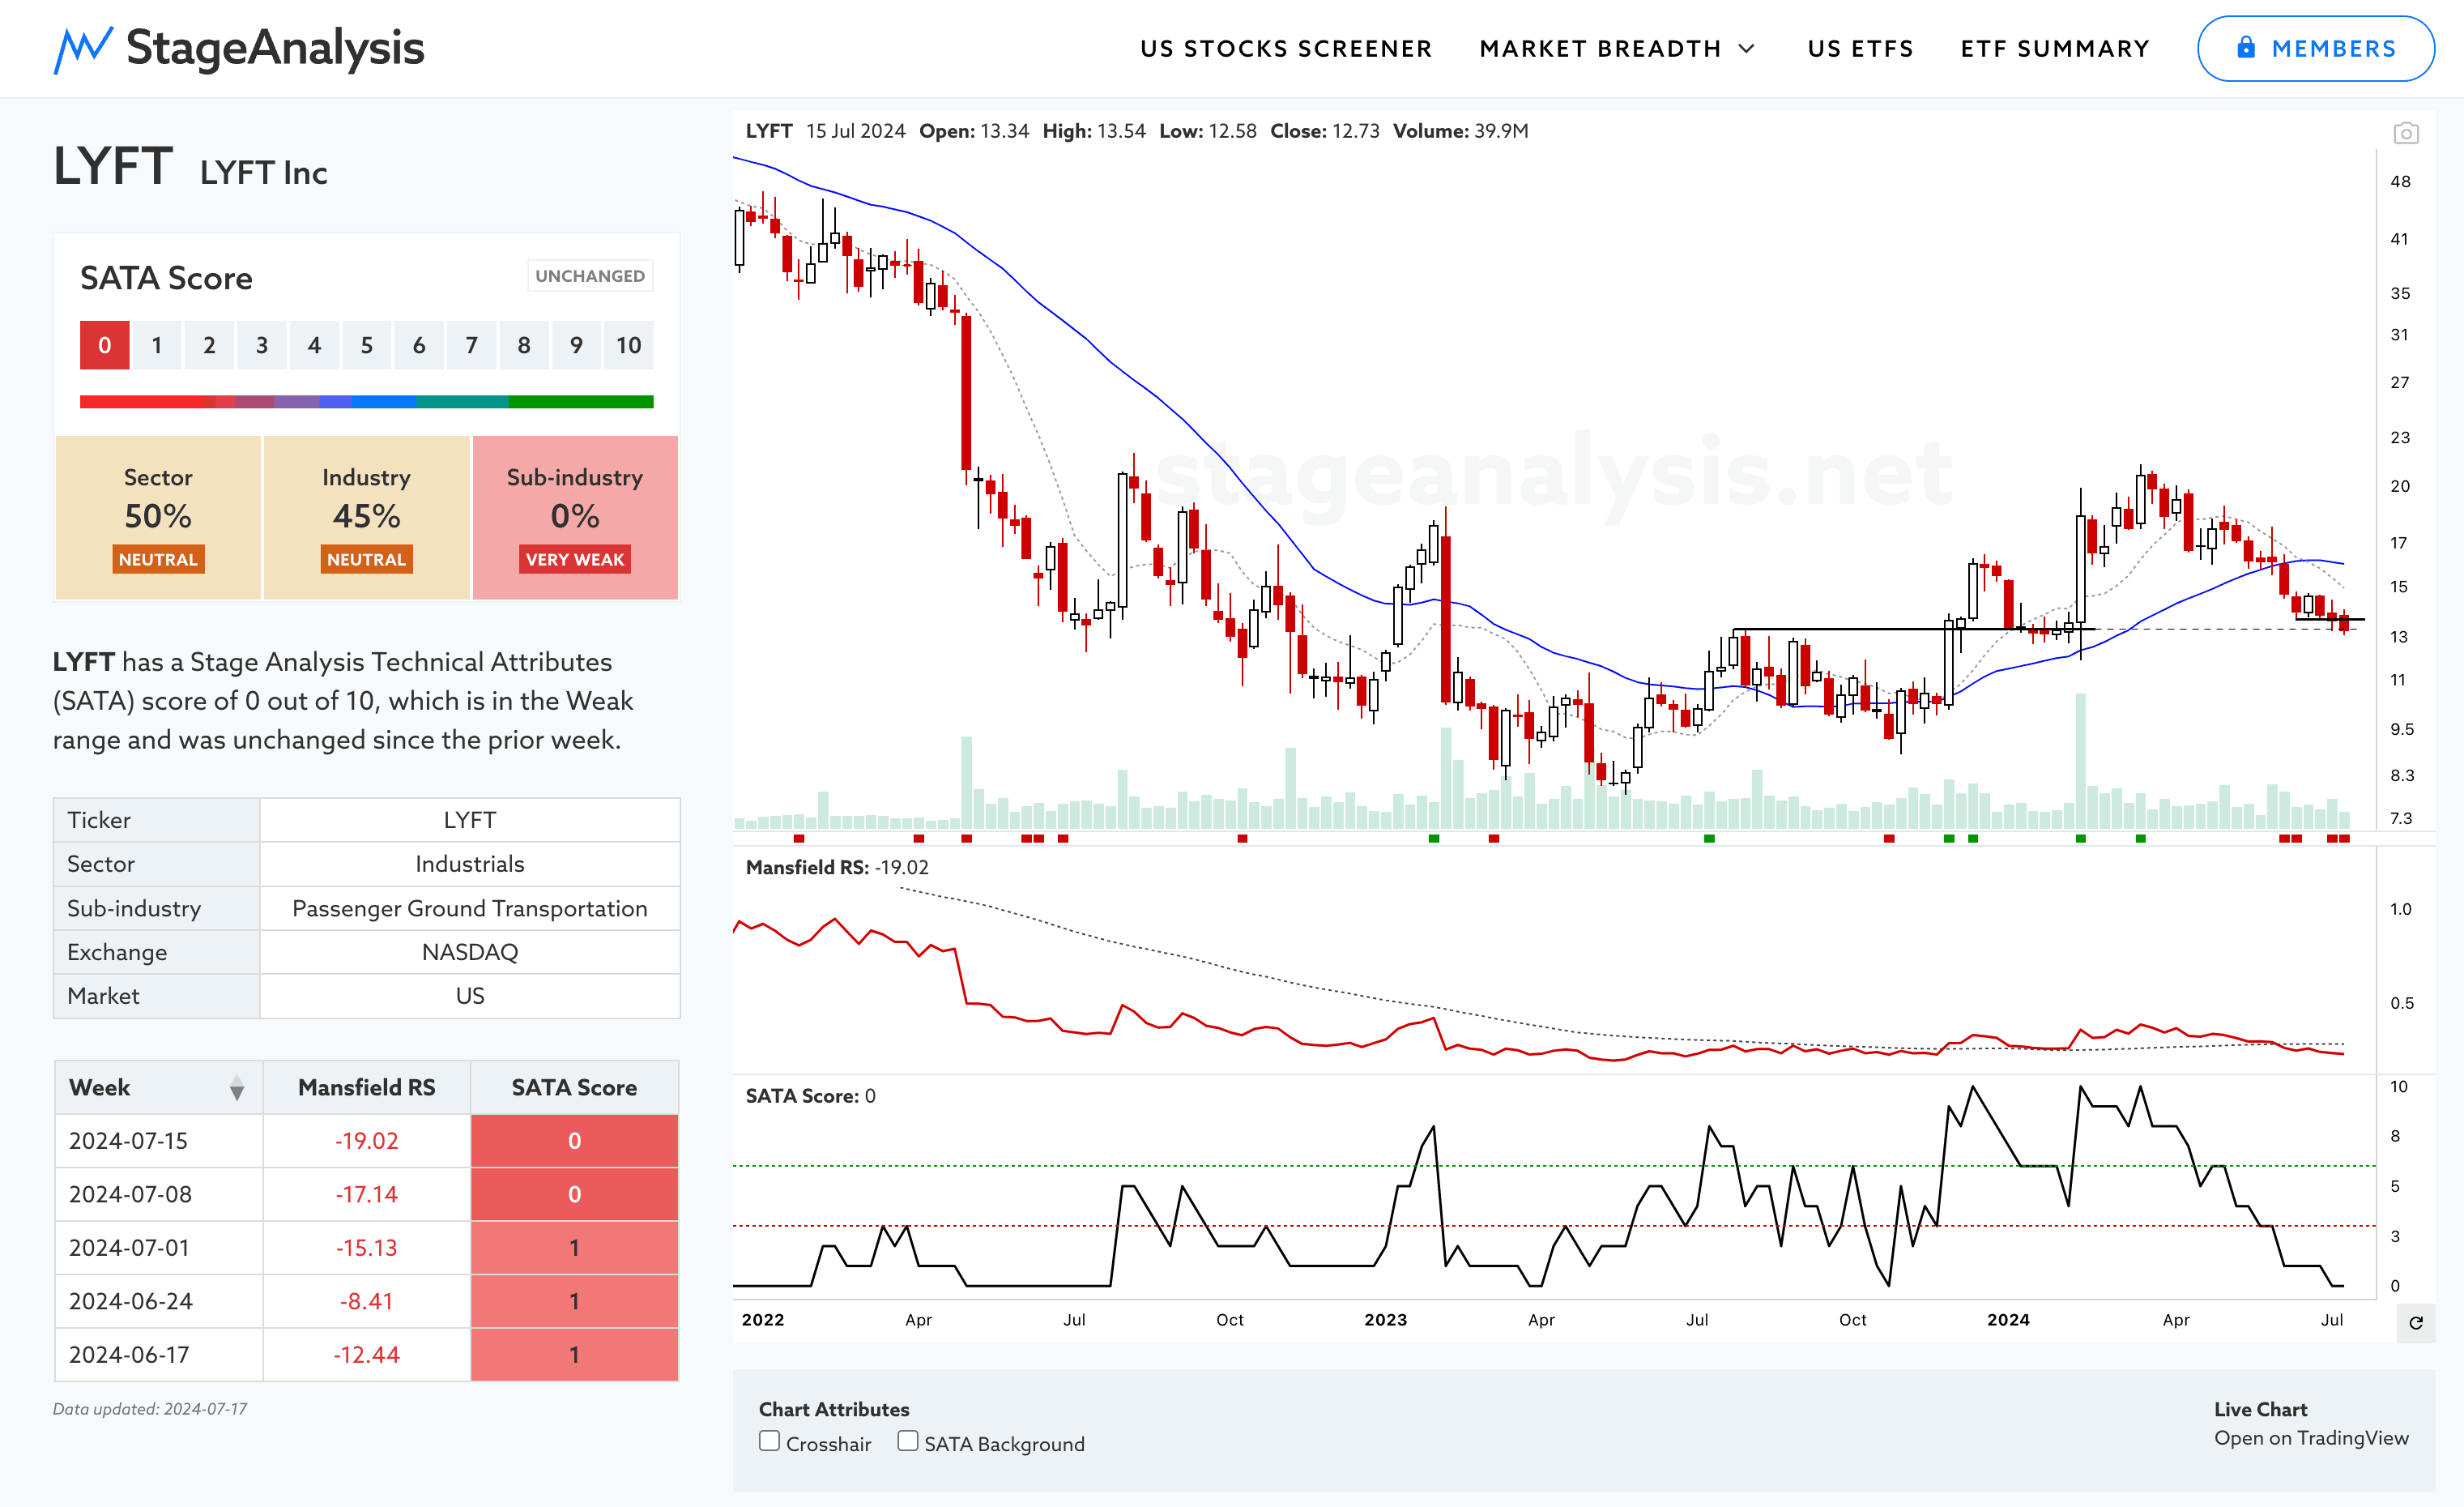
You should note some consistent themes with the stocks on the Stage 4 breakdown week, such as a declining 30 week MA (it's often the first week of its decline at the Stage 4 breakdown point, so can still look flattish), the Mansfield RS below the Zero line. The SATA score in the Weak range (SATA 0 to 3). A Breakdown – which is highlighted by the red square below the Volume bars on the weekly SATA chart and a number of other features. But just taking note of these few things at a glance can help you scan through lots of charts quickly and filter down the results.
From here you would want to take the research further as per the Forest to the Trees Approach in the method, by comparing the stocks to their peers and looking for potential group themes where multiple stocks in the same industry/sub-industry are developing in Stage 3 or have already broken down in to Stage 4. As we want to do the opposite to what we do with Stage 2 breakouts, by instead searching for weakening themes with Neutral or Weak SATA scores that are Stages 3 and 4, and then identifying the potential leaders on the downside in the group, instead of the upside. As then we can compare, and might potentially find better stocks within the groups with the most downside potential, or maybe none will be suitable. But the process helps us to find them, and is quick and efficient on the Stage Analysis website.
Anyway. I hope this has been helpful about finding stocks attempting to make Stage 4 breakdowns with the Stage Analysis Screener, but let me know if you have any questions.
Become a Stage Analysis Member:
To see more like this – US Stocks watchlist posts, detailed videos each weekend, use our unique Stage Analysis tools, such as the US Stocks & ETFs Screener, Charts, Market Breadth, Group Relative Strength and more...
Join Today
Disclaimer: For educational purpose only. Not investment advice. Seek professional advice from a financial advisor before making any investing decisions.