
US Stocks Industry Groups Relative Strength Rankings
The full post is available to view by members only. For immediate access:
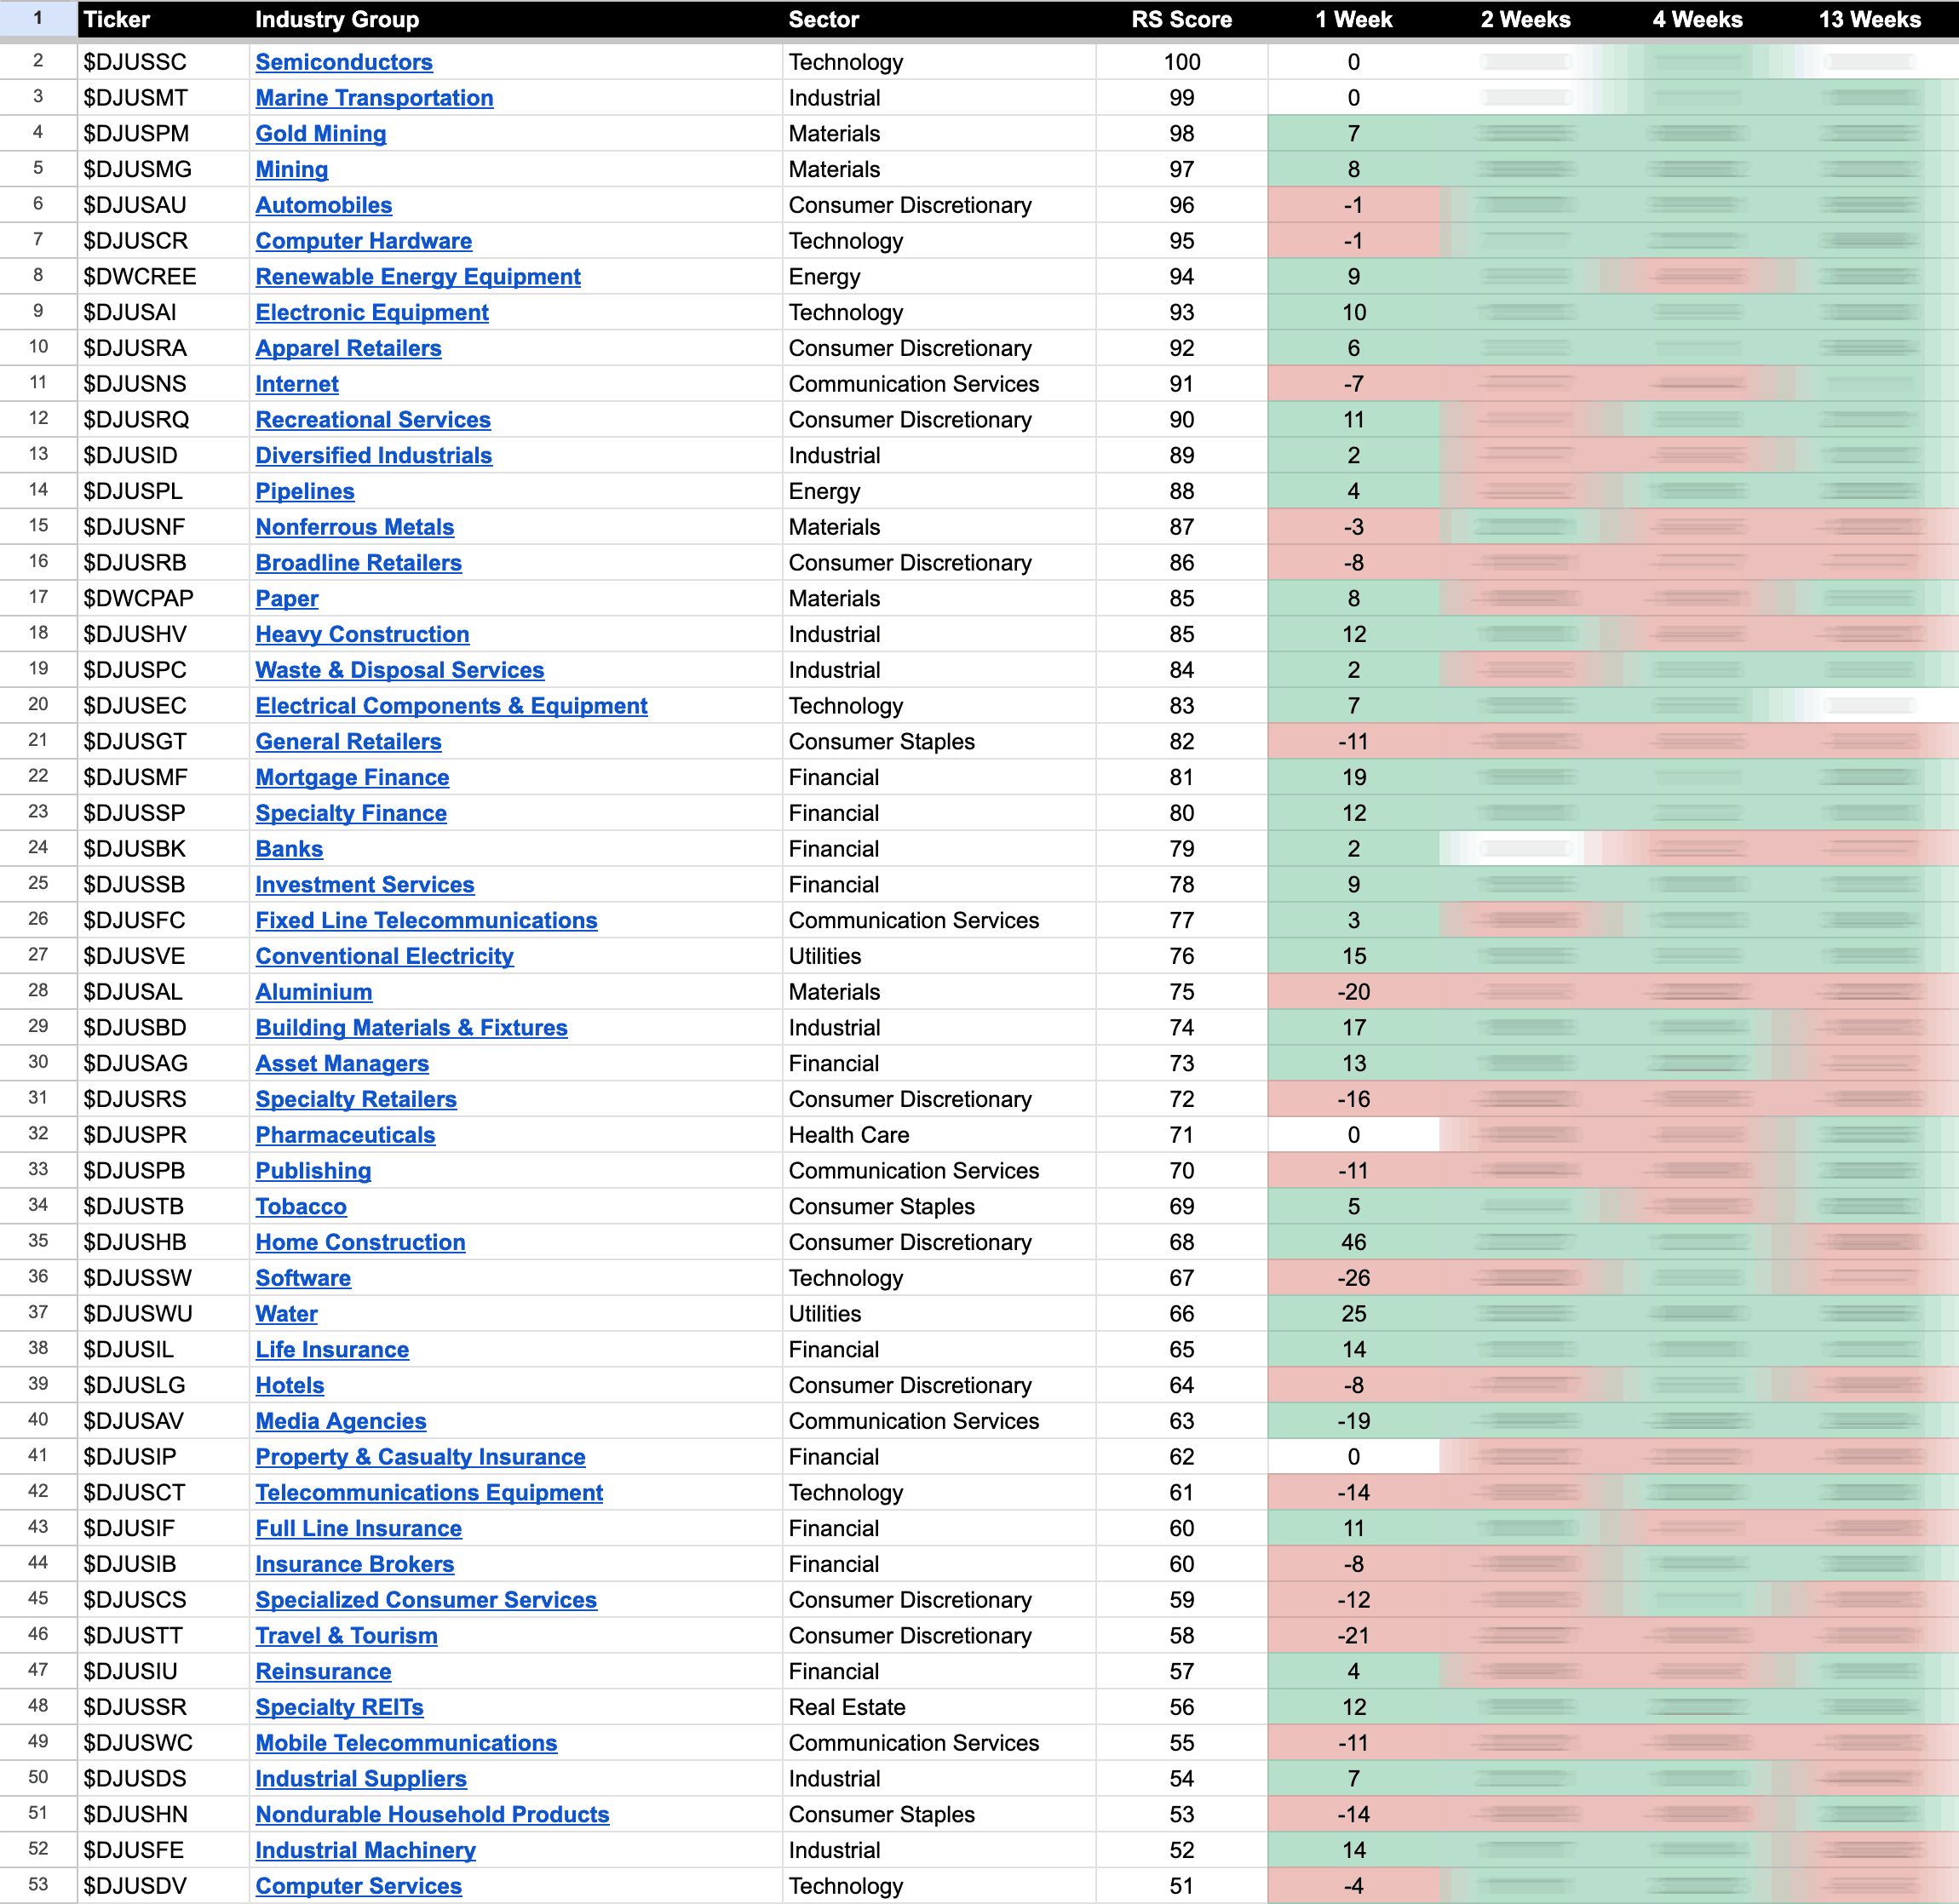
US Industry Groups by Highest RS Score
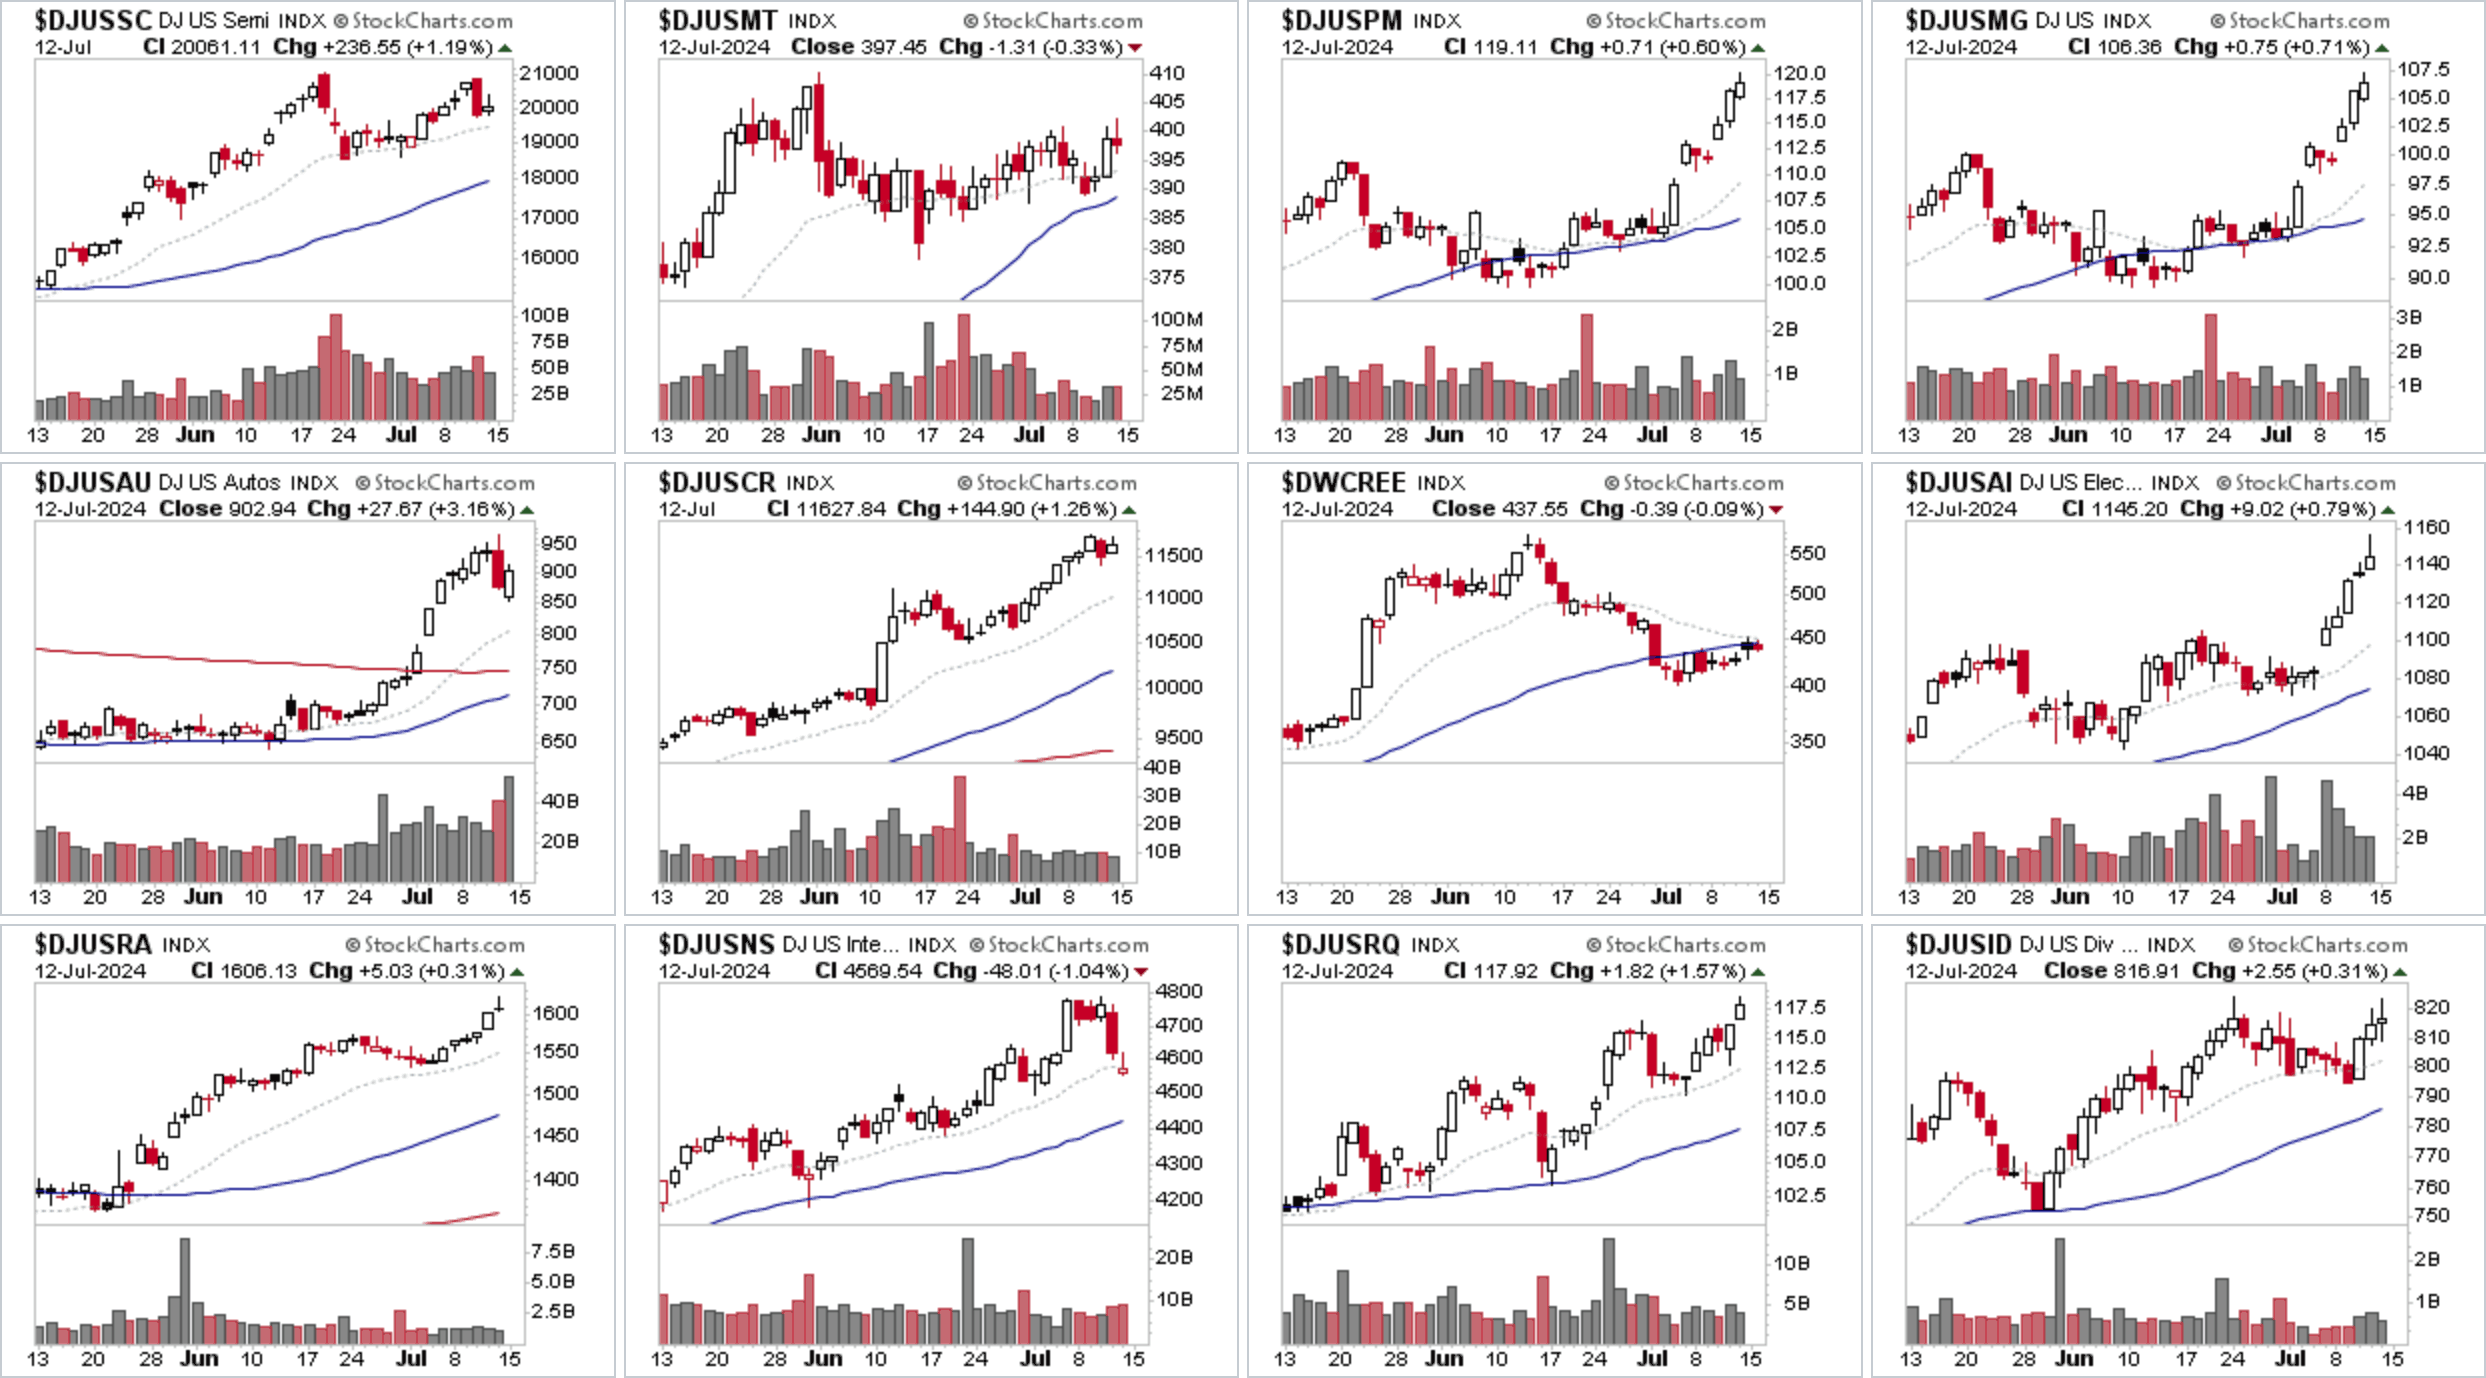
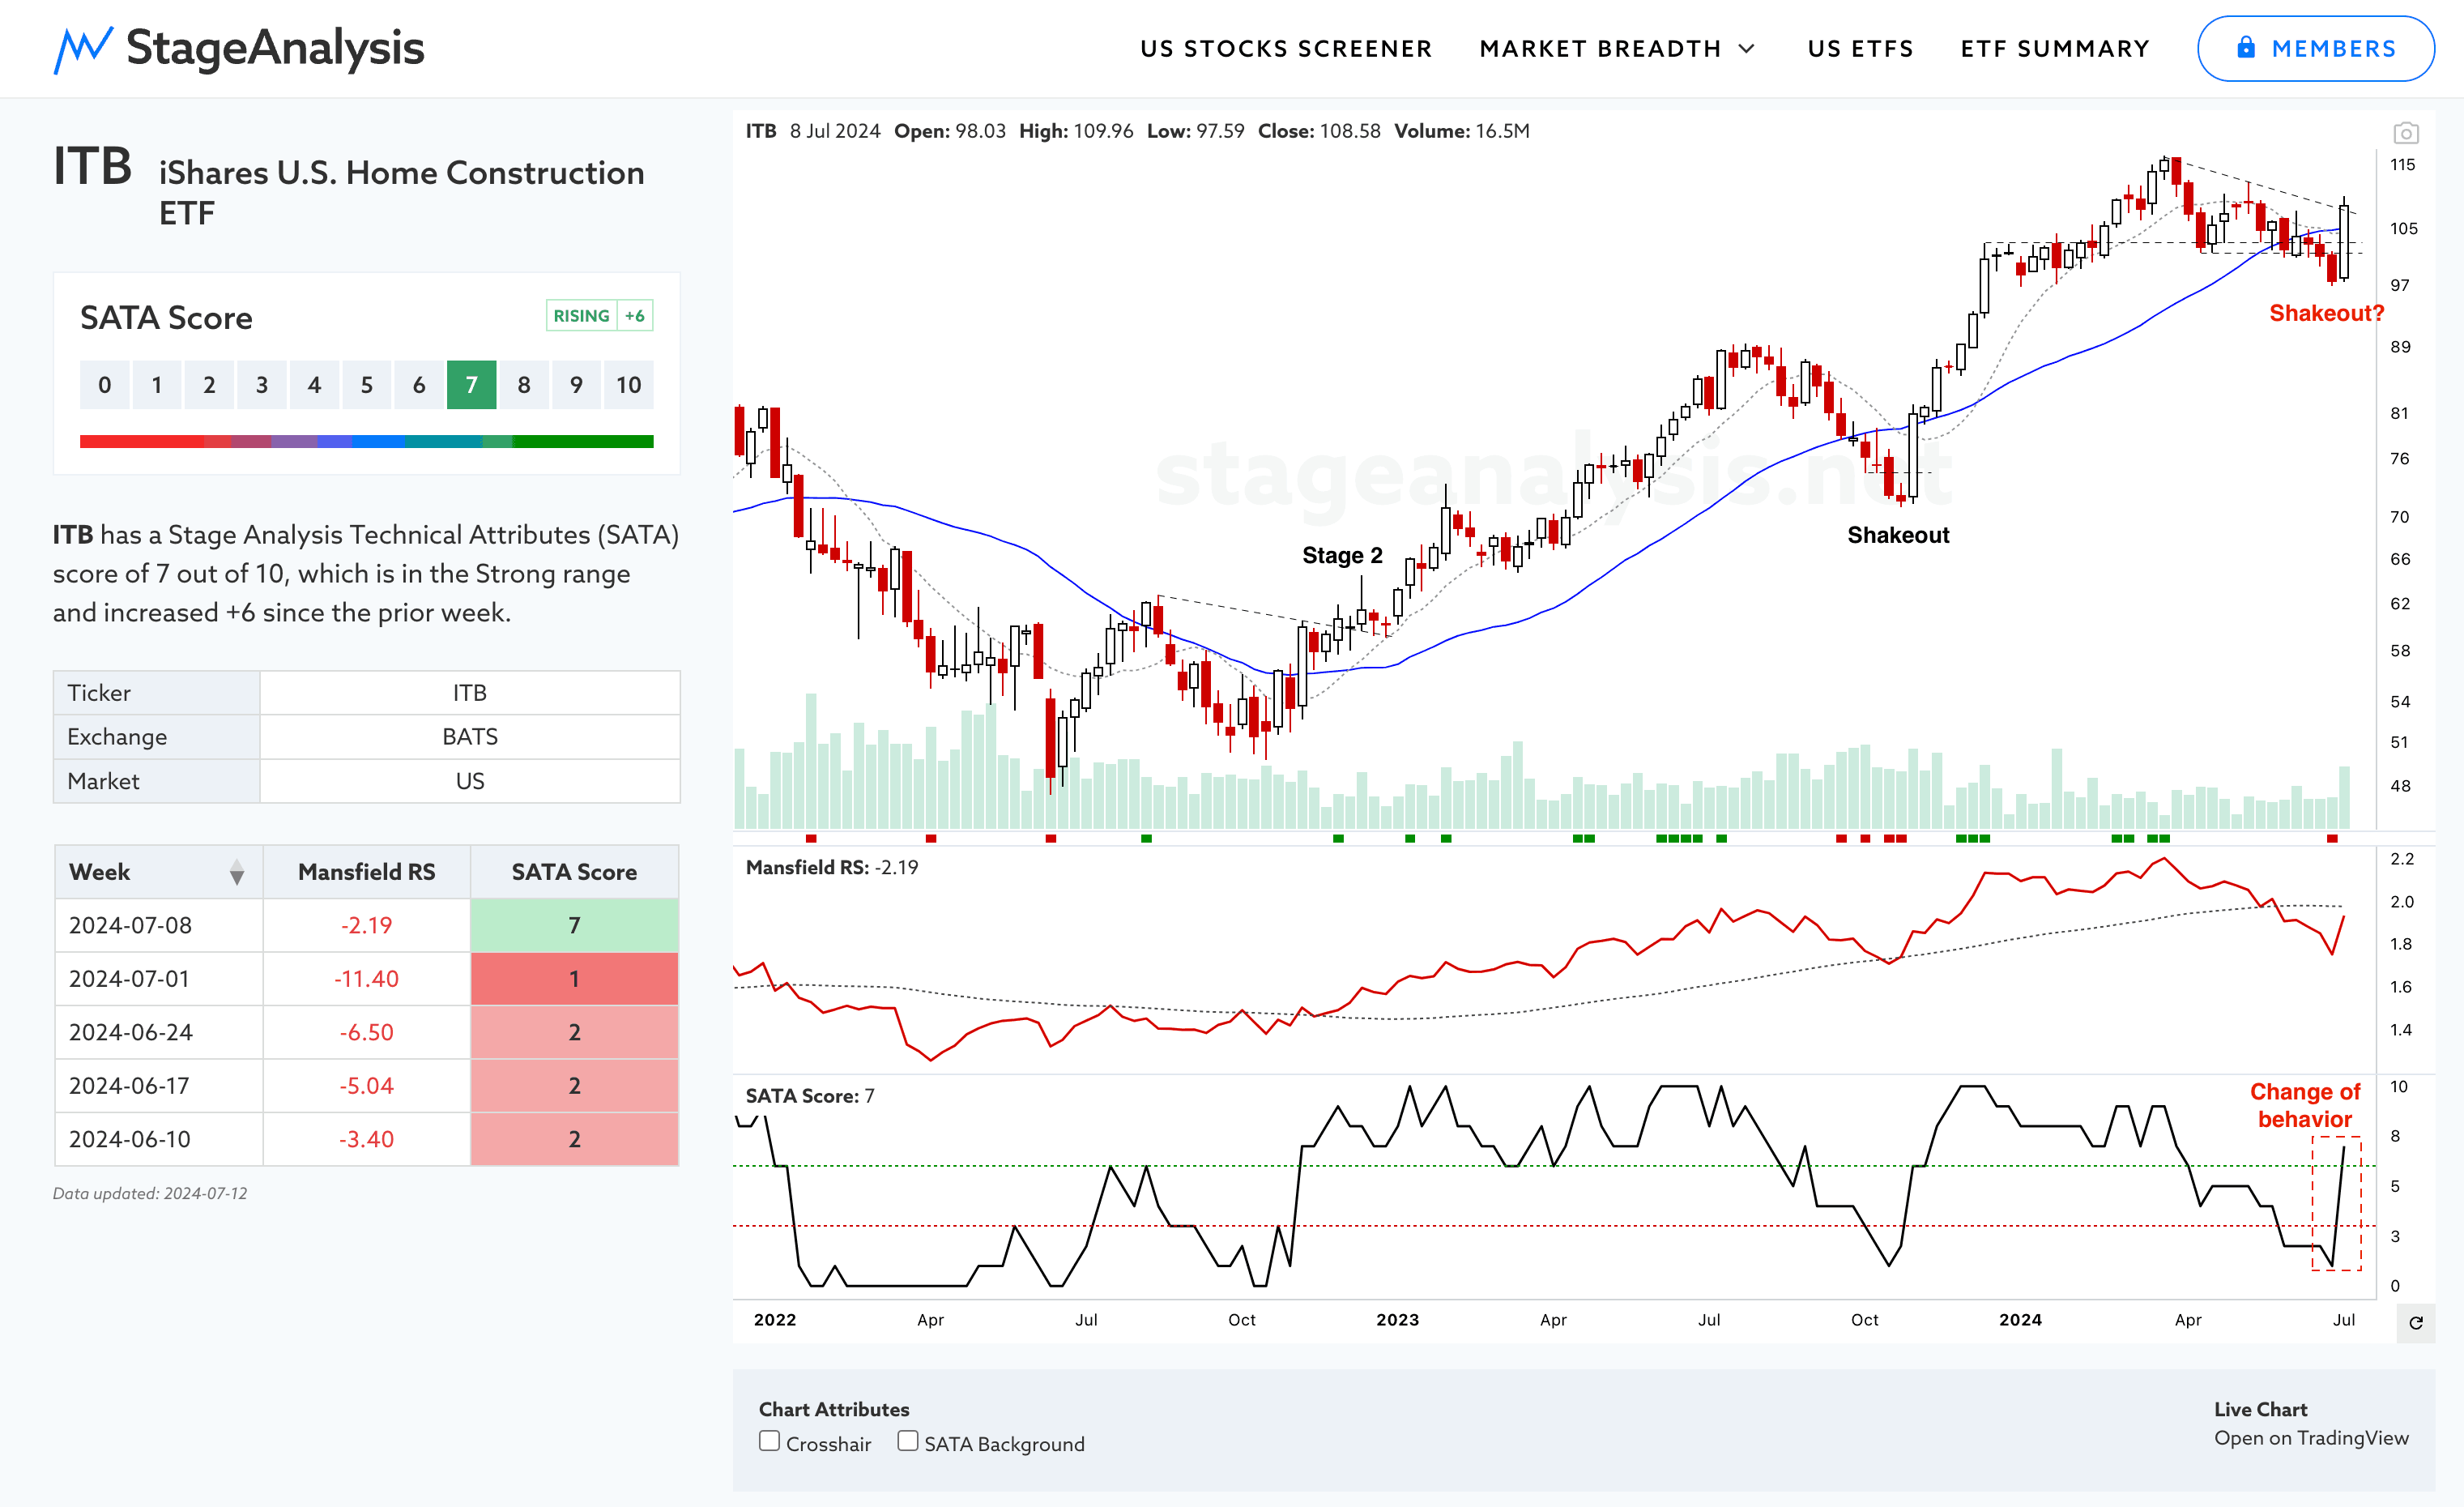
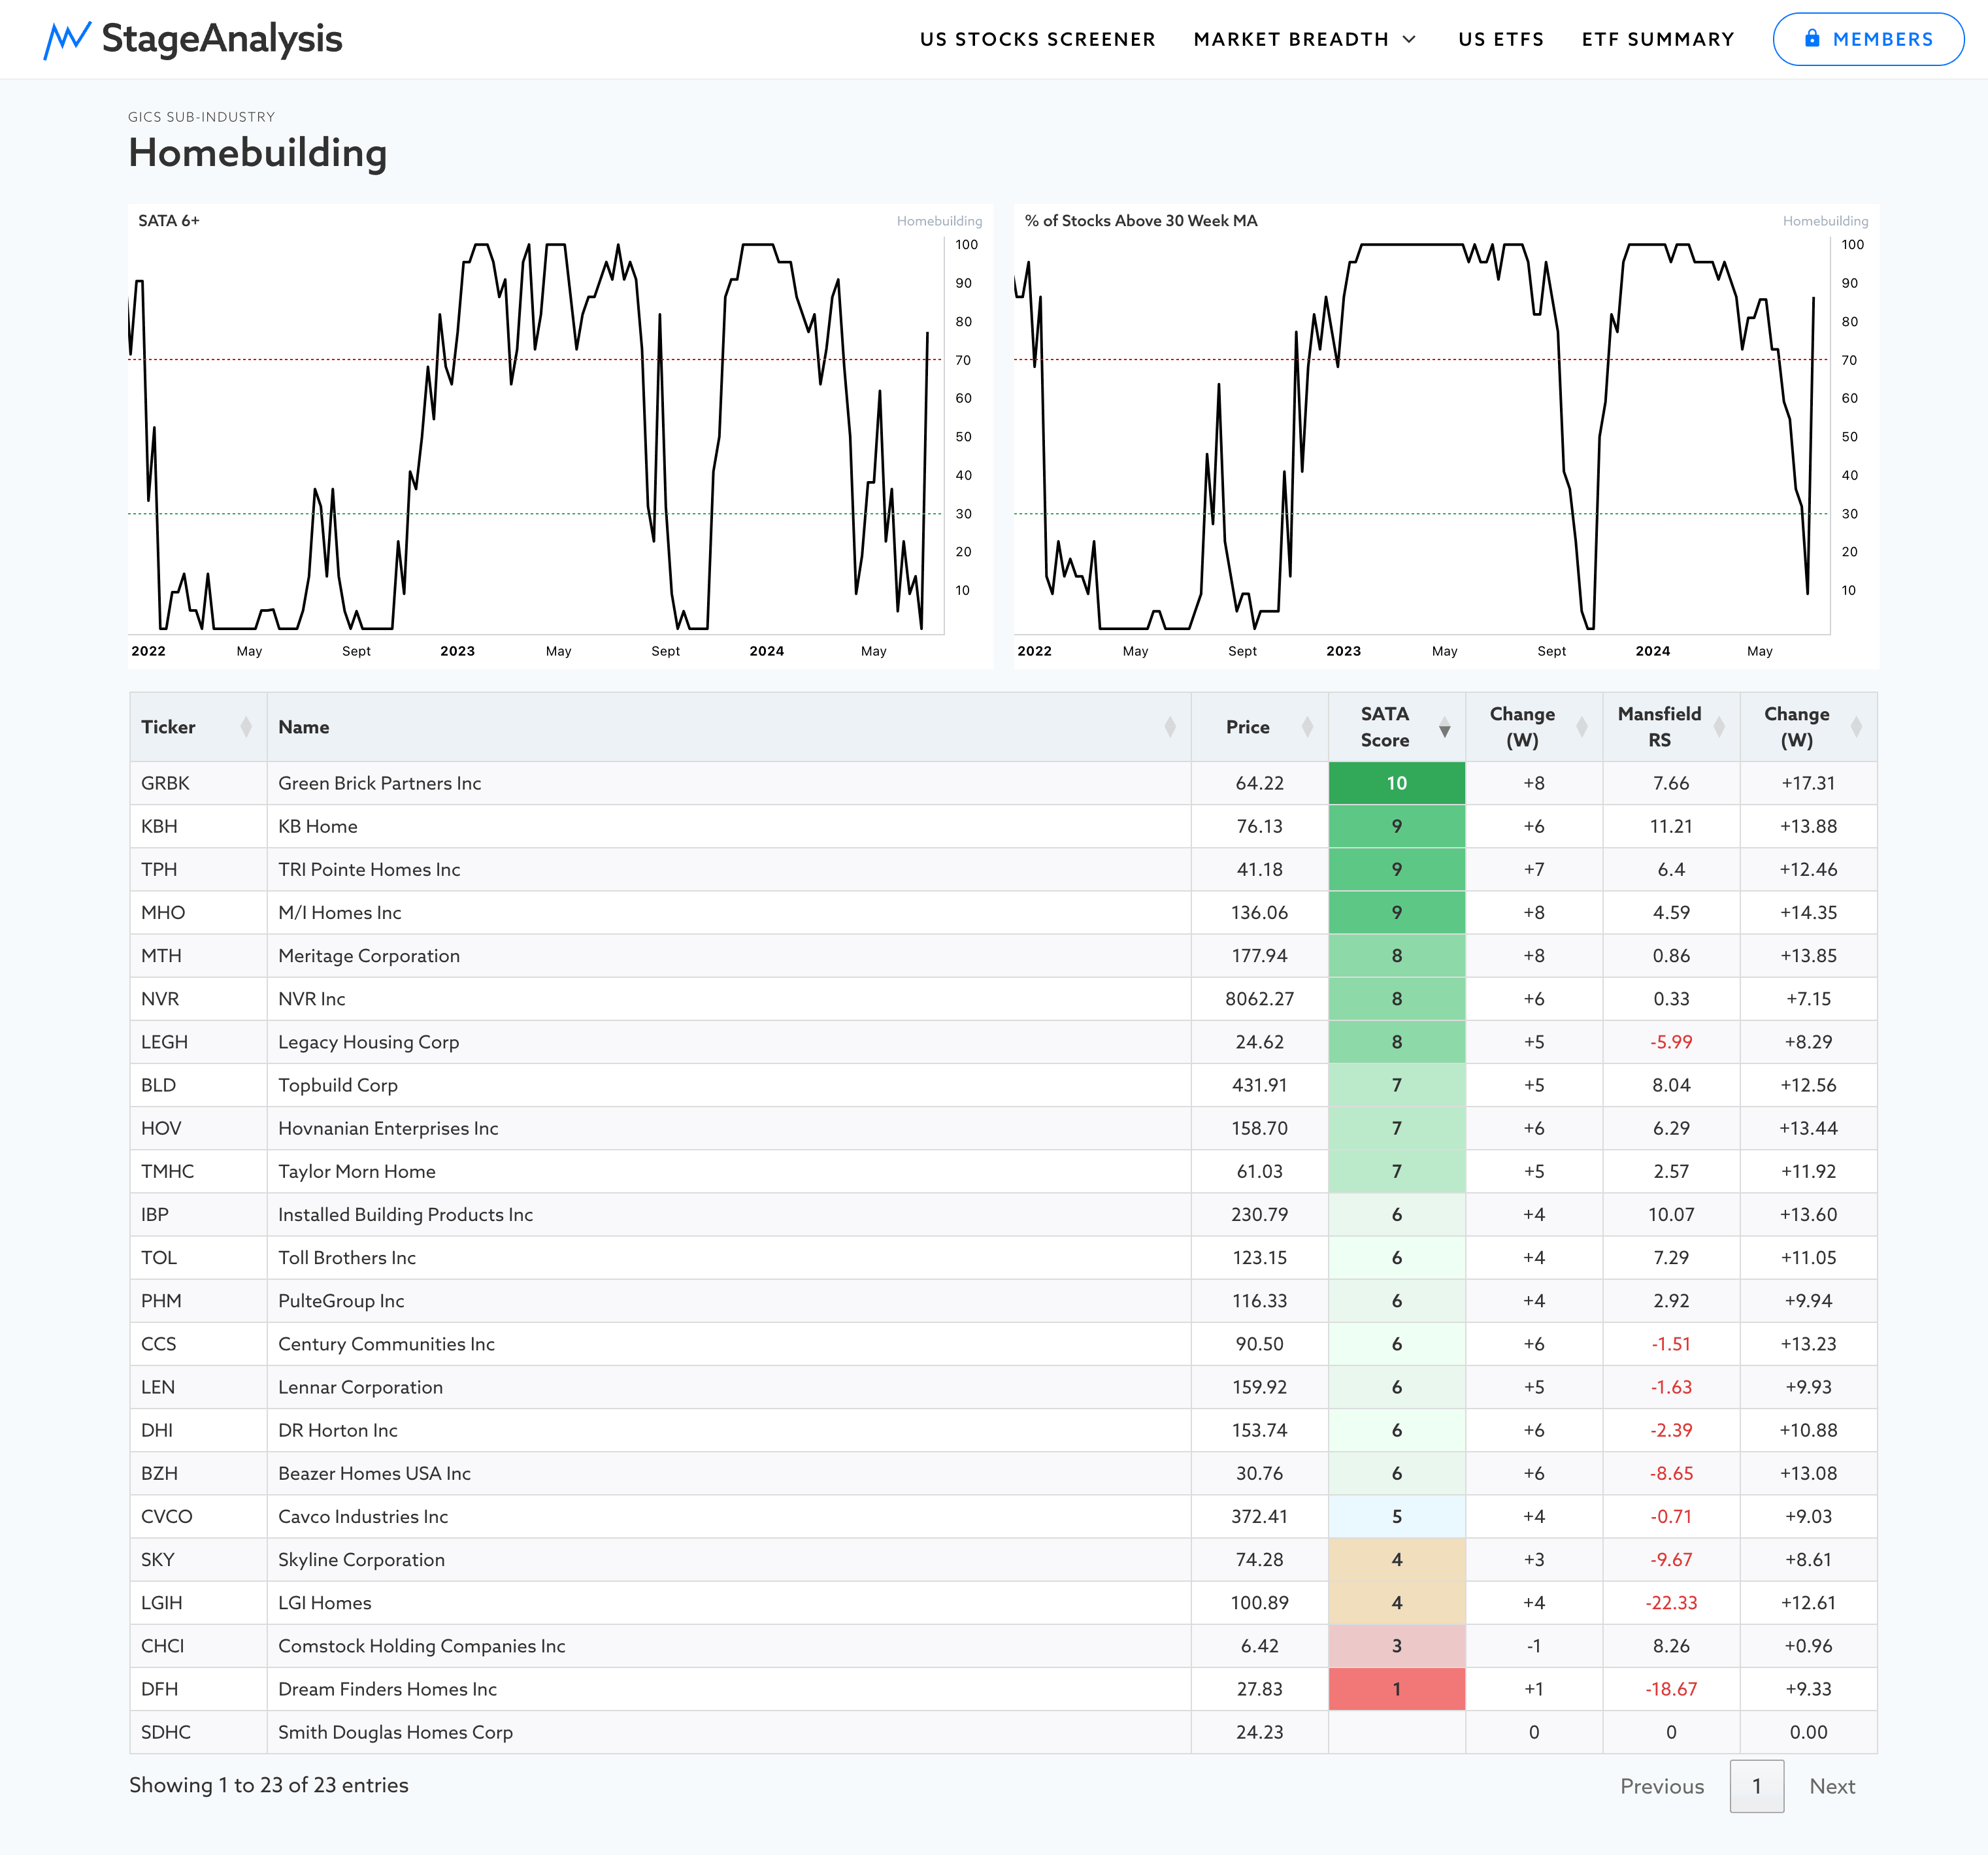
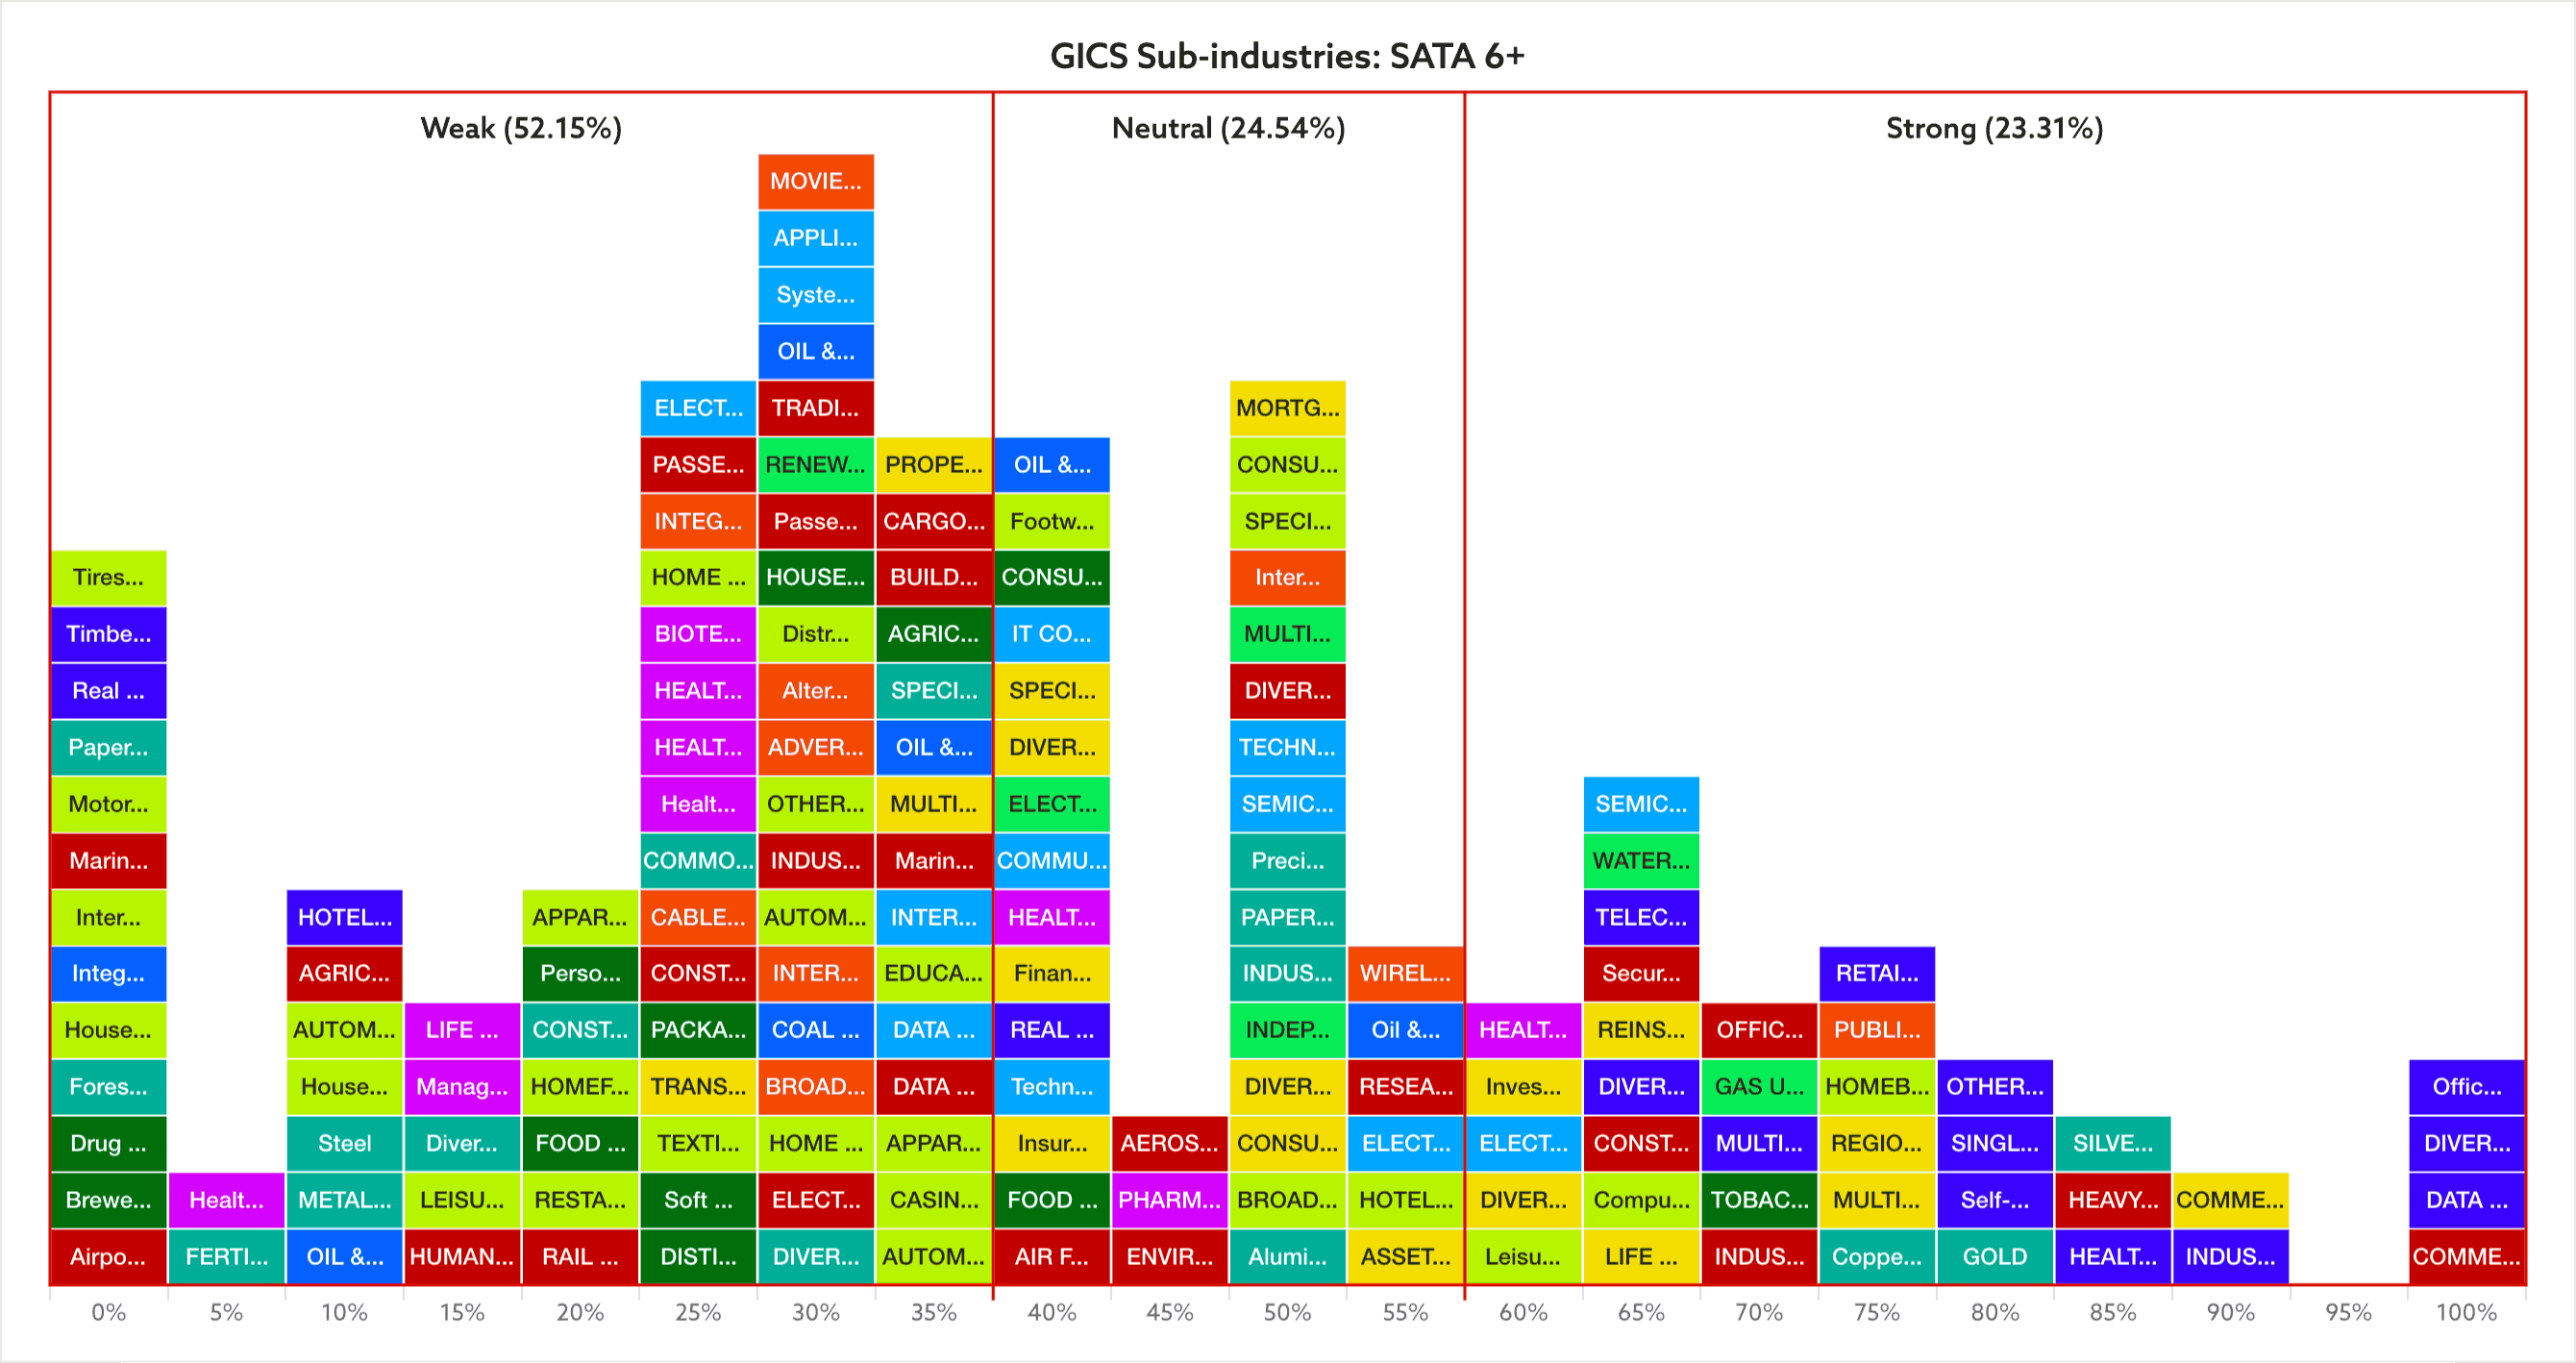
Homebuilding and the related groups were some of the most notable improvers this week in the Industry Groups Relative Strength (RS) Rankings moving up +46 RS points to 34th overall. But it was a much more pronounced change in the GICS Sub-industries data (see SATA 6+ chart below), as Homebuilding went from 0 stocks on a Stage Analysis Technical Attributes (SATA) score of 6 or greater, up to +77.27% now on a SATA 6+ (which means 77% of the groups stocks are now on a Strong SATA score).
So it was a dramatic change of behaviour for the group which only a week ago was bordering on a Stage 4 breakdown attempt. But has rebounded strongly from that pivotal point, with many stocks forming Wyckoff Springs.
To see the broader group use the GICS Industries called Household Durables – which you can view on its page or by using the Industry filter in the Stage Analysis Screener.
US Industry Groups by Weakest RS Score
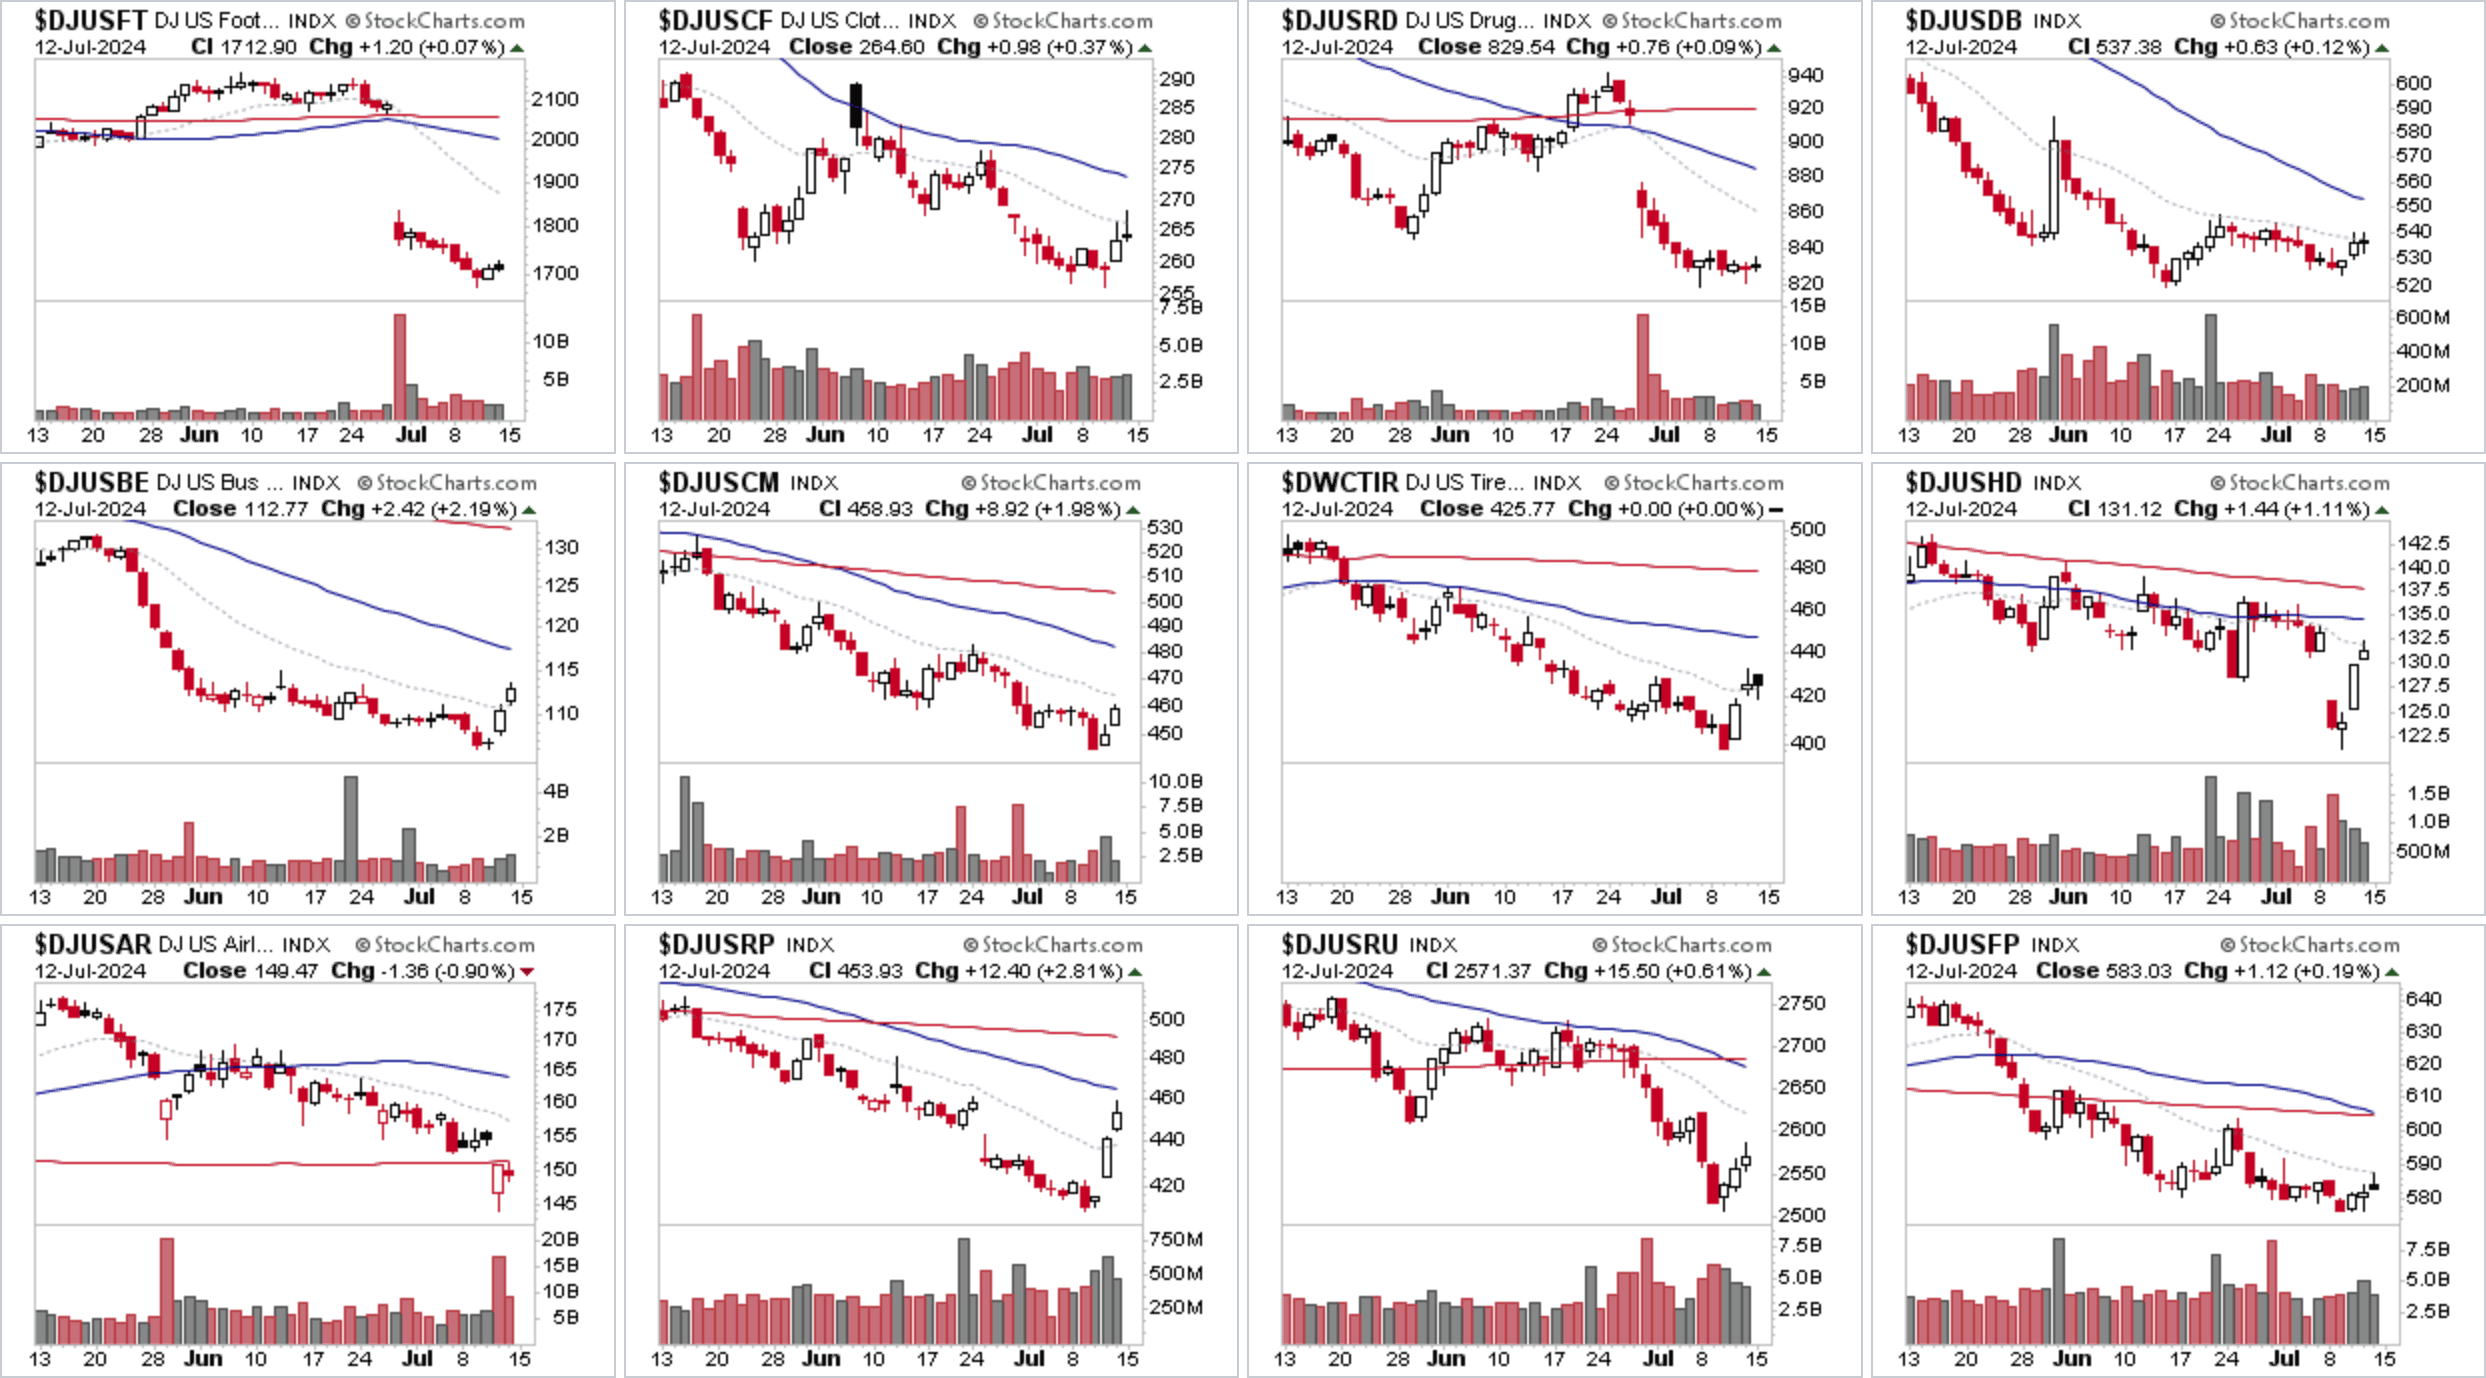
US Industry Groups sorted by Relative Strength
The purpose of the Relative Strength (RS) tables is to track the short, medium and long-term RS changes of the individual groups to find the new leadership earlier than the crowd.
RS Score of 100 is the strongest, and 0 is the weakest.
In the Stage Analysis method we are looking to focus on the strongest groups, as what is strong, tends to stay strong for a long time. But we also want to find the improving / up and coming groups that are starting to rise up strongly through the RS table from the lower zone, in order to find the future leading stocks before they break out from a Stage 1 base and move into a Stage 2 advancing phase.
Each week I go through the most interesting groups on the move in more detail during the Stage Analysis Members weekend video – as Industry Group analysis is a key part of Stan Weinstein's Stage Analysis method.

There are now multiple ways on the Stage Analysis website to view individual groups and sectors via the GICS Sub-industries (123), Industries (74) and Groups (25) pages and the new US Stocks Screener, in which you can easily filter via the Sectors and Sub-industries to see the component stocks and their current SATA and Mansfield RS data.
Note: The GICS Sub-industries, Industries and Groups are different to the DJ US Industry Groups used in this post, which I'm gradually retiring as the new Stage Analysis tools are developed, and will be moving this post over to use the GICS Industries or Sub-Industries data in the coming months.
Become a Stage Analysis Member:
To see more like this and other premium content, such as the regular US Stocks watchlist, detailed videos and intraday posts, become a Stage Analysis member.
Join Today
Disclaimer: For educational purpose only. Not investment advice. Seek professional advice from a financial advisor before making any investing decisions.