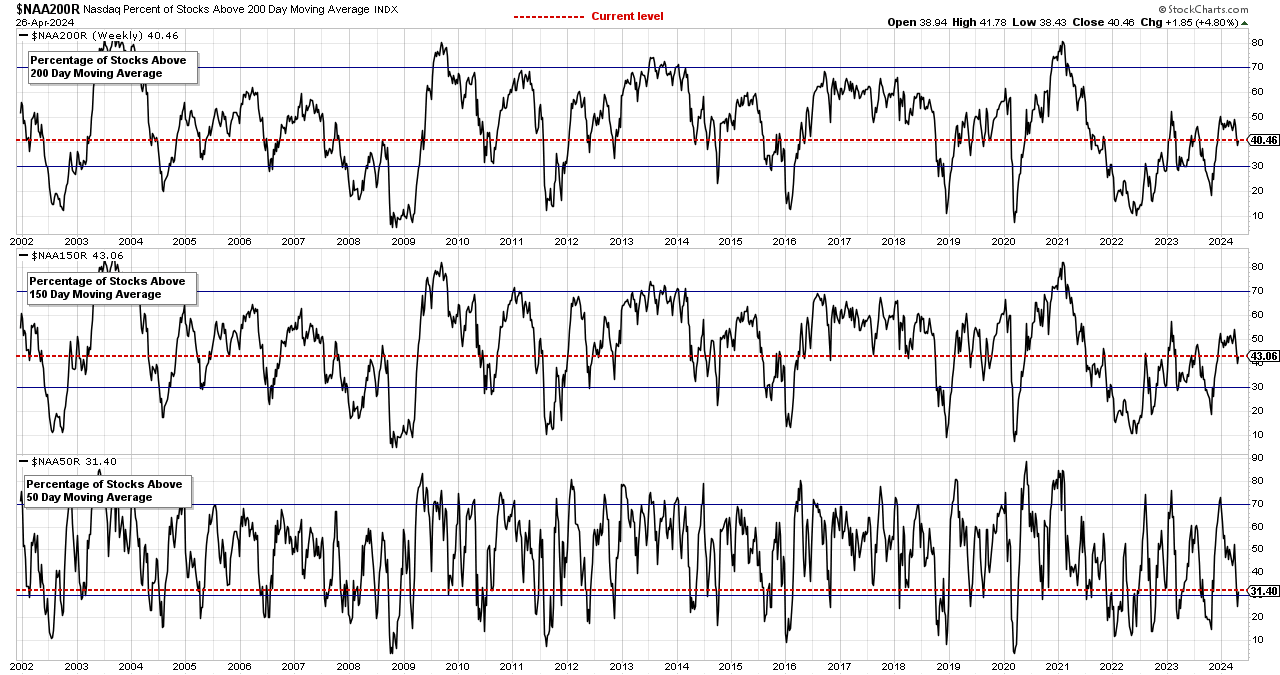
Market Breadth: Percentage of Stocks Above their 50 Day, 150 Day & 200 Day Moving Averages Combined
The full post is available to view by members only. For immediate access:
Custom percentage of stocks above their 50 day, 150 day & 200 day moving averages combined market breadth charts for the overall US market, NYSE and Nasdaq for market timing and strategy.
These key market breadth charts and data are reviewed every weekend for the Stage Analysis members and are also discussed in detail during the weekend videos as part of the Market Breadth section of the video, that looks at multiple breadth measures in order to determine the Weight of Evidence. Which is a crucial aspect of Stan Weinstein's Stage Analysis method in order to use the method successfully.
This weeks post is for Stage Analysis Members only, but you can see a full, unlocked post from the beginning of November as an example if you are interested in seeing this data each week. Go to: Market Breadth: Percentage of Stocks Above their 50 Day, 150 Day & 200 Day Moving Averages Combined – 3 November 2023
Become a Stage Analysis Member:
To see more like this and other premium content, such as the regular US Stocks watchlist, detailed videos and intraday posts, become a Stage Analysis member.
Join Today
Disclaimer: For educational purpose only. Not investment advice. Seek professional advice from a financial advisor before making any investing decisions.

