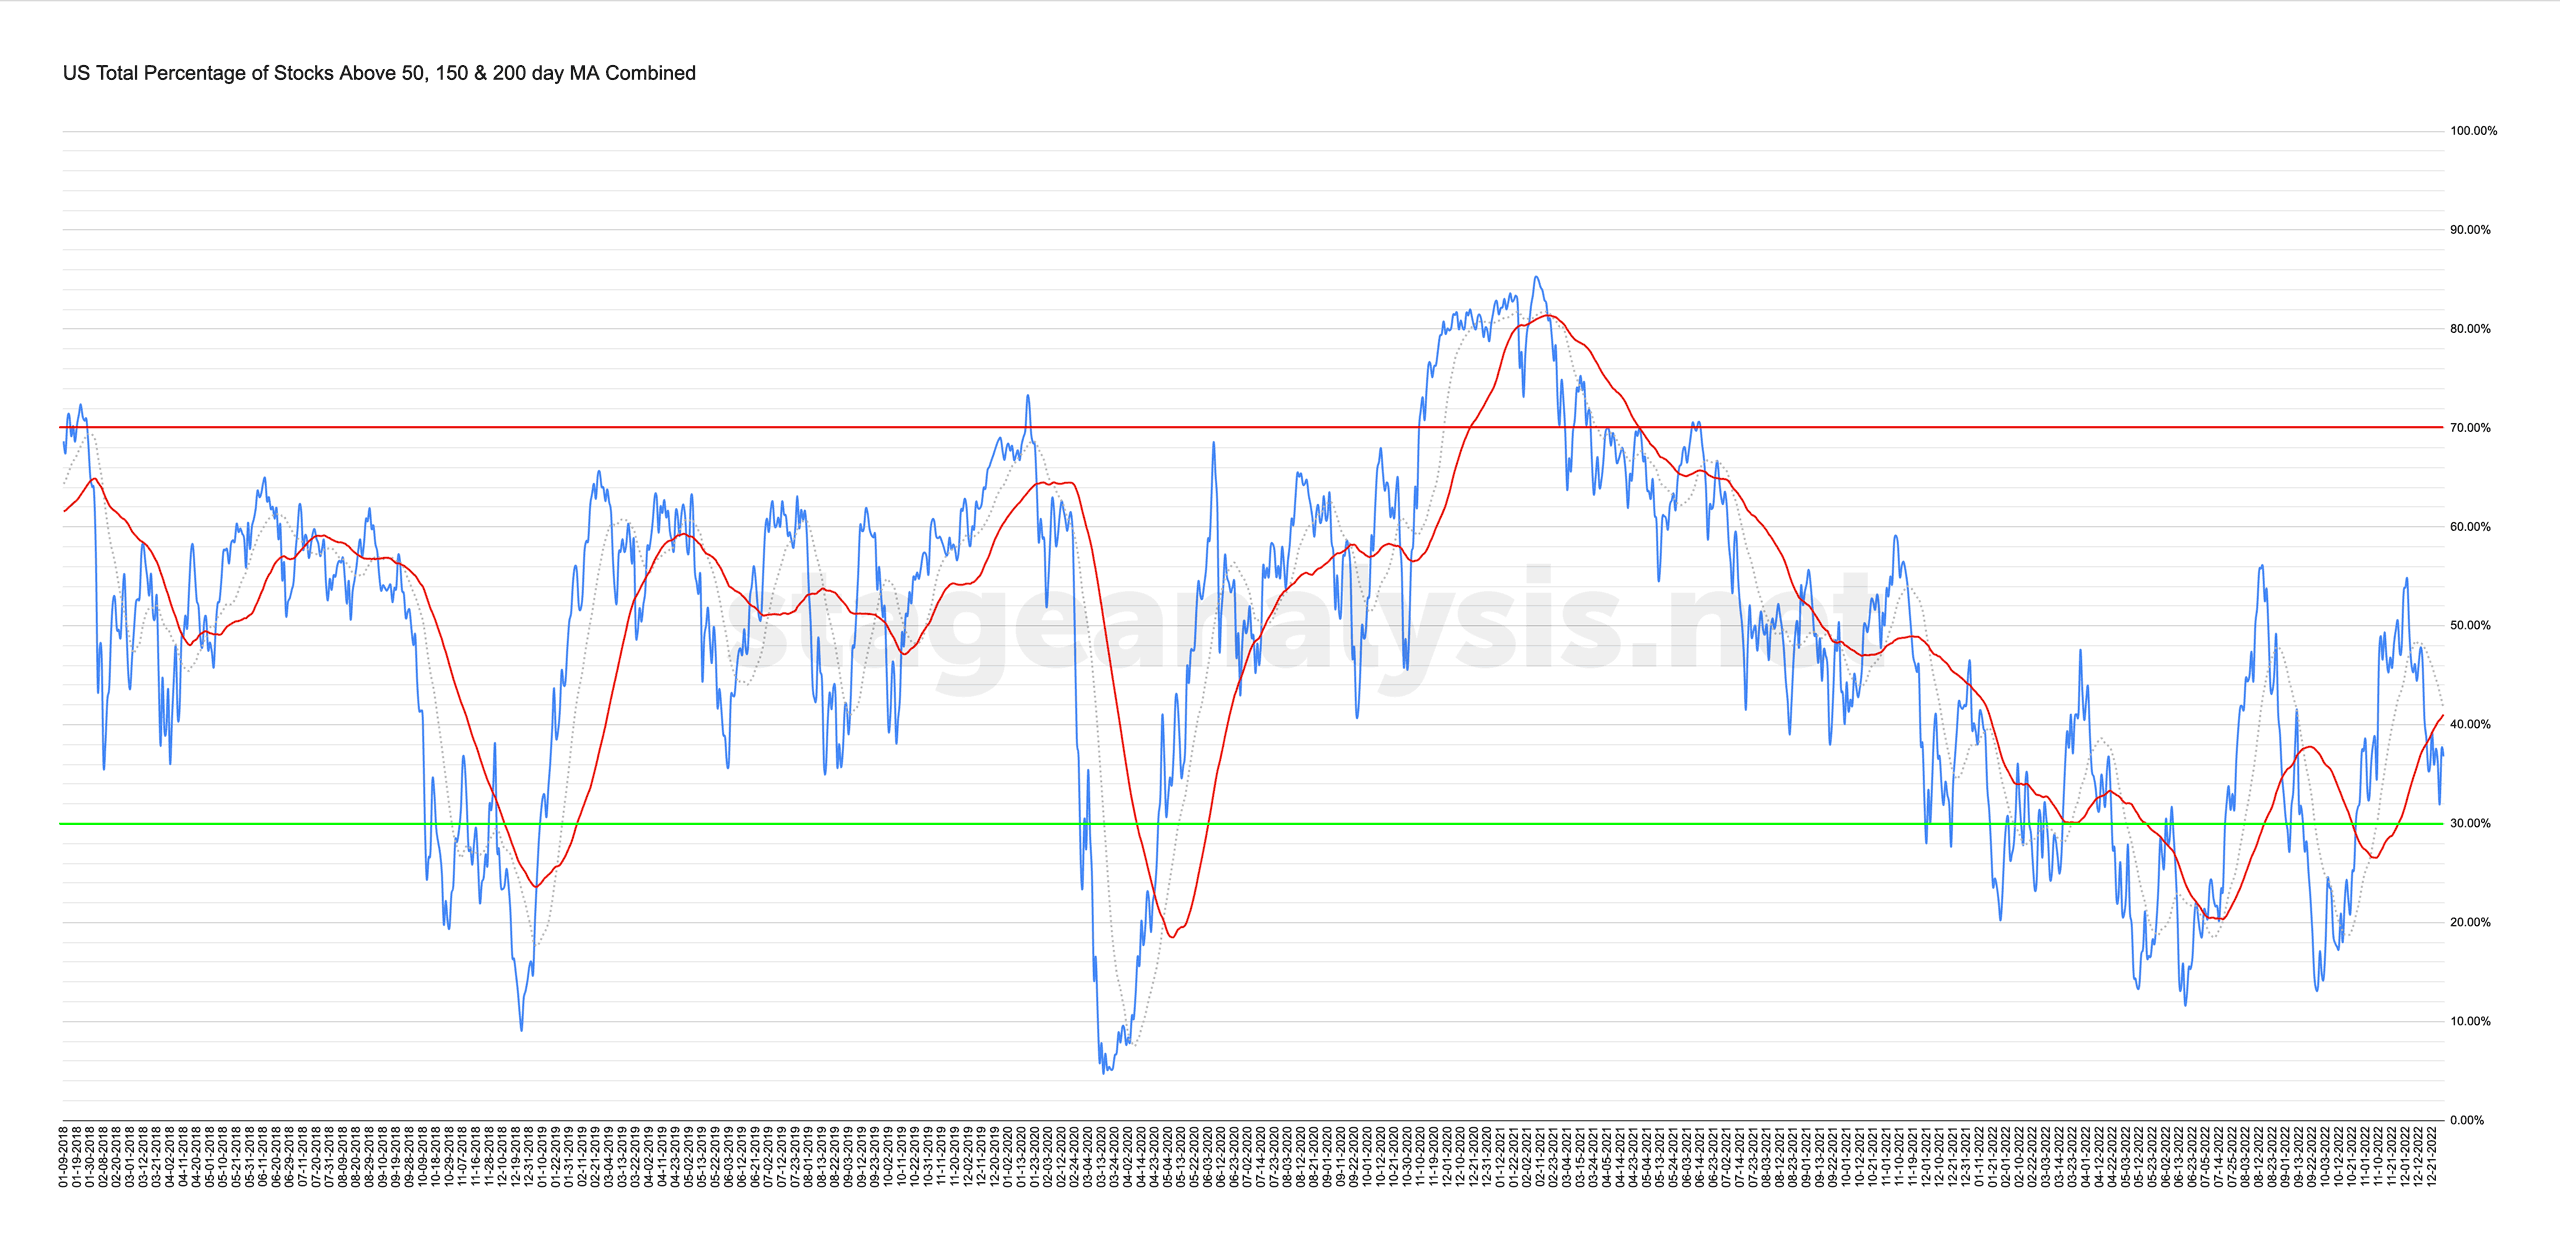
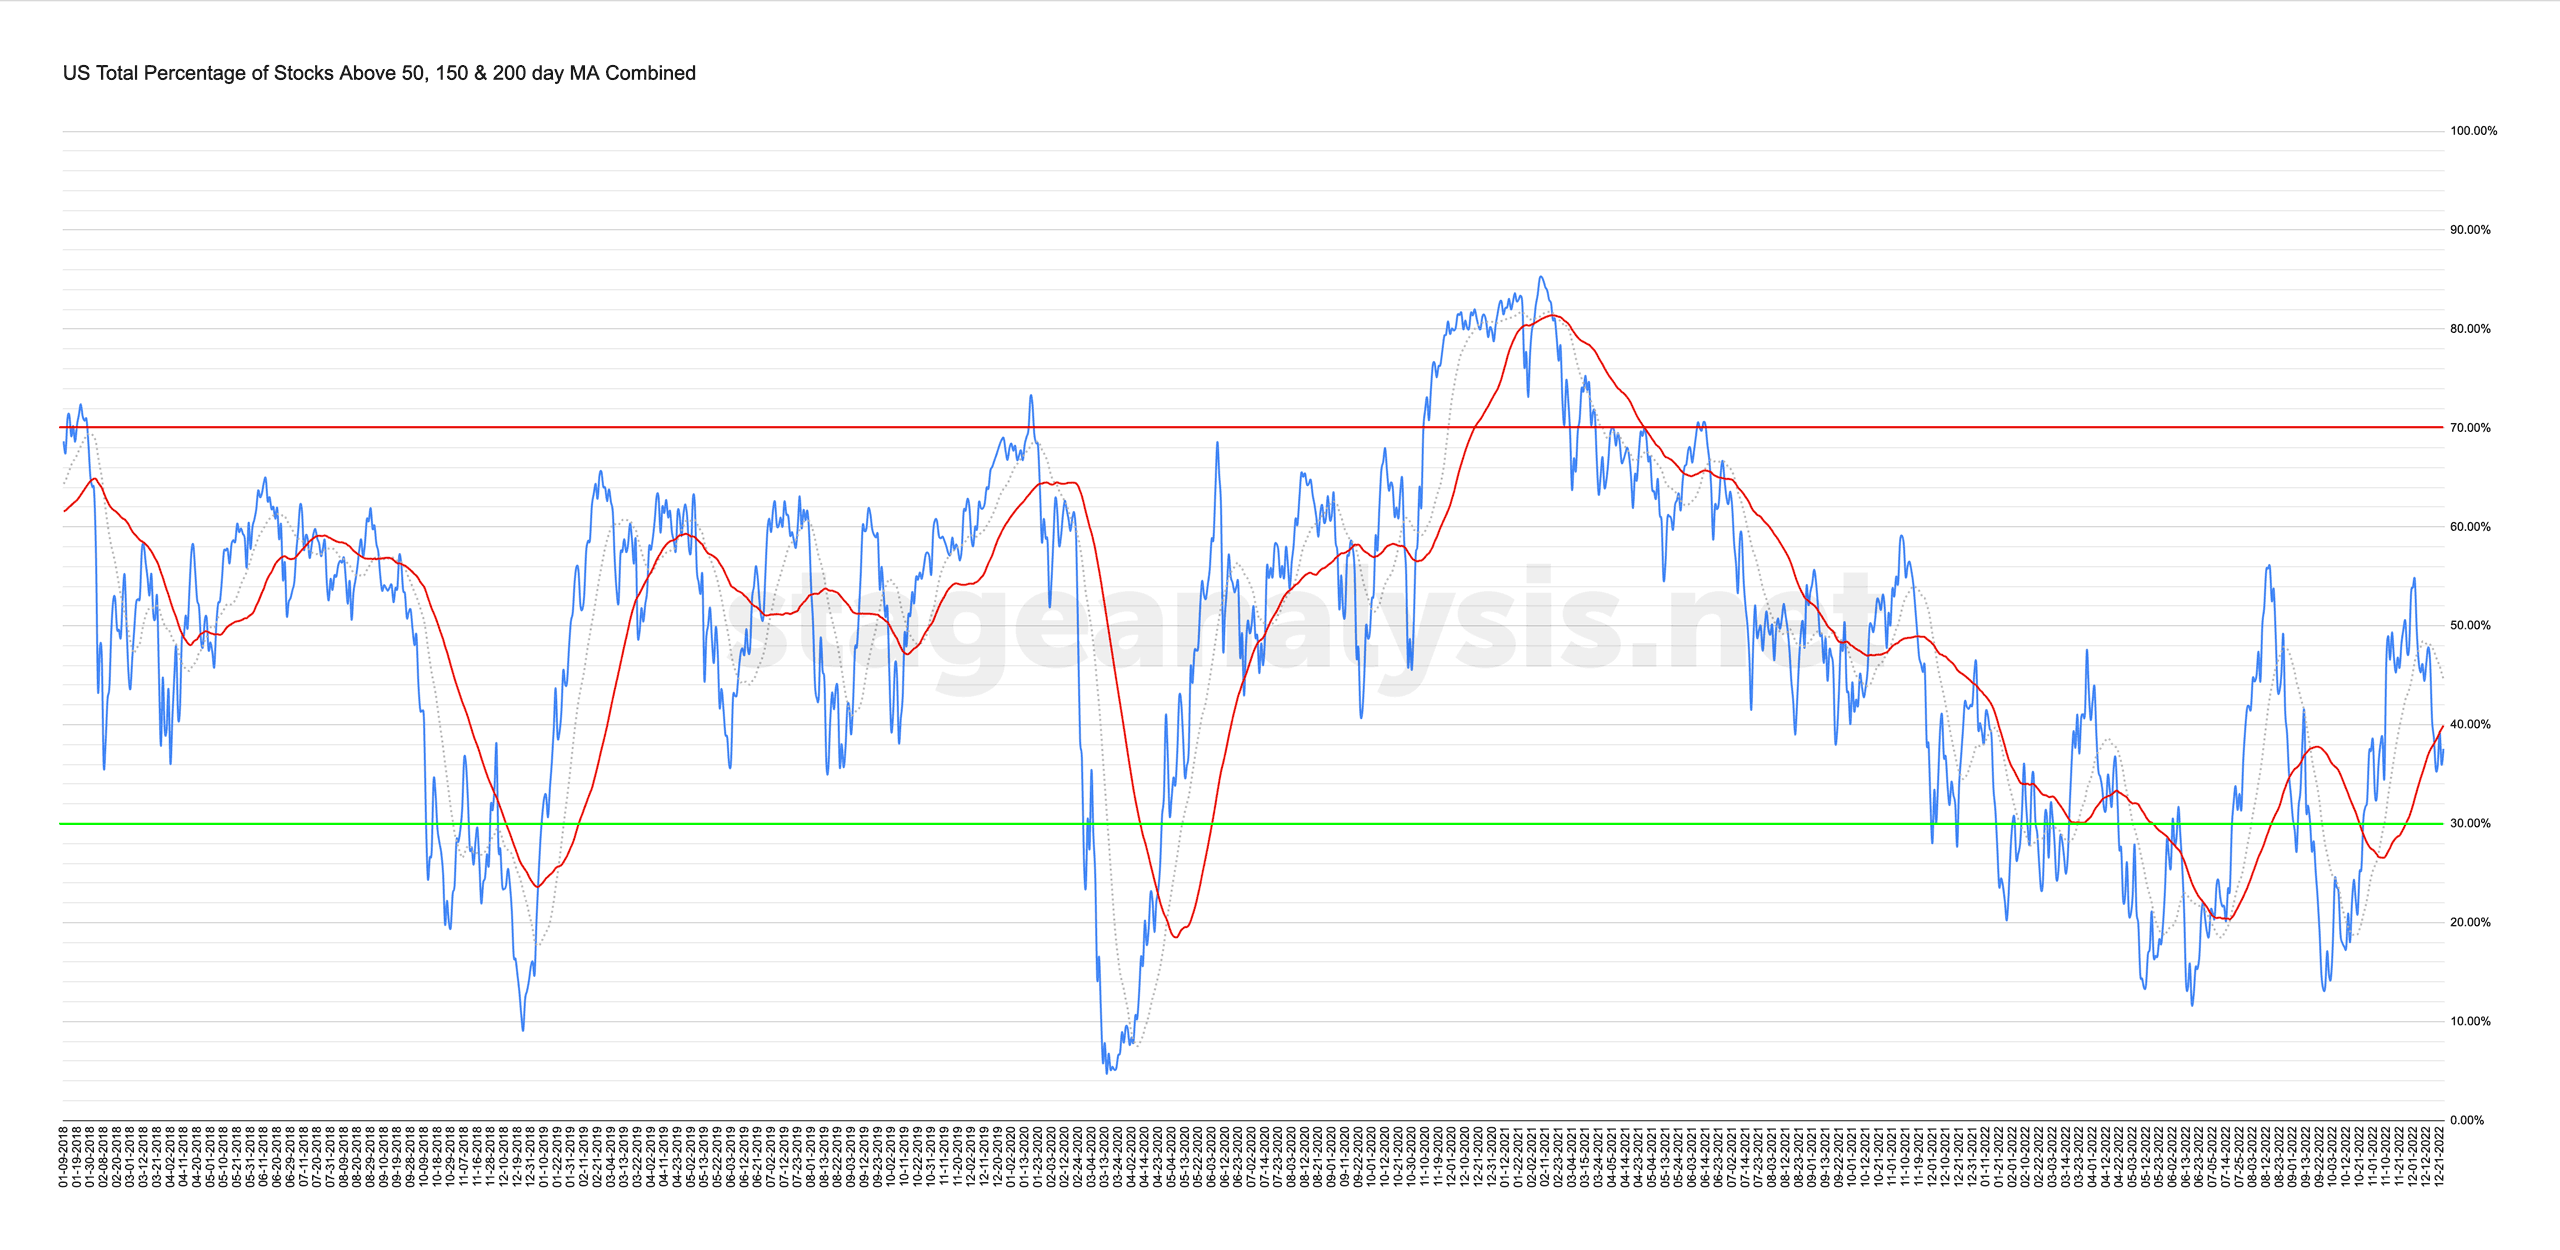
Custom Percentage of Stocks Above Their 50 Day, 150 Day & 200 Day Moving Averages Combined Market Breadth Charts for the Overall US Market, NYSE and Nasdaq for Market Timing and Strategy.
Read More
Blog – All Posts
The blog shows all articles in date order – including the US Stocks Watchlist, Videos, Indexes, Market Breadth and featured articles on Industry Groups, Sectors or individual Stocks. But if you want see the watchlist posts only, then use the Watchlist tab in the menu, or the category link in the sidebar area.
08 October, 2022
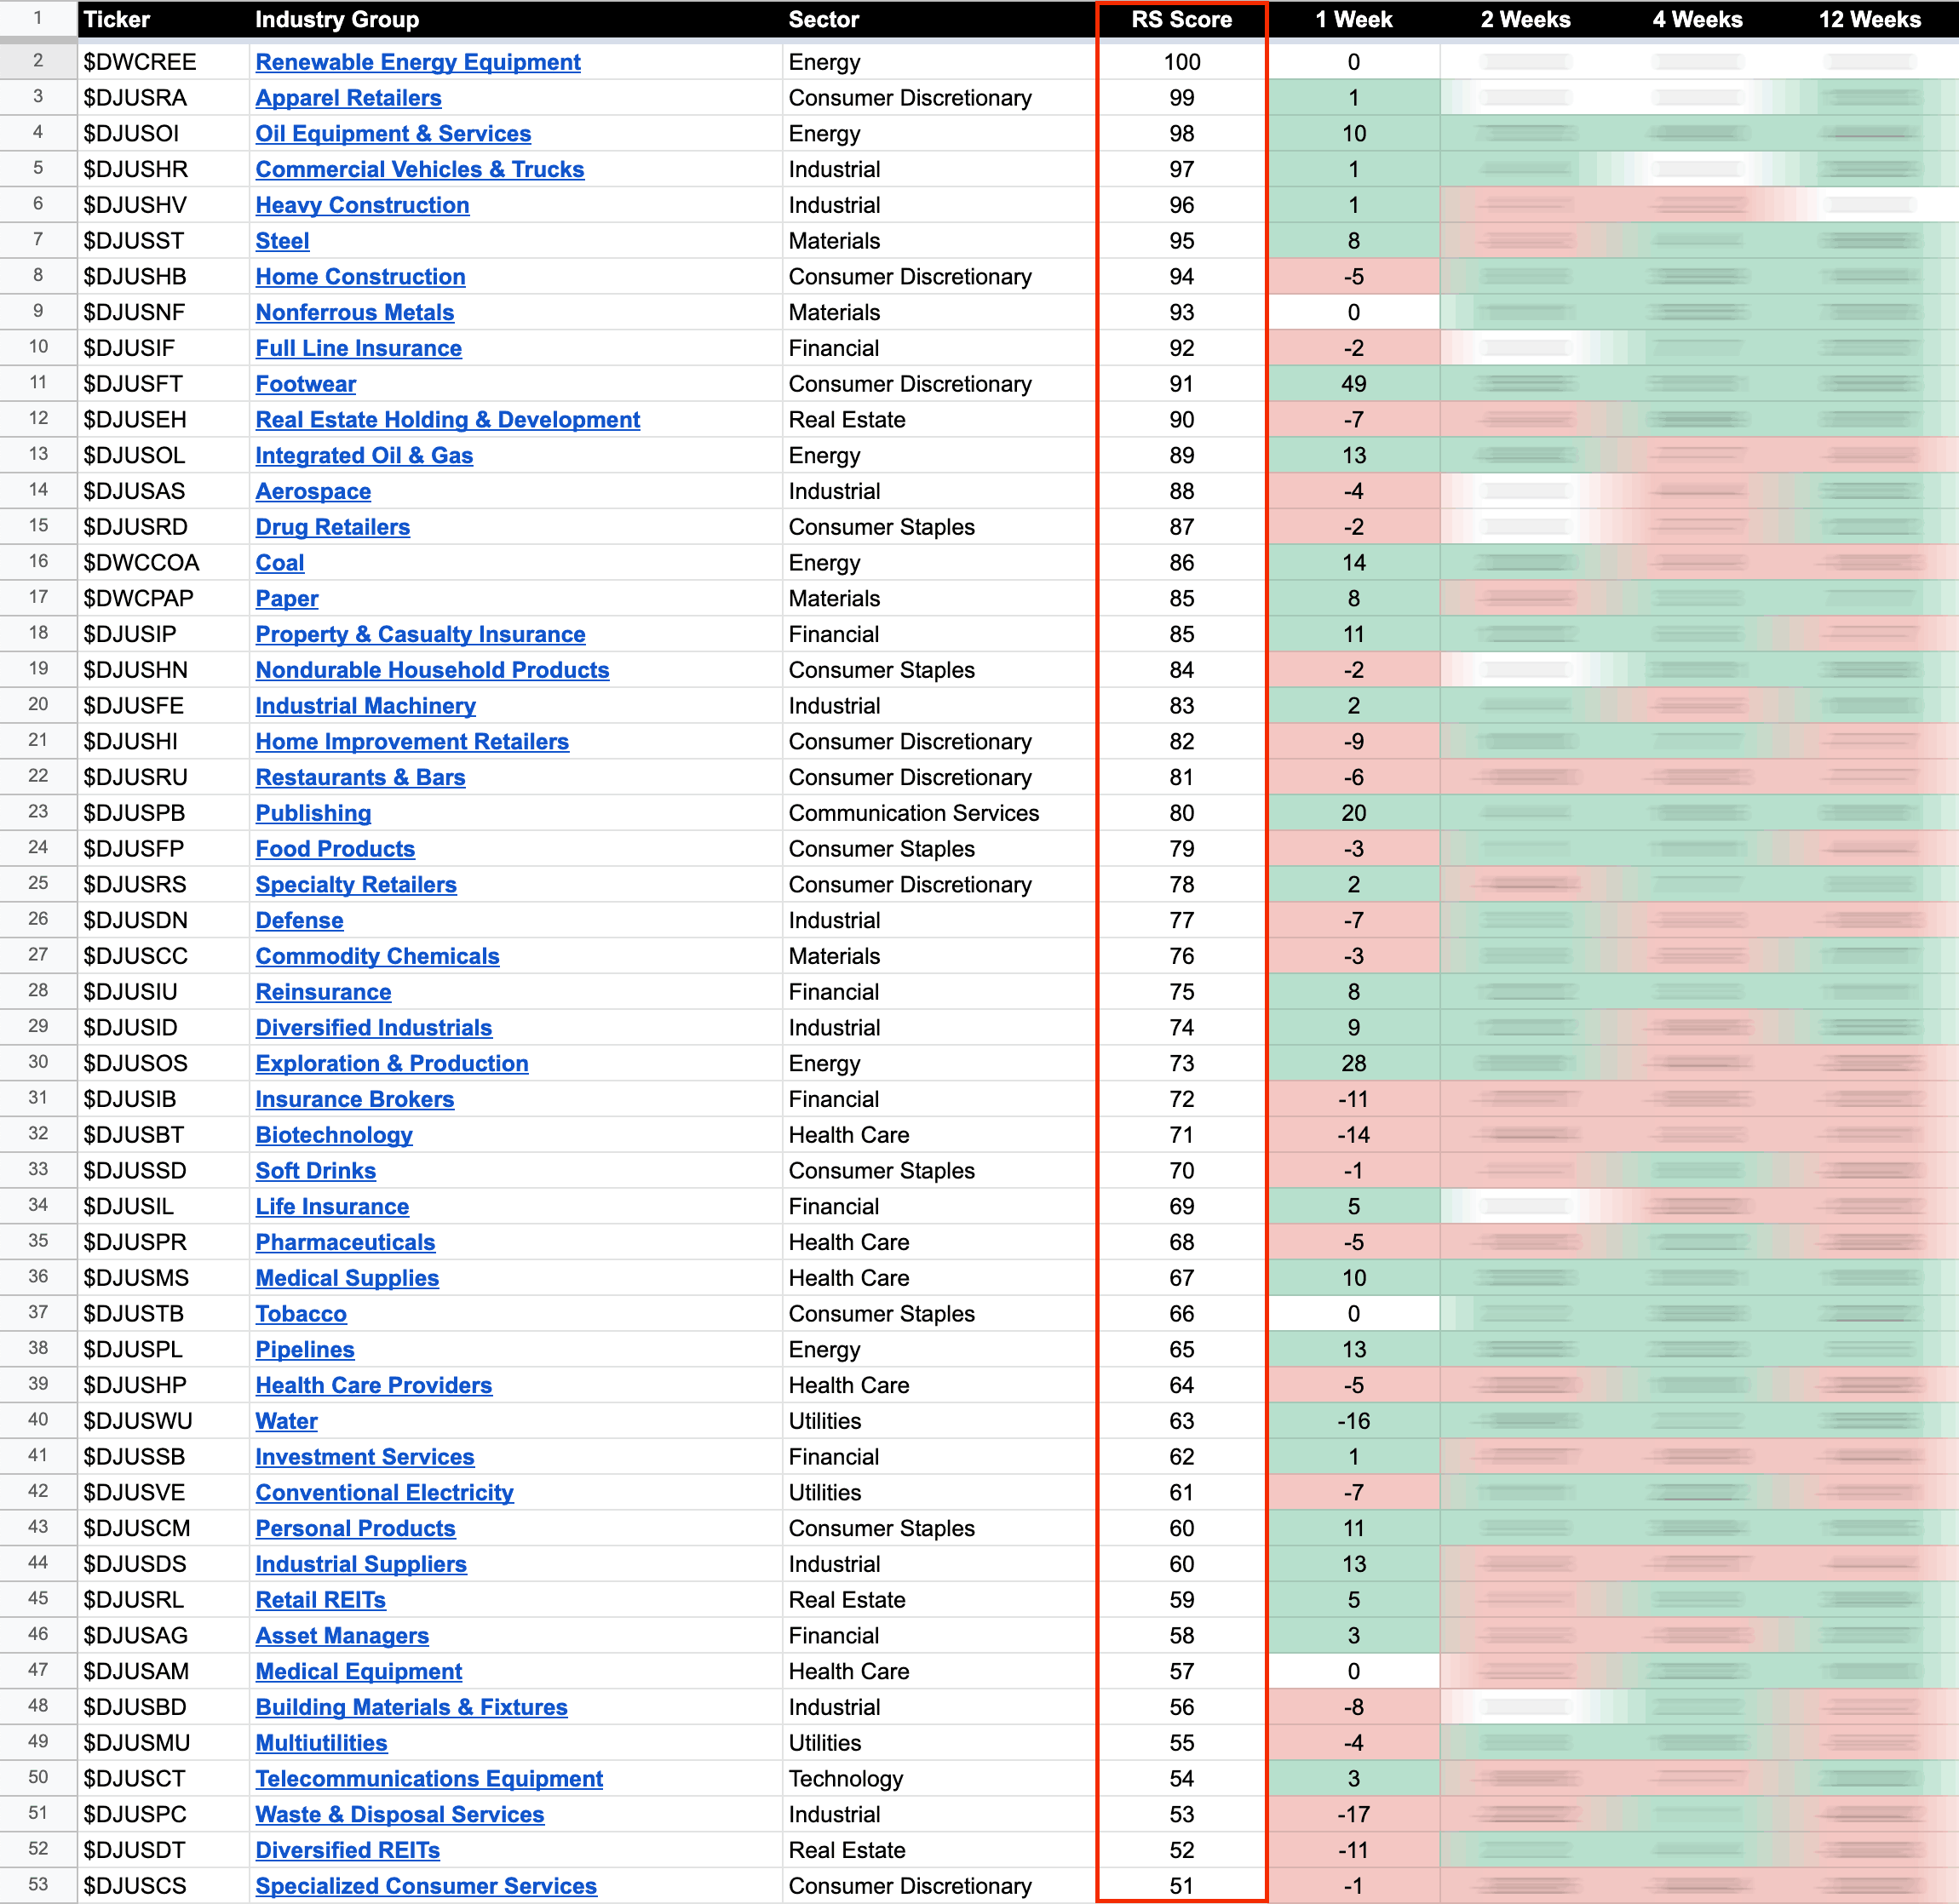
US Stocks Industry Groups Relative Strength Rankings
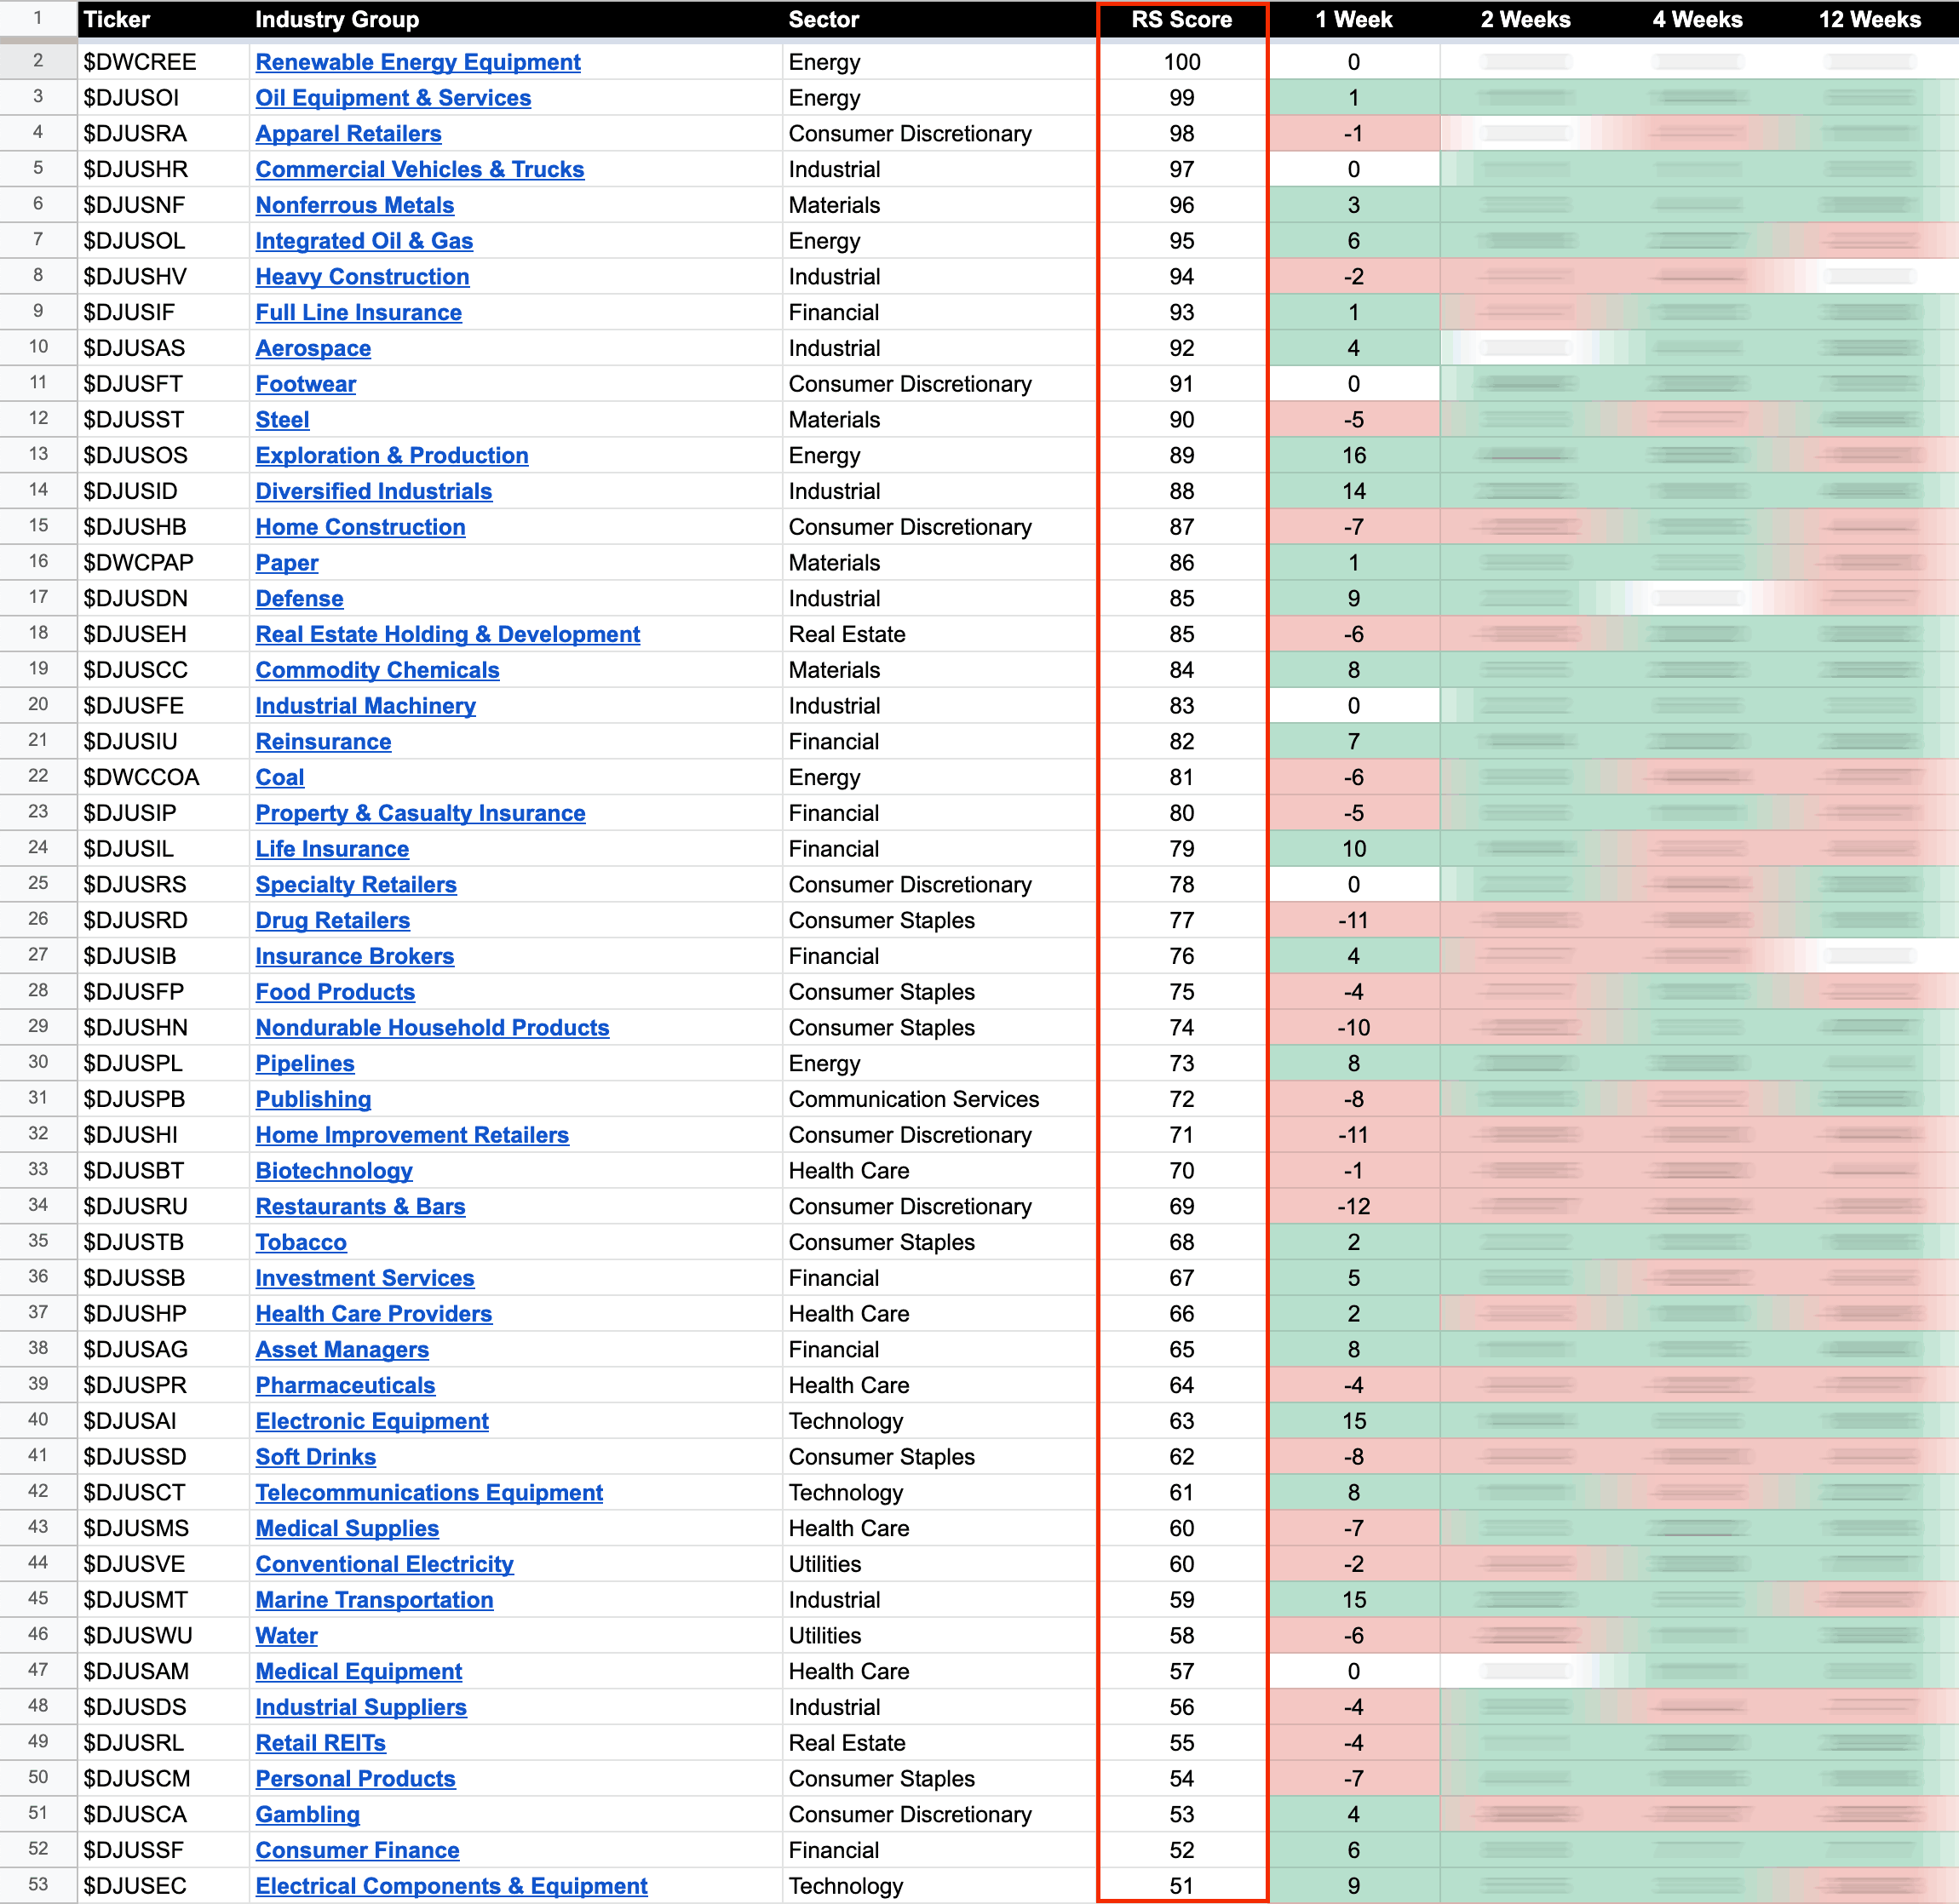
The purpose of the Relative Strength (RS) tables is to track the short, medium and long term RS changes of the individual groups to find the new leadership earlier than the crowd...
Read More
06 October, 2022
Stage Analysis Members Midweek Video – 6 October 2022 (48mins)
The members midweek video discussing the market, short-term market breadth and individual stocks from the watchlist in more detail.
Read More
05 October, 2022
Stock Market Update and the US Stocks Watchlist – 5 October 2022
I've led with the Nasdaq Composite in todays post as the watchlist is once again dominated by Software stocks, as numerous stocks in the group continue to develop Stage 1 base structures, and the majority of Software/Technology stocks are listed in the Nasdaq.
Read More
04 October, 2022
Stock Market Update and the US Stocks Watchlist – 4 October 2022
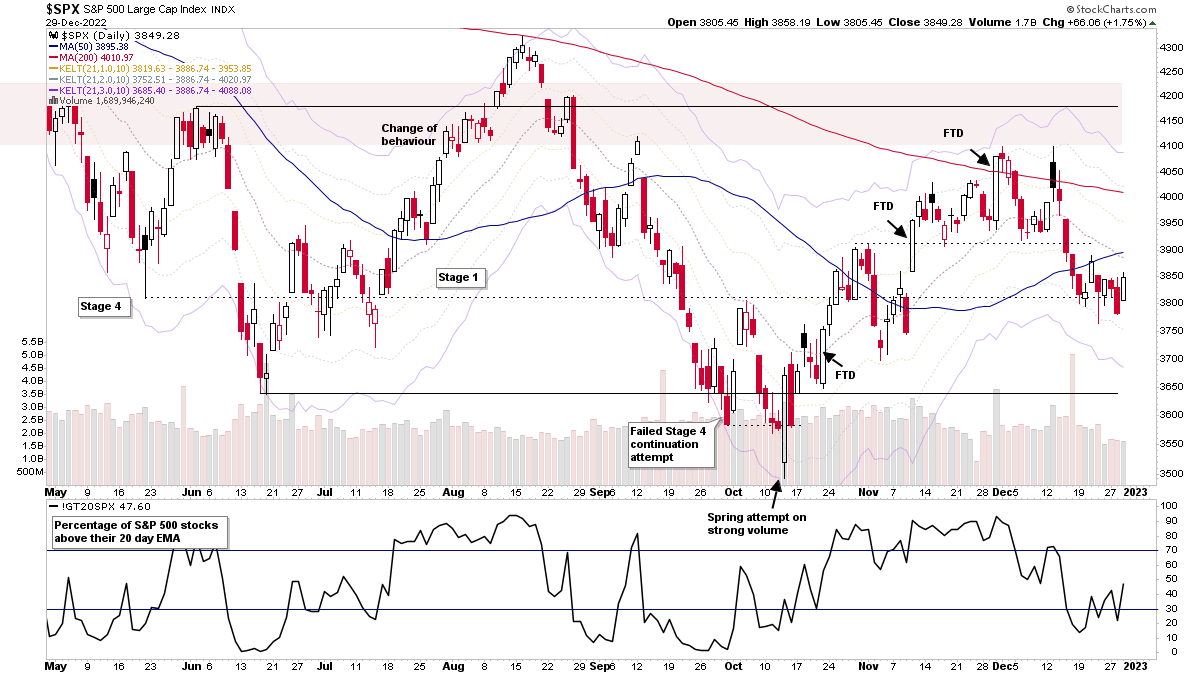
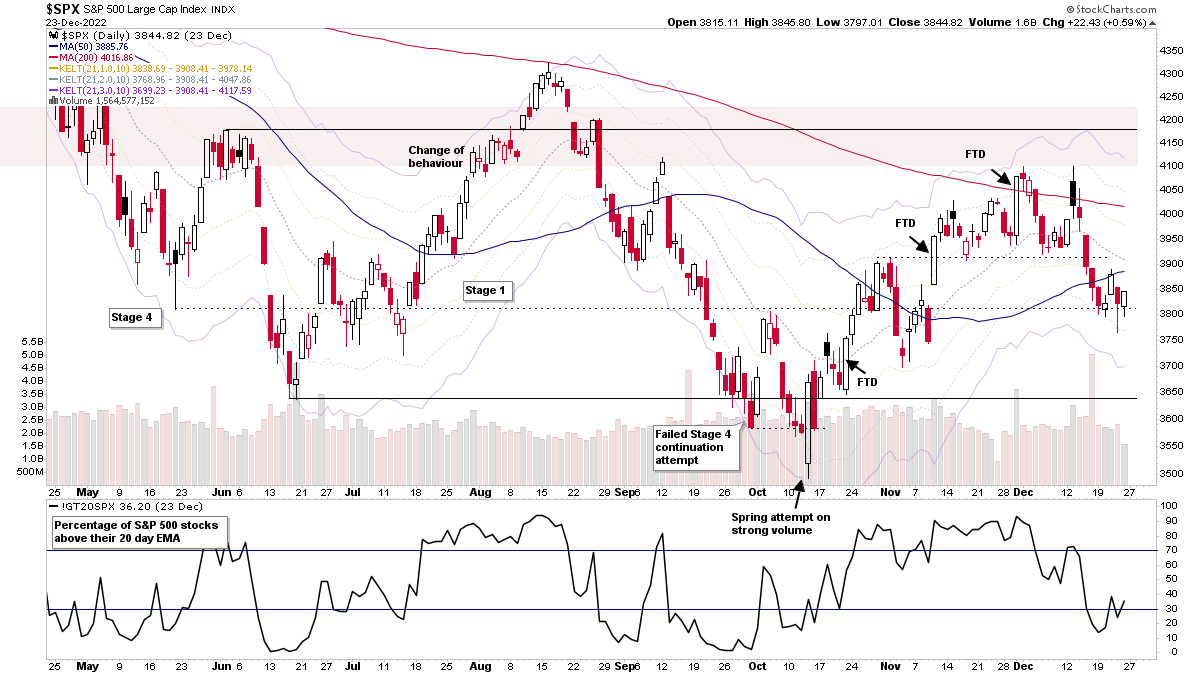
The S&P 500 (shown above) and other major indexes rallied strongly for a second day and the S&P 500 is making a Spring attempt from the lows of the developing range, which may still be potentially a developing Stage 1 base...
Read More
03 October, 2022
Stage Analysis Members Video and US Stocks Watchlist – 3 October 2022
The (delayed) members weekend video discussing the market, industry groups, market breadth and individual stocks from the watchlist in more detail.
Read More
02 October, 2022
US Stocks Watchlist – 2 October 2022
I highlighted the Precious Metals group in the US Stocks Industry Groups Relative Strength Rankings weekend post, and the watchlist scans also picked up a number of stocks from the group potentially transitioning from Stage 4B- towards Stage 1, as the PM group/s had a strong week, while the broad market ended lower breaking down from the recent range...
Read More
02 October, 2022
IBD Industry Groups Bell Curve – Bullish Percent
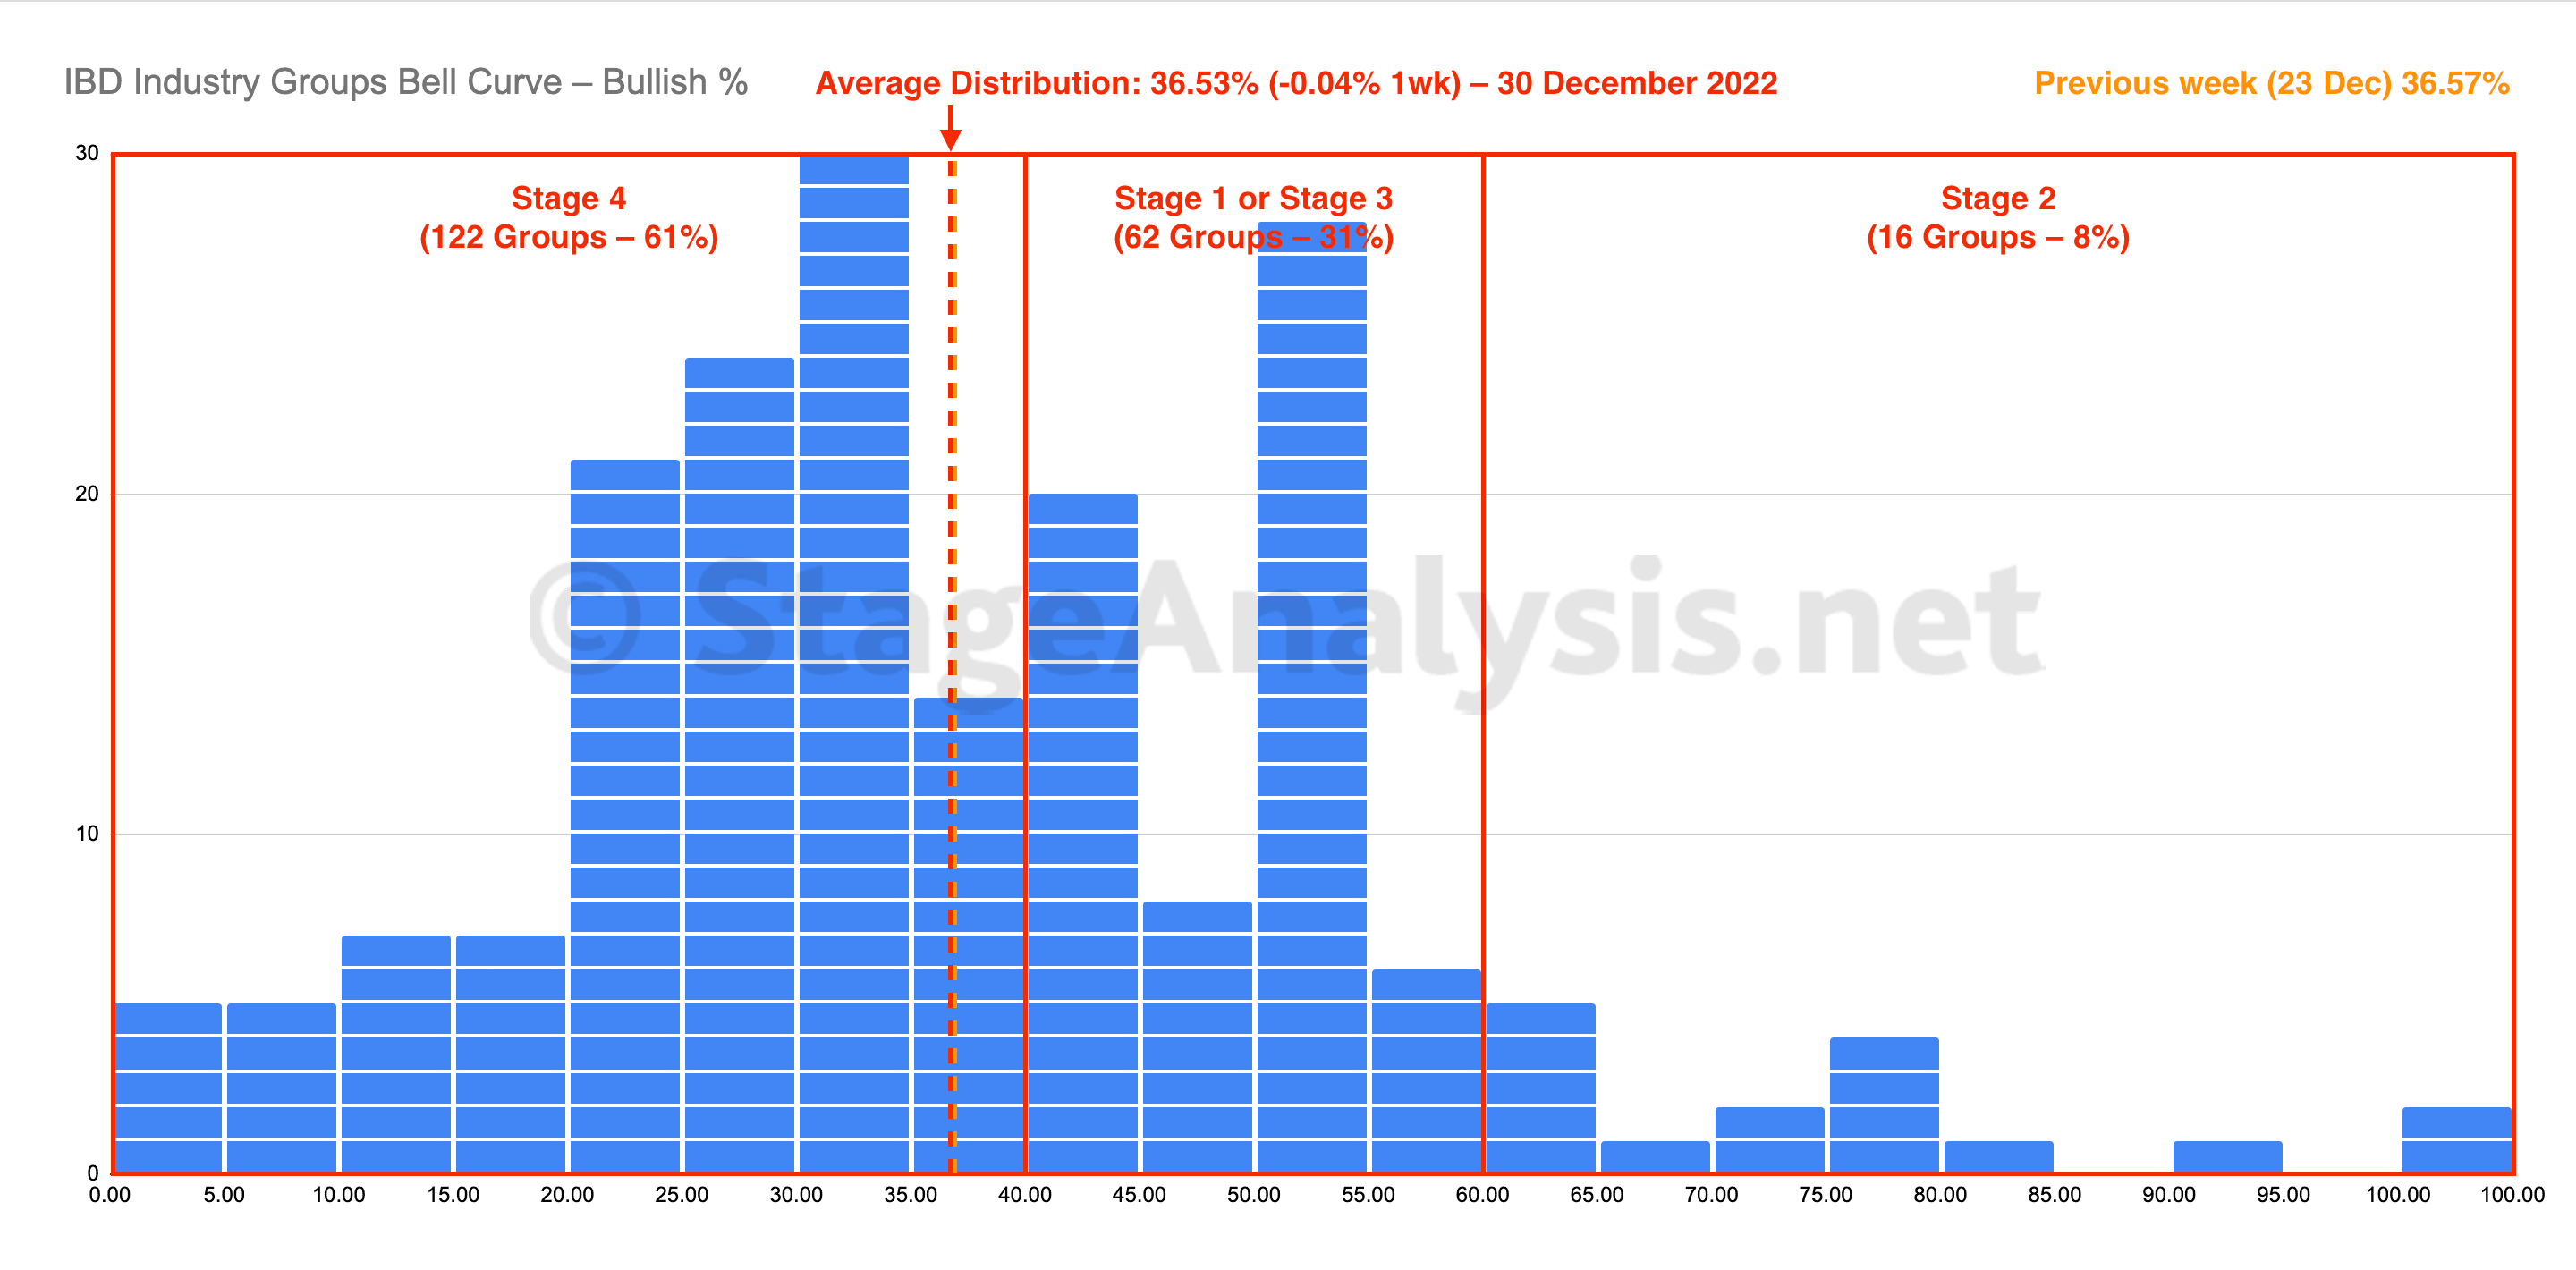
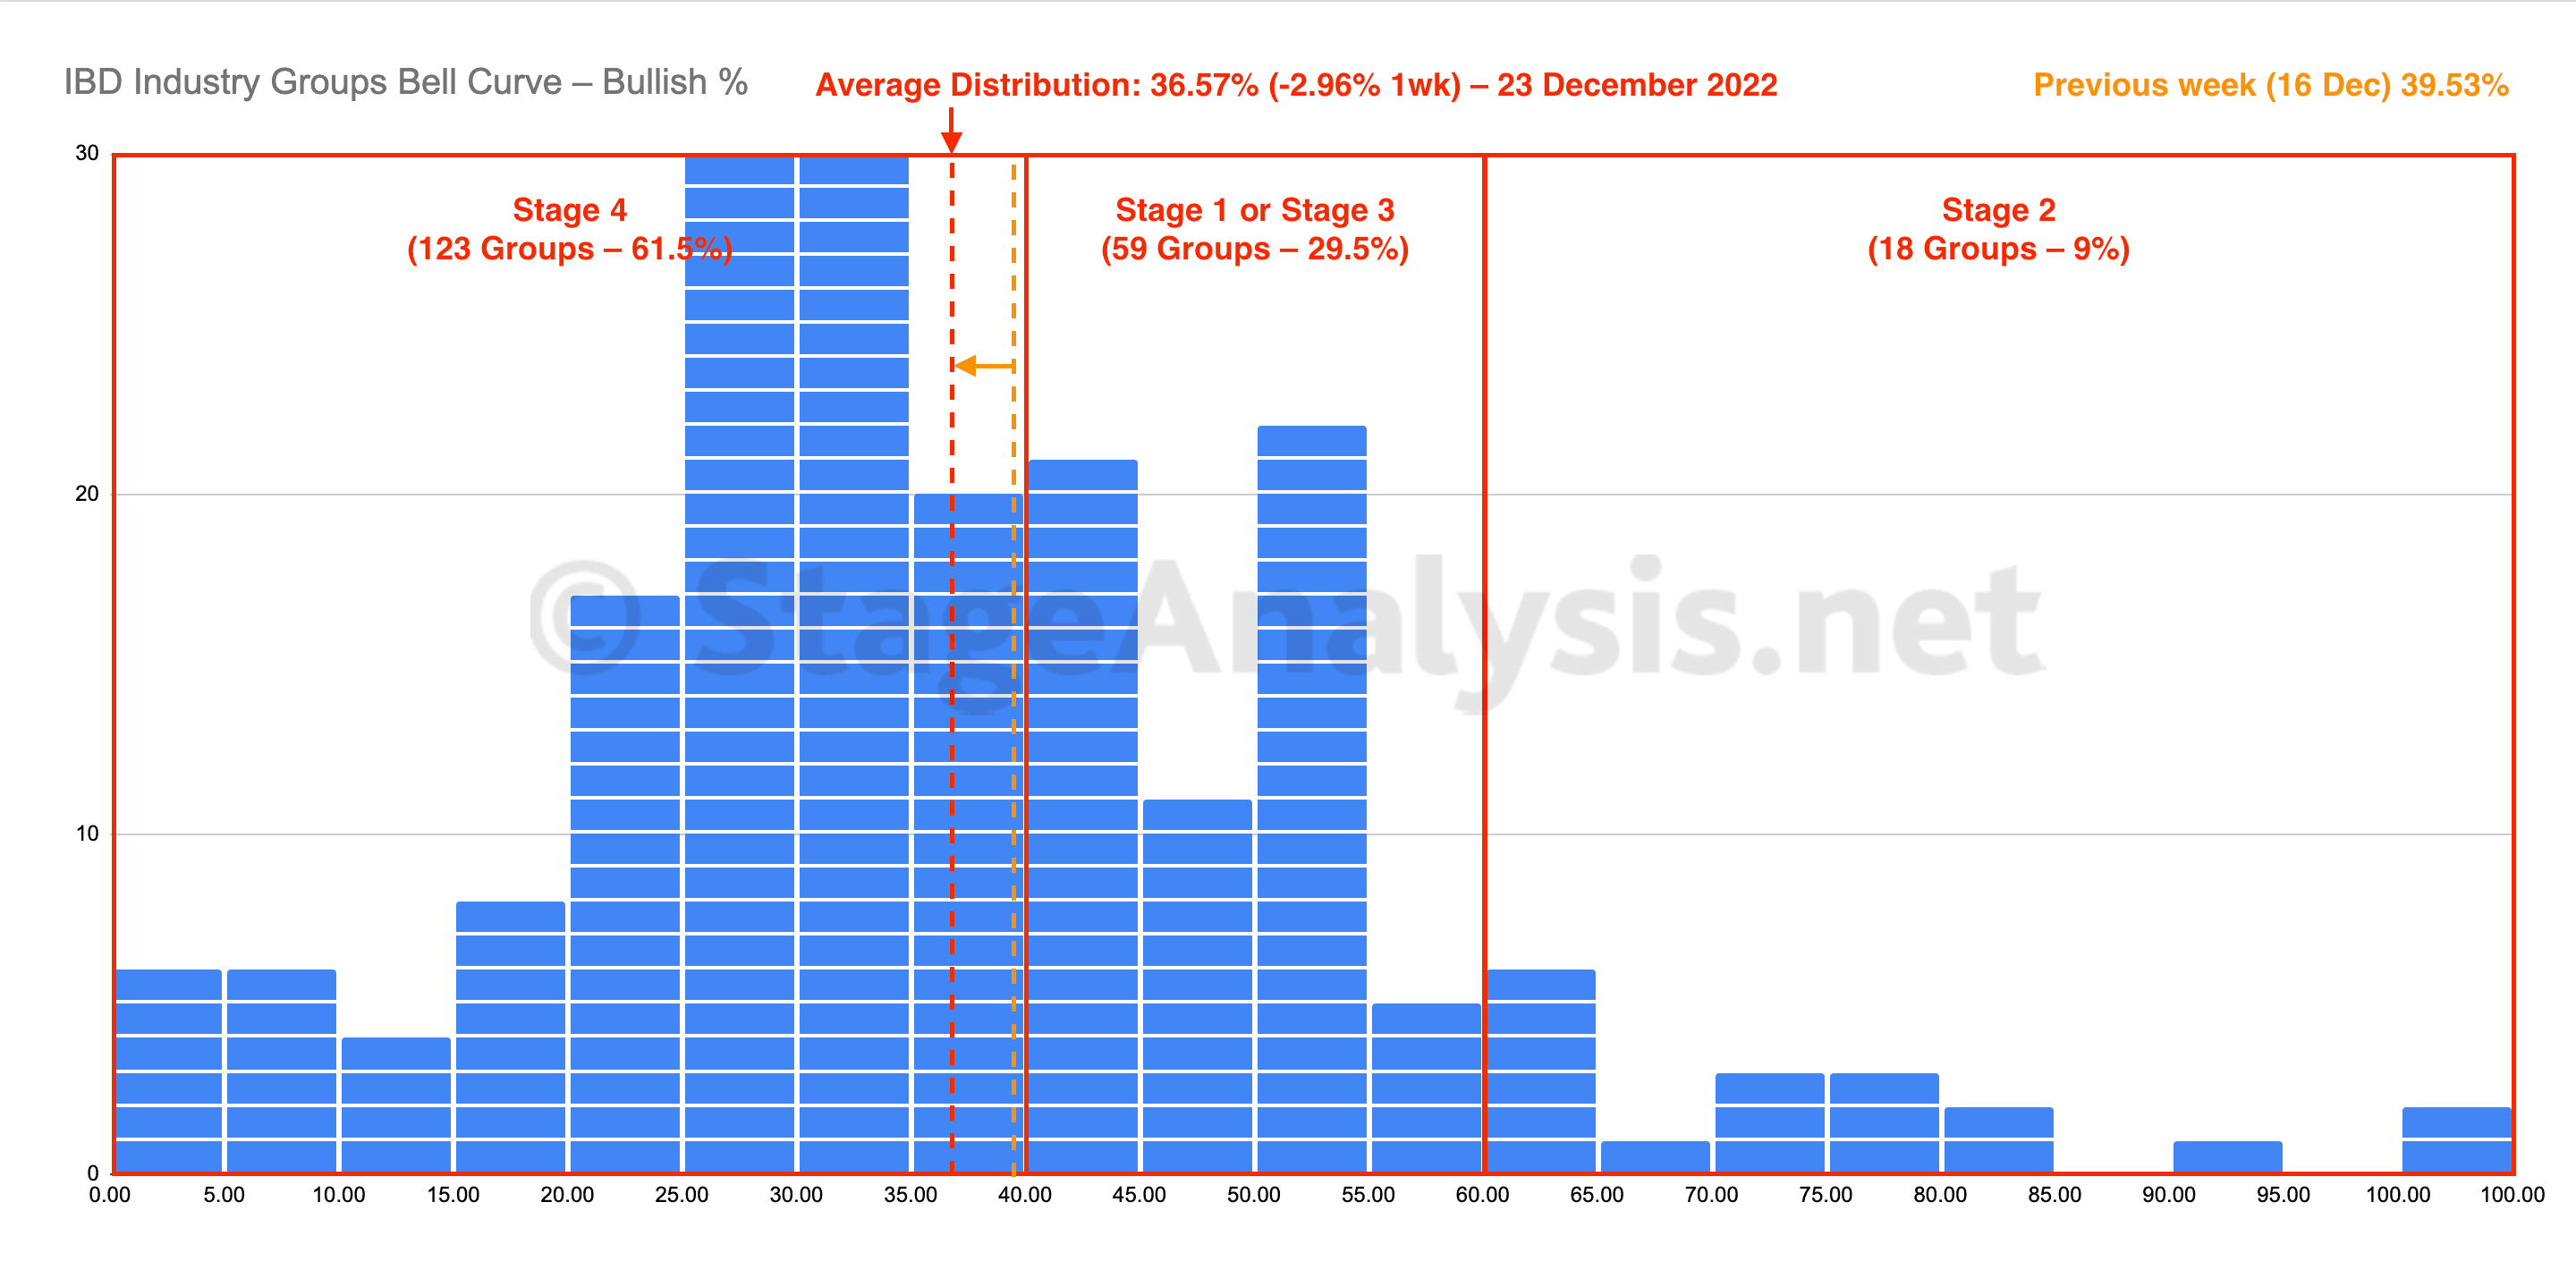
The IBD Industry Groups Bell Curve – Bullish Percent closed at a new low for 2022 with the average distribution at an extreme of 17.60%, which was a further decline of -1.75% on the previous week and has surpassed the 18.81% low set on June 17th...
Read More
02 October, 2022
Market Breadth: Percentage of Stocks Above their 50 Day, 150 Day & 200 Day Moving Averages Combined
Custom Percentage of Stocks Above Their 50 Day, 150 Day & 200 Day Moving Averages Combined Market Breadth Charts for the Overall US Market, NYSE and Nasdaq for Market Timing and Strategy.
Read More
01 October, 2022
US Stocks Industry Groups Relative Strength Rankings
The purpose of the Relative Strength (RS) tables is to track the short, medium and long term RS changes of the individual groups to find the new leadership earlier than the crowd...
Read More