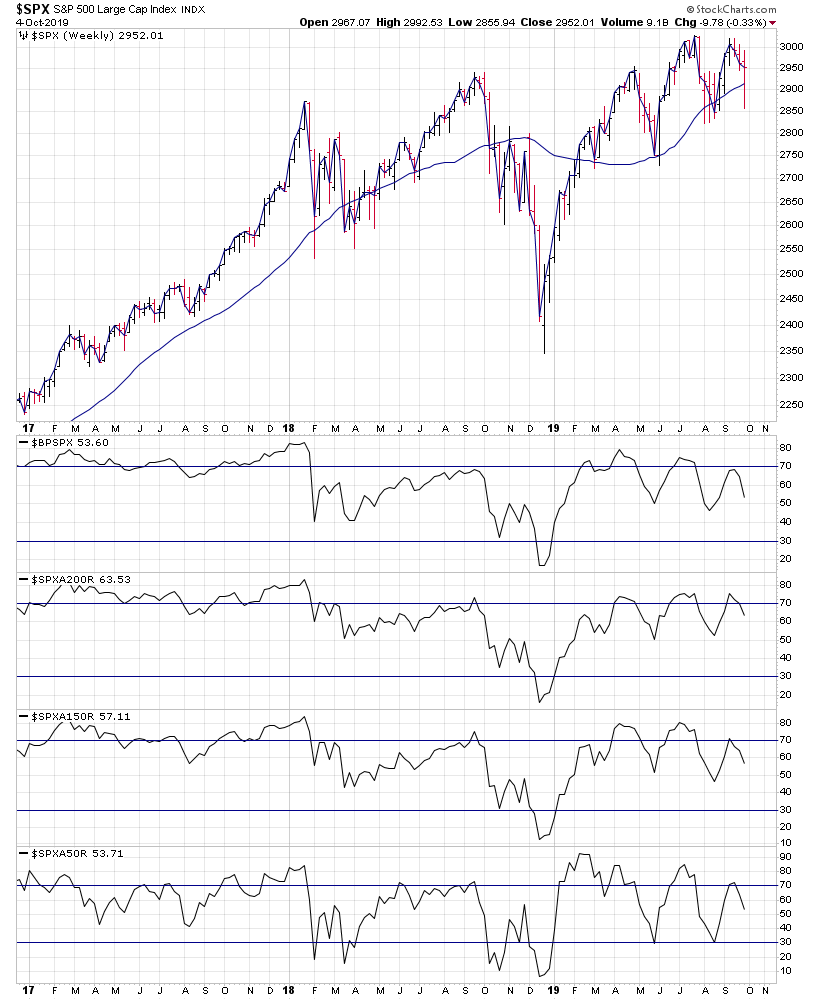
Here are the weekly overview charts of the NYSE, Nasdaq Composite, S&P 500, Nasdaq 100, DJIA & S&P 600 small caps with their US Bullish Percent and Moving Average Breadth.
Read More
Blog – All Posts
The blog shows all articles in date order – including the US Stocks Watchlist, Videos, Indexes, Market Breadth and featured articles on Industry Groups, Sectors or individual Stocks. But if you want see the watchlist posts only, then use the Watchlist tab in the menu, or the category link in the sidebar area.
05 October, 2019
Effective Volume $SPY $QQQ $IWM
I highlighted a few days ago that there was some divergence happening between the Nasdaq 100 ETF large and small player volume.
Read More
03 October, 2019
Stocks Watchlist - 3rd October 2019
For the watchlist from Thursdays scans - OKTA, TAL, VIPS
Read More
03 October, 2019
Effective Volume $SPY $QQQ $IWM
Attached is the Effective Volume update from http://www.effectivevolume.com/content.php?156-etf-review which separates the large player volume from the small player volume.
Read More
02 October, 2019
Stocks Watchlist - 2nd October 2019
A surprising number of stocks for the watchlist from Wednesdays scans considering the carnage in the major indexes. But that's the point of the daily scans that I do. As the individual stock charts tell you a lot more about what's going on than the indexes do imo.
Read More
01 October, 2019
Stocks Watchlist - 1st October 2019
For the watchlist from Tuesdays scans - FRO, MKC
Read More
01 October, 2019
Stan Weinstein's Stage Analysis - Definitions of the Stages and Sub-stages
The four stages and sub-stages definitions from Stan Weinstein's Global Trend Alert
Read More
01 October, 2019
Stage Analysis Study Guide - Questions and Answers
The purpose of this Study Guide will be to help people learn to identify the Stages and to emphasise the importance of a full analysis taking into account the various technical attributes that we look to for guidance in determining the Stages i.e. price action in relation to the 10 and 30 week moving averages, volume, relative performance versus the market and the sector, support and resistance zones etc.
Read More
01 October, 2019
How to create the Mansfield Relative Strength Indicator
One of the core components of Stan Weinstein's method is the use of Relative Performance compared to an index such as the S&P 500, to a sector or to another stock. Which was referred to in his book as Relative Strength.
Read More
01 October, 2019
Stage Analysis Breakout Quality Checklist
The following is a checklist to work through to determine the quality of the breakout and whether it meets the methods requirements. The starting point for Weinstein's method when looking to buy a stock is first to consider Stan's "Forest to the Trees" Approach:
Read More