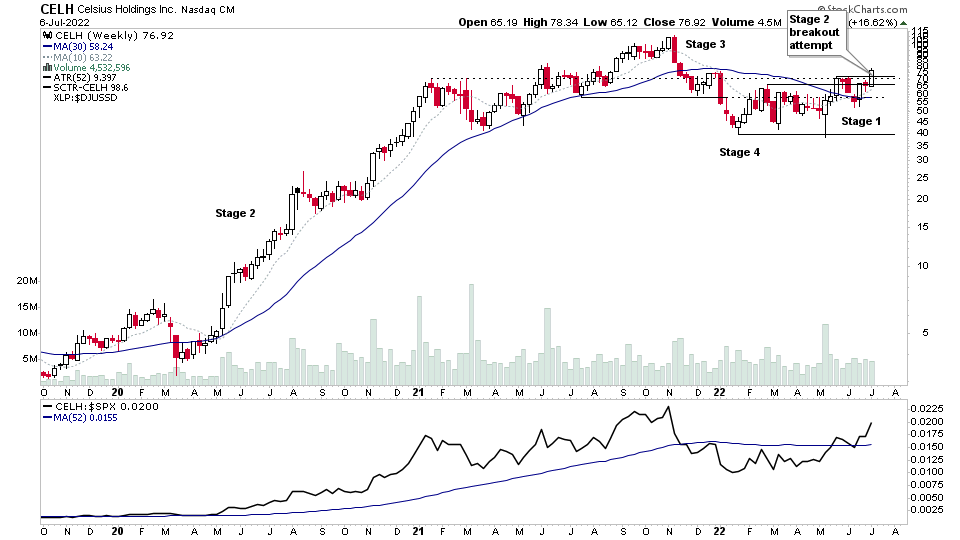
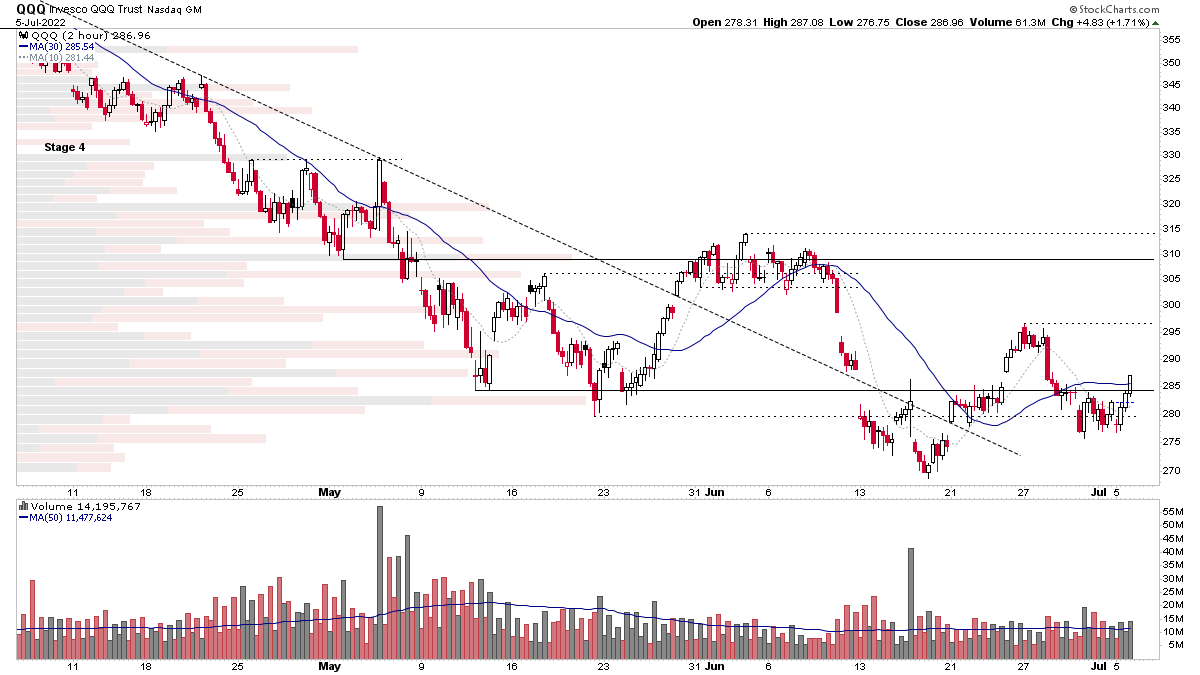
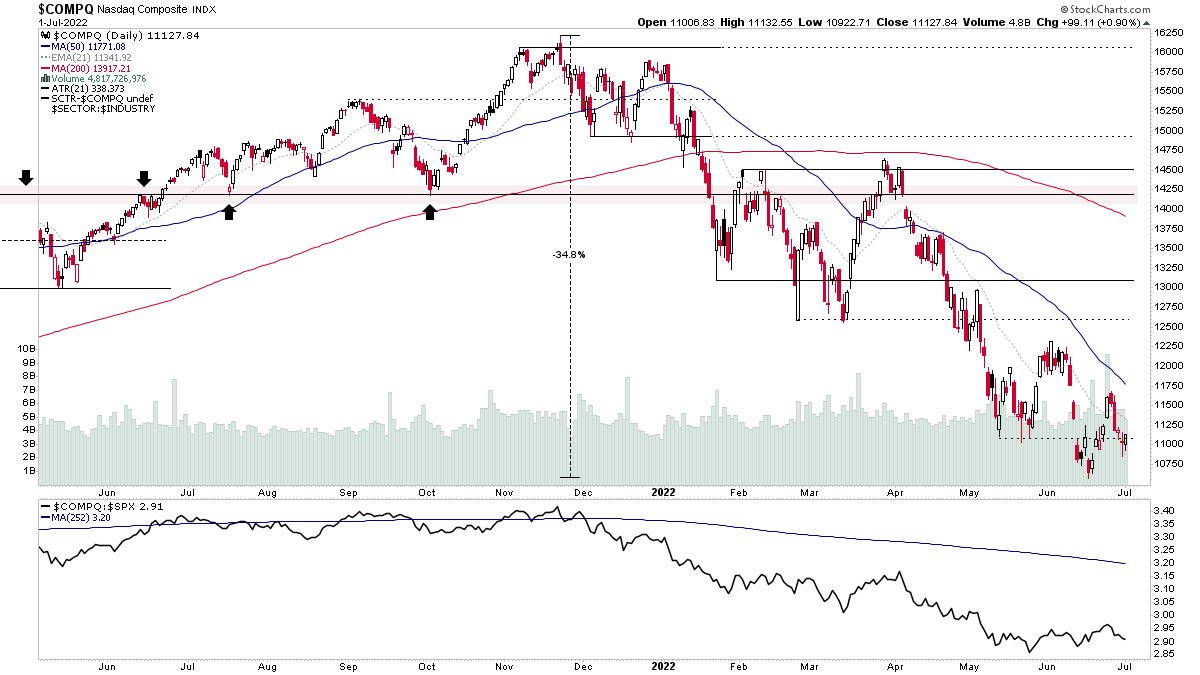
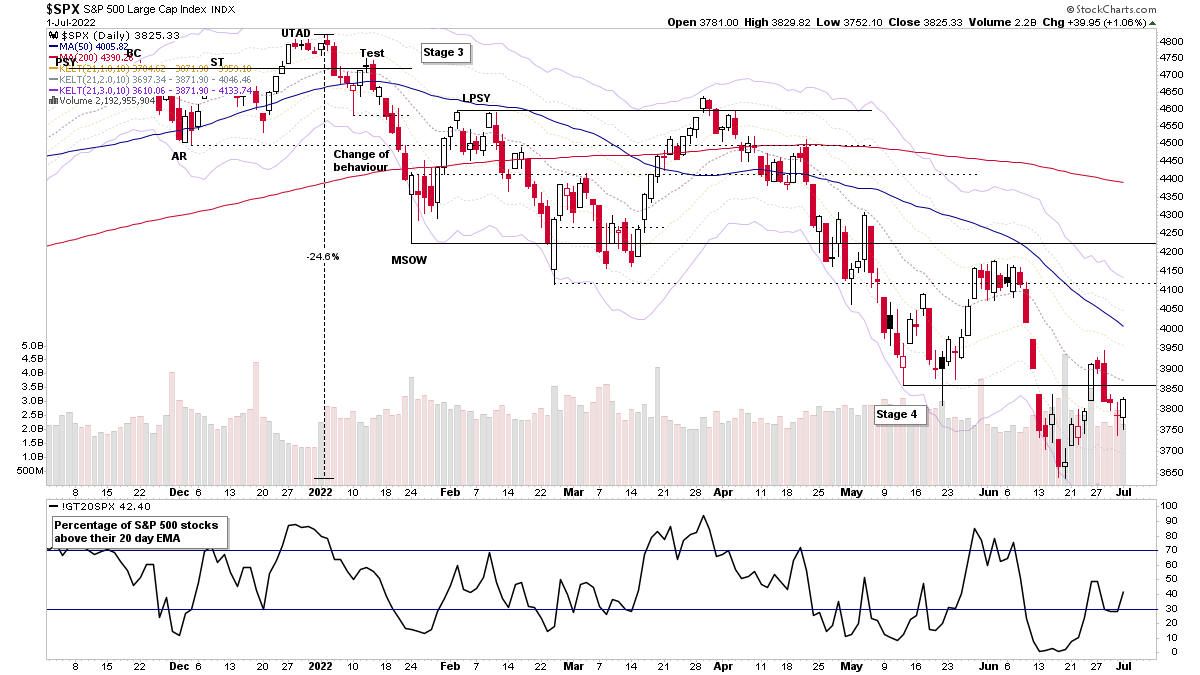
Midweek video covering the Stage 2 breakout attempt in CELH. Plus an In Focus segment on the Biotech (XBI) and Chinese (FXI) ETFs. Followed by the Major Indexes Update – S&P 500, Nasdaq Composite and Russell 2000, and short term Market Breadth charts, and then an in-depth run through of the recent US Watchlist Stocks...
Read More
Blog – All Posts
The blog shows all articles in date order – including the US Stocks Watchlist, Videos, Indexes, Market Breadth and featured articles on Industry Groups, Sectors or individual Stocks. But if you want see the watchlist posts only, then use the Watchlist tab in the menu, or the category link in the sidebar area.
05 July, 2022
Stock Market Update and US Stocks Watchlist – 5 July 2022
A mixed day in the stock market with the NYSE stocks down while the Nasdaq stocks were up. So rotation was the theme with money flowing out of the stronger RS areas, such as the Coal stocks, with the group chart now approaching its 200 day MA and moving into Stage 3...
Read More
03 July, 2022
Stage Analysis Members Weekend Video – 3 July 2022 (1hr 20mins)
The Stage Analysis Members Weekend Video this week covers the Major Indexes with analysis of S&P 500, Nasdaq, Russell 2000, as well as Oil, Copper, US 7-10 Year Treasuries & Gold...
Read More
03 July, 2022
Stock Market Update and US Stocks Watchlist – 1 July 2022
The S&P 500 percentage of stocks above their 20 day exponential moving averages closed the week at 42.40% with an attempt to make a high low after reaching the most extreme reading since March 2020 earlier in June...
Read More
02 July, 2022
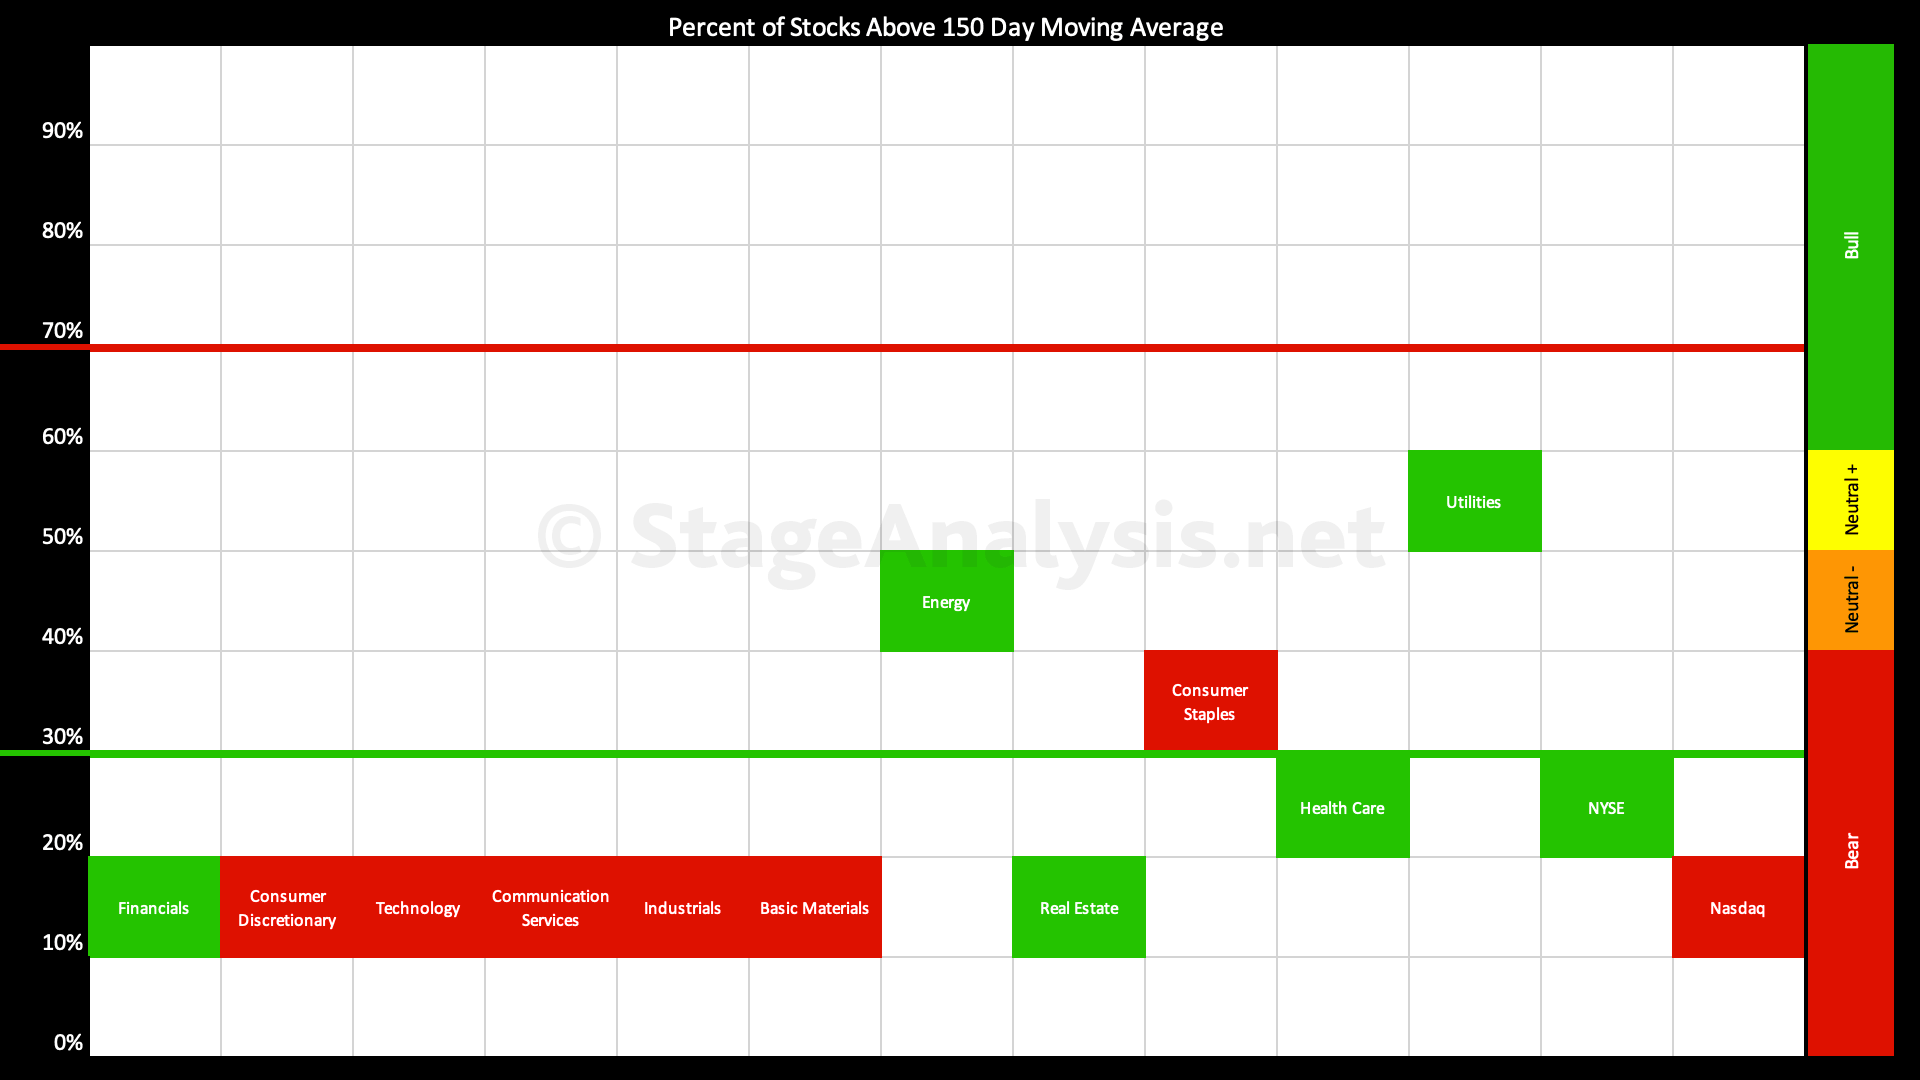
Sector Breadth: Percentage of US Stocks Above Their 150 day (30 Week) Moving Averages
The Sector breadth table has deteriorated further through June as it currently sits at 22.95%, but it did get down to a new 2022 low of 15.78% on the 17th June. So it has improved by +7.17% over the last two weeks...
Read More
02 July, 2022
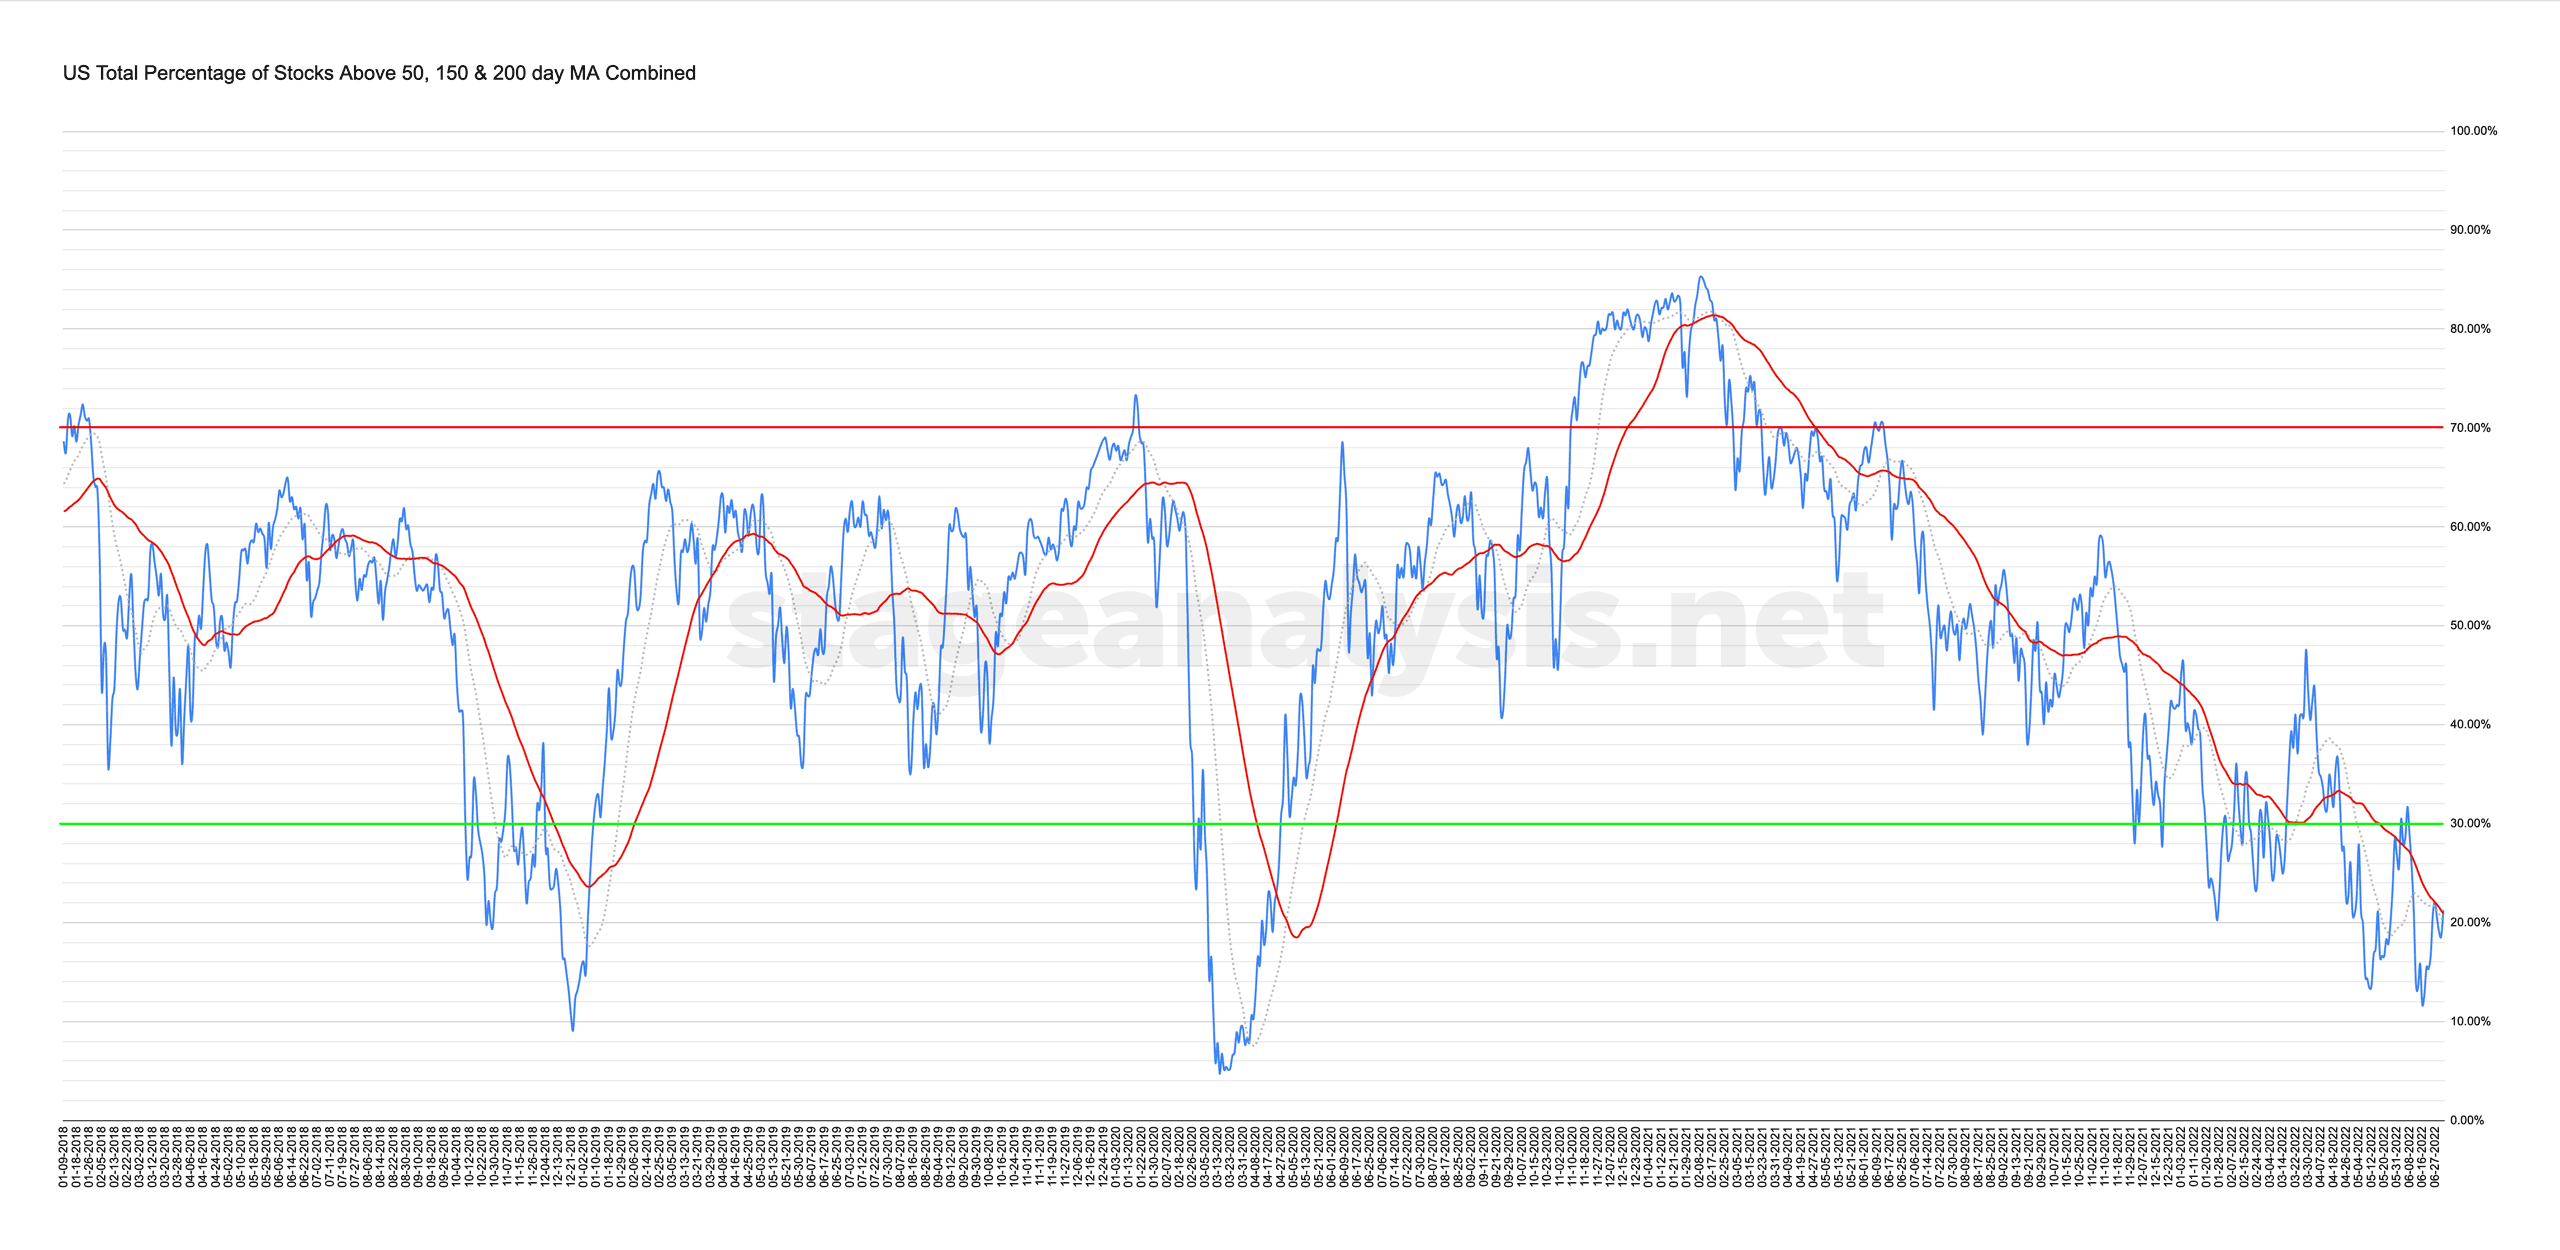
Market Breadth: Percentage of Stocks Above their 50 Day, 150 Day & 200 Day Moving Averages Combined
Custom Percentage of Stocks Above Their 50 Day, 150 Day & 200 Day Moving Averages Combined Market Breadth Charts for the Overall US Market, NYSE and Nasdaq for Market Timing and Strategy.
Read More
01 July, 2022
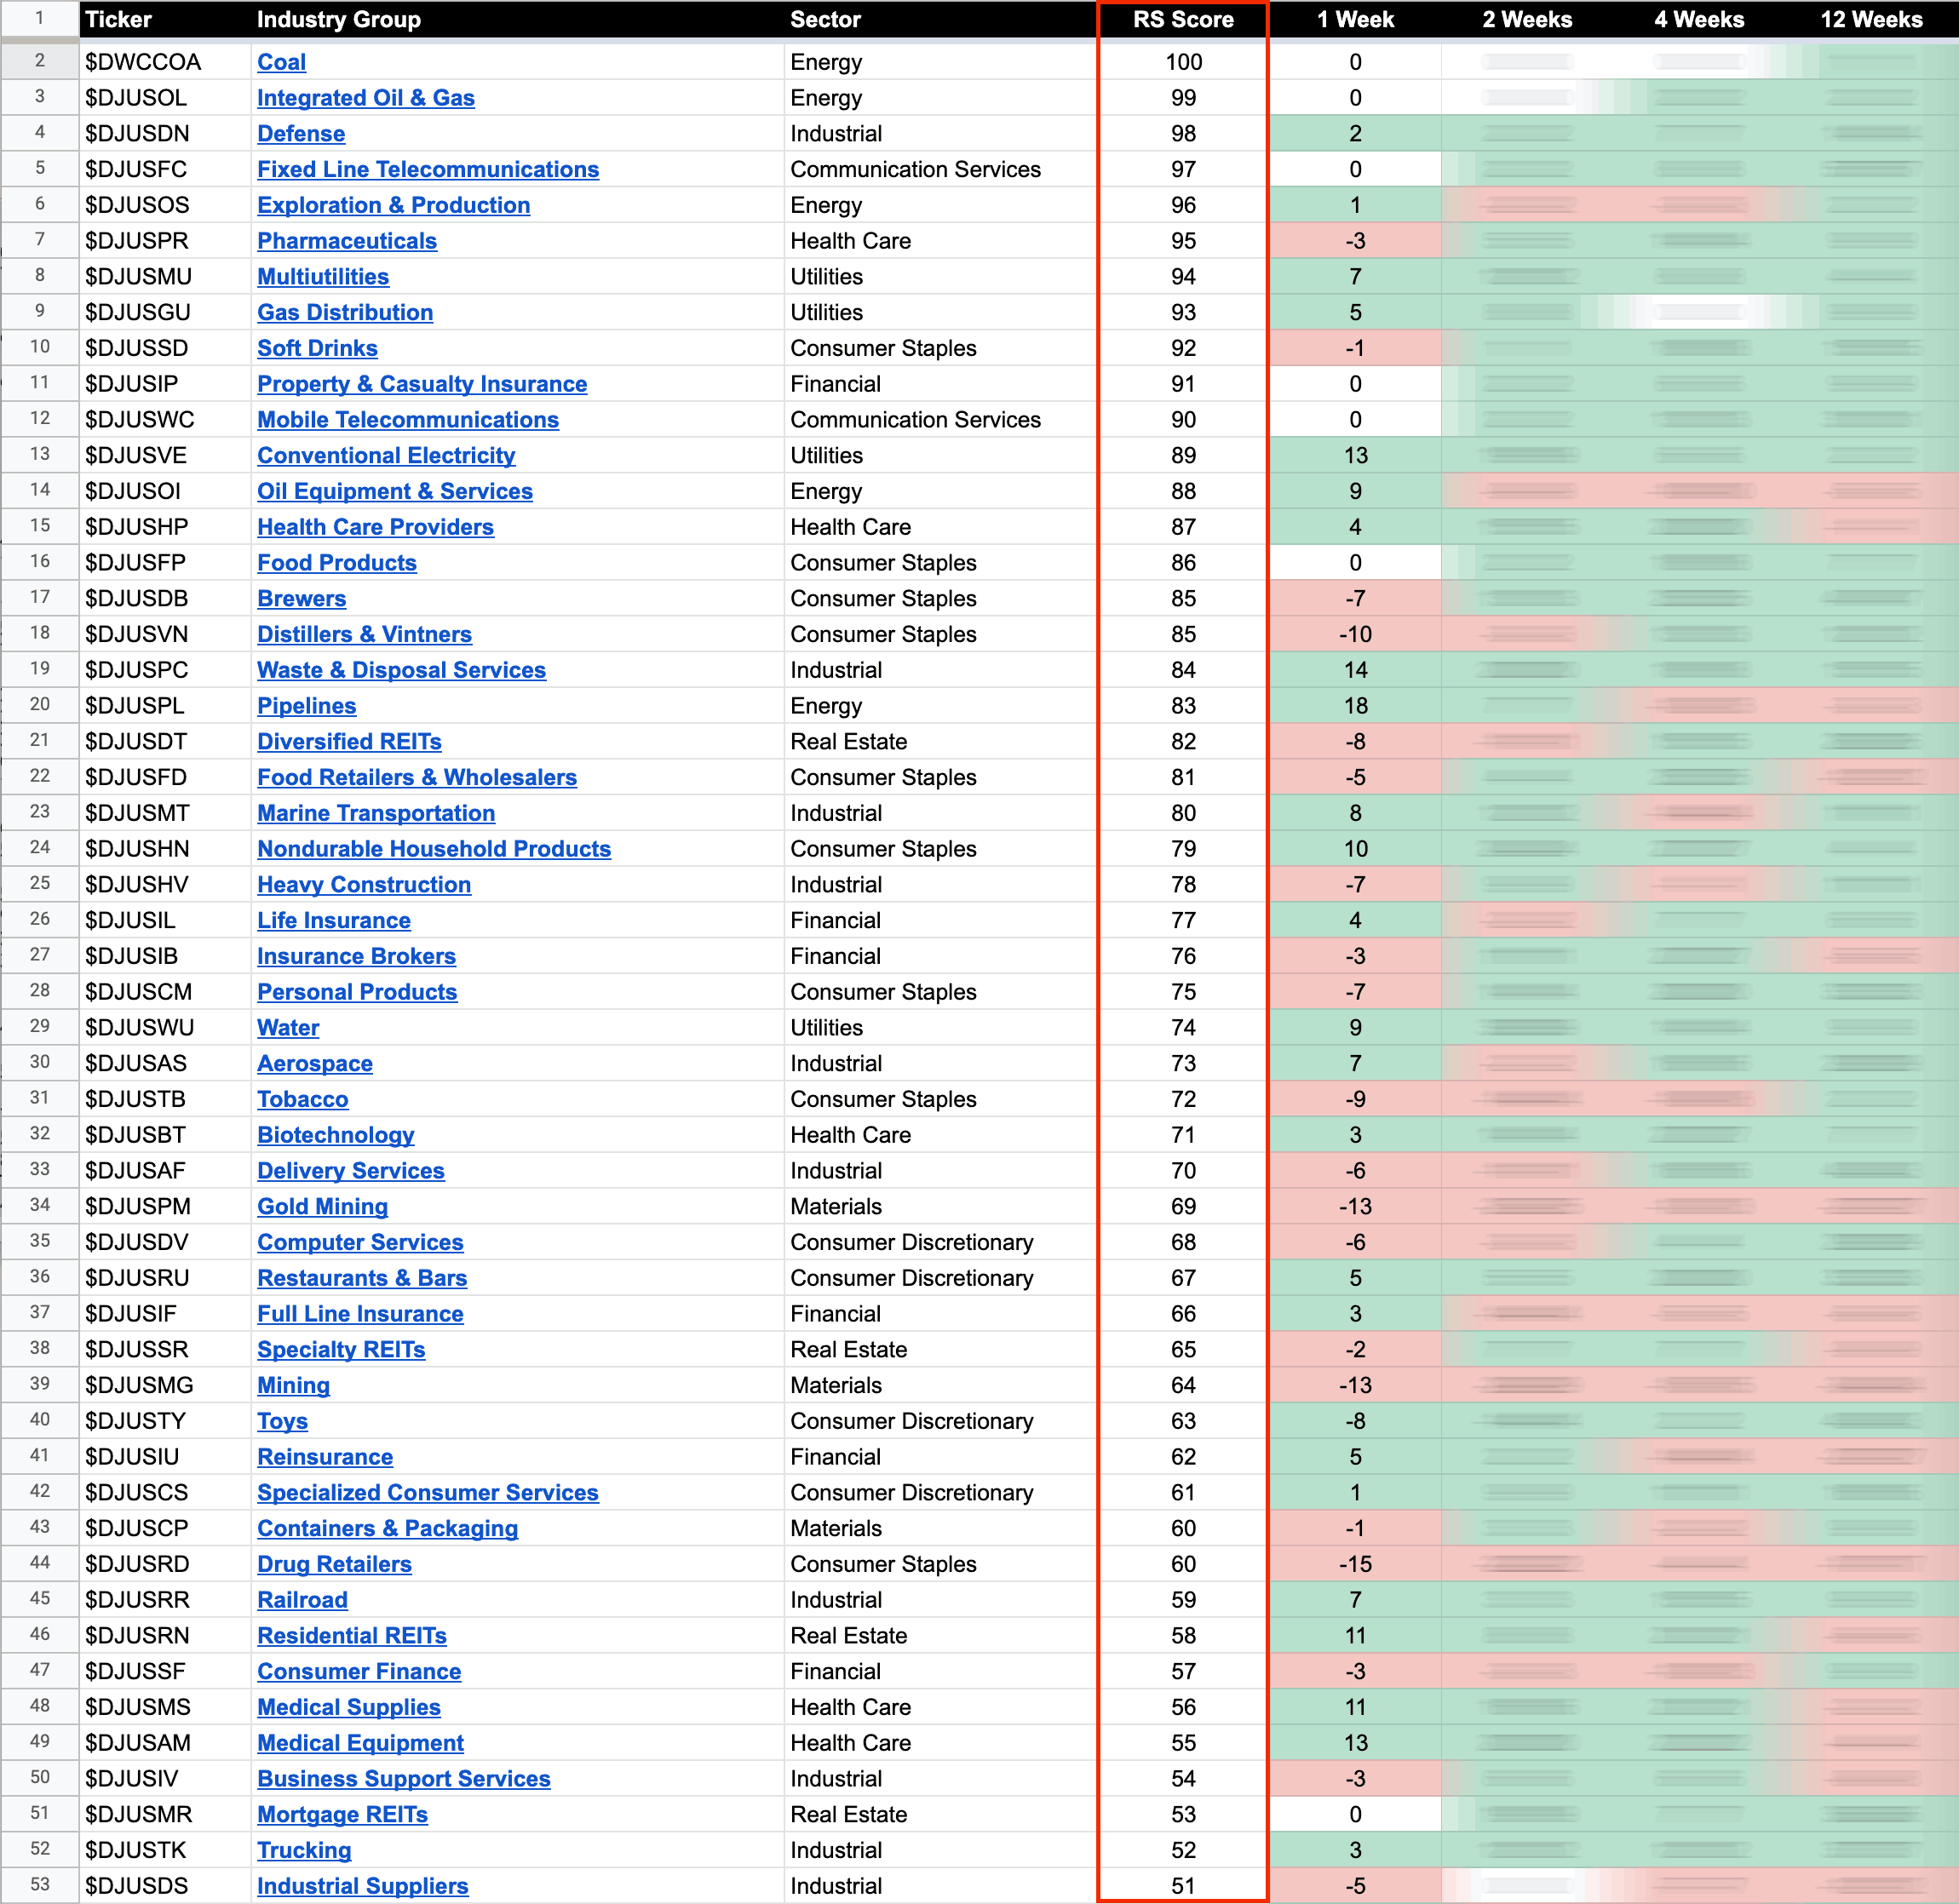
US Stocks Industry Groups Relative Strength Rankings
The purpose of the Relative Strength (RS) tables is to track the short, medium and long term RS changes of the individual groups to find the new leadership earlier than the crowd...
Read More
30 June, 2022
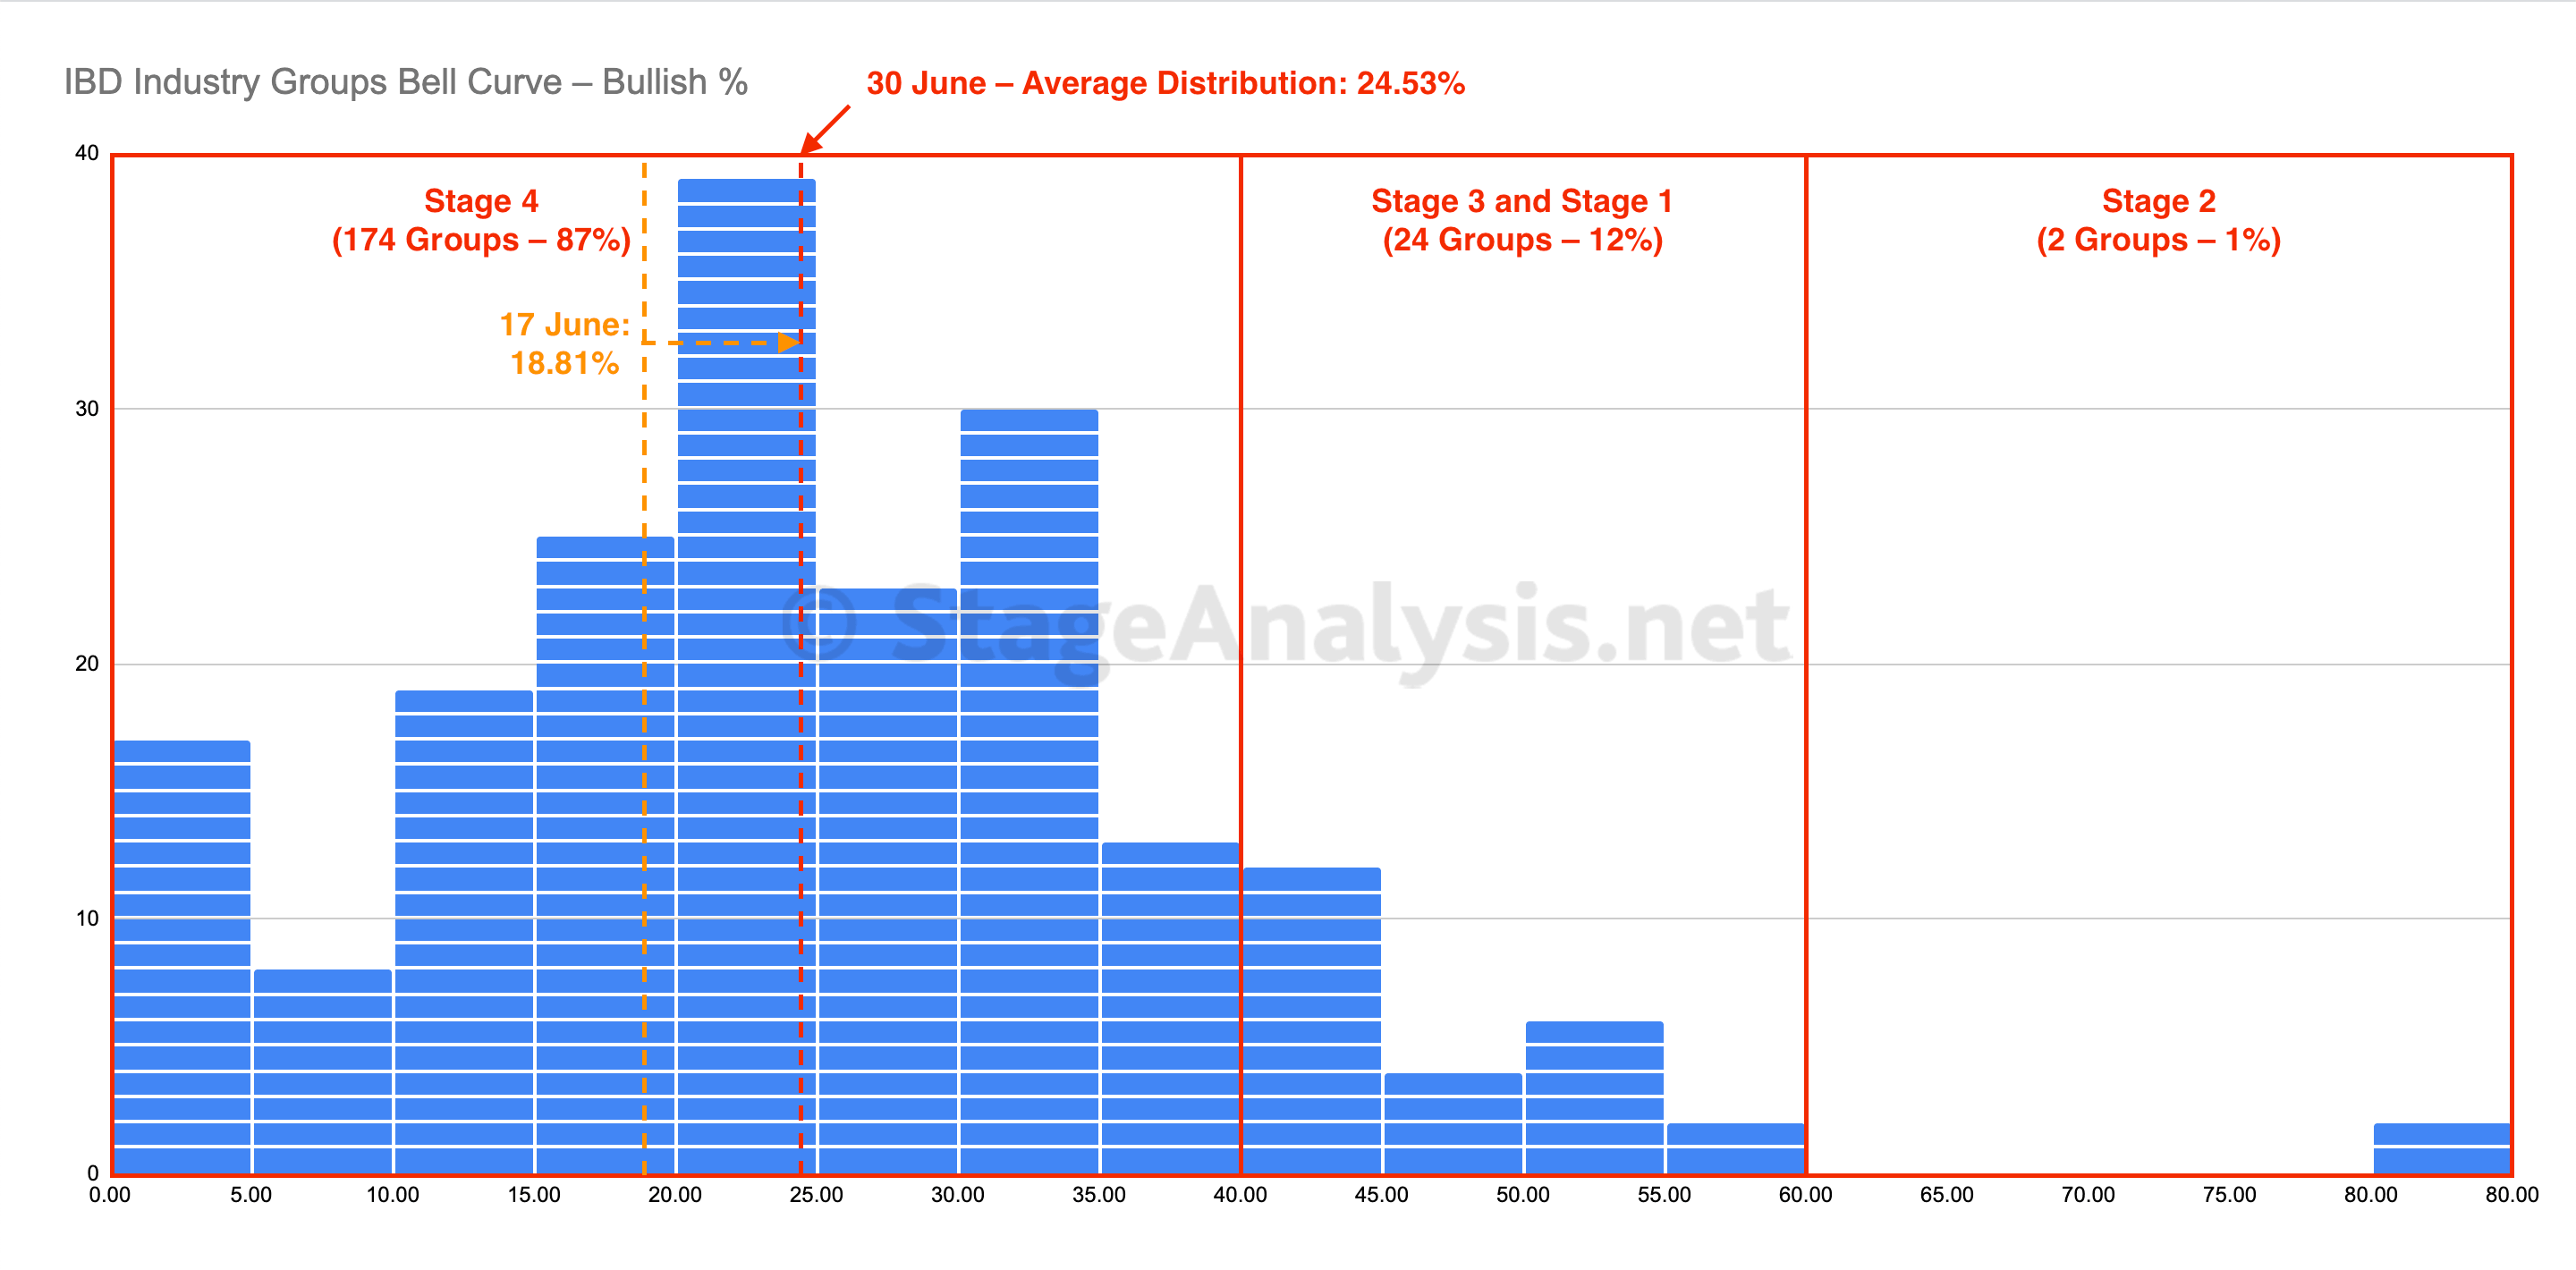
IBD Industry Groups Bell Curve – Bullish Percent
The IBD Industry Groups Bell Curve – Bullish Percent has improved slightly over the last few weeks with a gain of +5.72%, which moves the average distribution of the 200 Investors Business Daily (IBD) Industry Groups to 24.53%...
Read More
29 June, 2022
Stock Market Update and US Stocks Watchlist – 29 June 2022
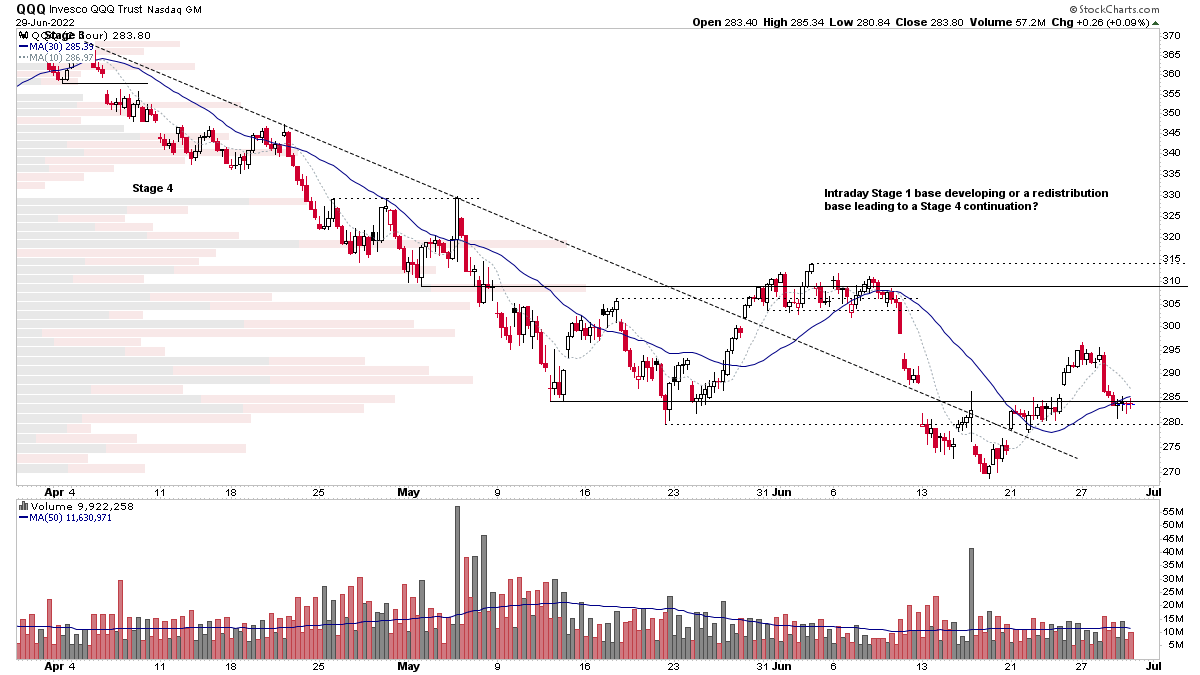
While there is no denying that the US stock market is currently in a major Stage 4 decline, with every major US stock index in Stage 4 on the weekly timeframe that the primary Stages are determined on. The more recent price action over the last month is much more subjective, as it differs across the indexes...
Read More
26 June, 2022
Stock Market Update and US Stocks Watchlist – 26 June 2022
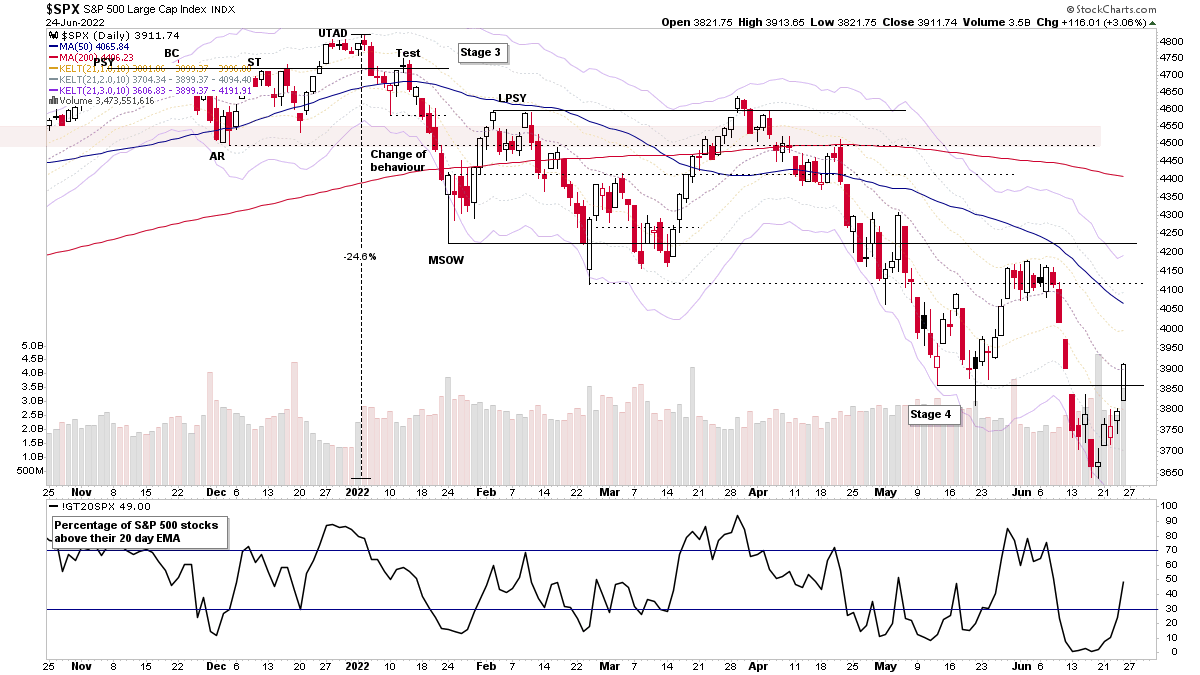
The stock market saw strong moves on Friday with the 5th attempt at a Follow Through Day (FTD) forming of this Stage 4 decline, which coincided with other short-term signals...
Read More

