There were 22 stocks highlighted from the US stocks watchlist scans today...
Read More

Blog
30 November, 2023
US Stocks Watchlist – 30 November 2023
29 November, 2023
Group Focus Video: Gold & Silver Miners – 29 November 2023 (38mins)
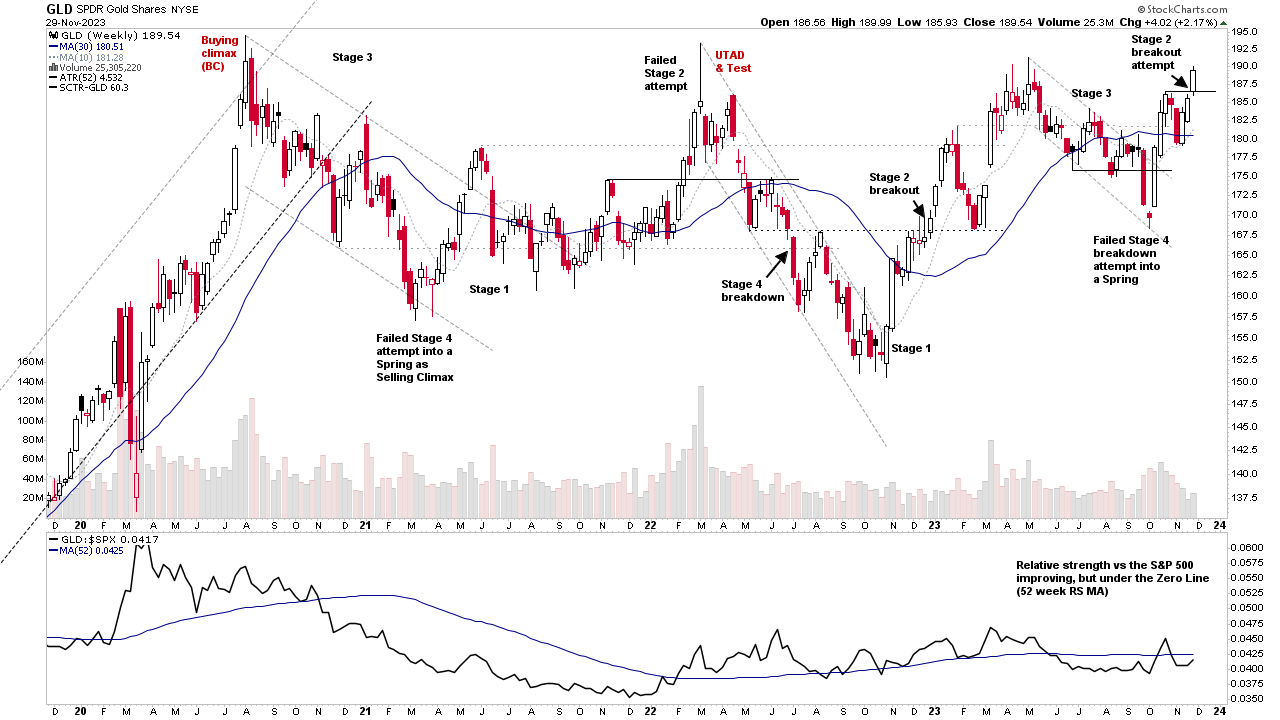
Special group focus video discussing the Gold, Silver and the Miners as physical gold attempts to move into Stage 2 for a second time this year.
Read More
28 November, 2023
Gold Miners Breakout Attempt and the US Stocks Watchlist – 28 November 2023
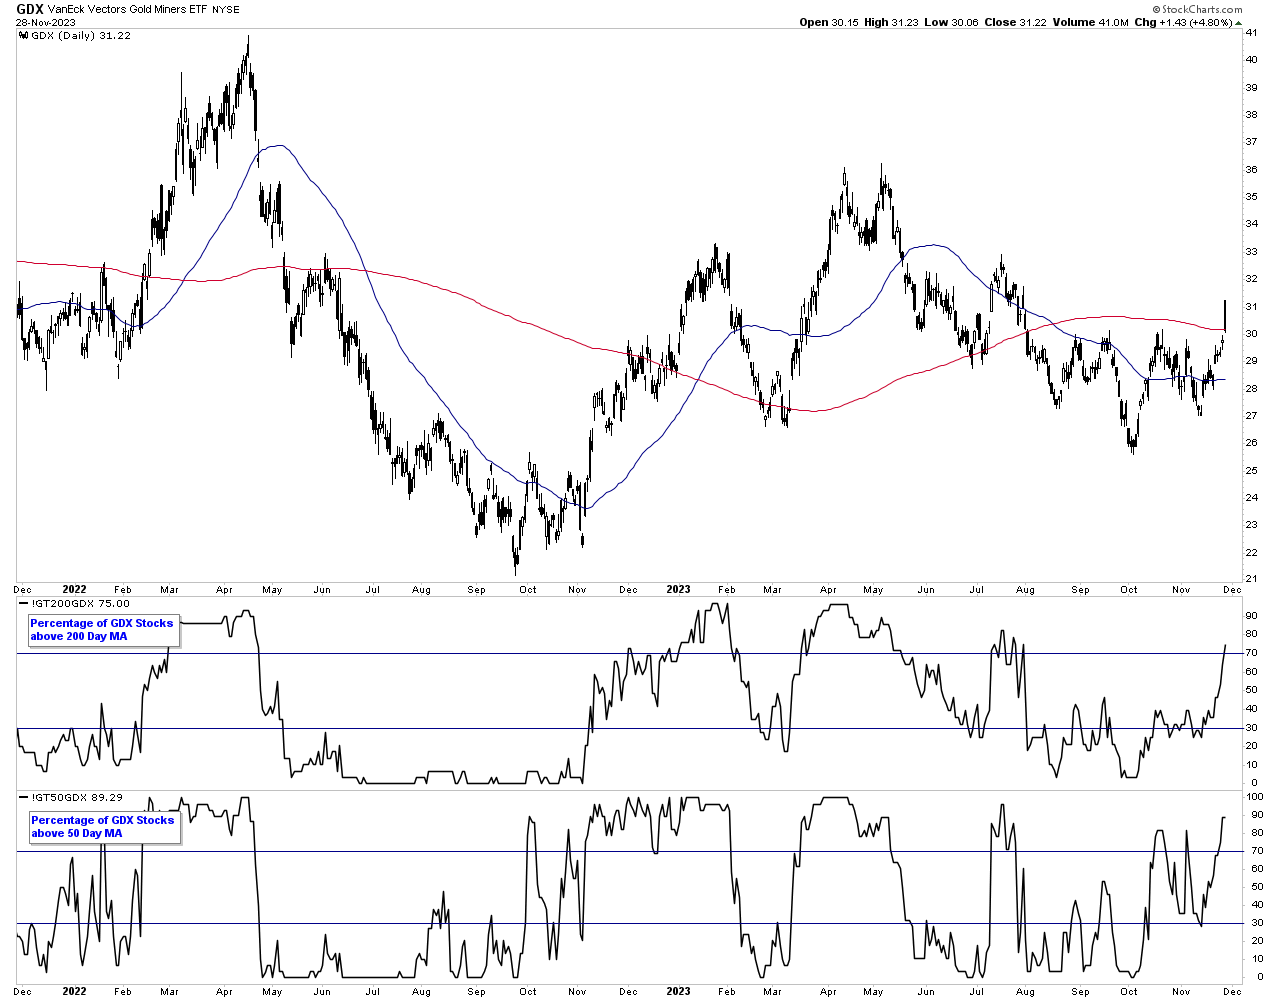
The Gold miners group has been coming back into focus over the last few weeks, with a point and figure double top breakout in the IBD industry group chart (Percentage above 30 week MA) on the 16th November and strong expansion in the moving average breadth with 75% of the GDX etf stocks now above their long-term 200 day MAs...
Read More
26 November, 2023
Stage Analysis Members Video – 26 November 2023 (1hr 19mins)
Stage Analysis members weekend video discussing the Major US Stock Market Indexes, Industry Groups Relative Strength (RS) Rankings, IBD Industry Group Bell Curve – Bullish Percent, the key Market Breadth Charts to determine the Weight of Evidence, Significant Weekly Bars and the US watchlist stocks in detail on multiple timeframes.
Read More
26 November, 2023
US Stocks Watchlist – 26 November 2023
There were 21 stocks highlighted from the US stocks watchlist scans today...
Read More
23 November, 2023
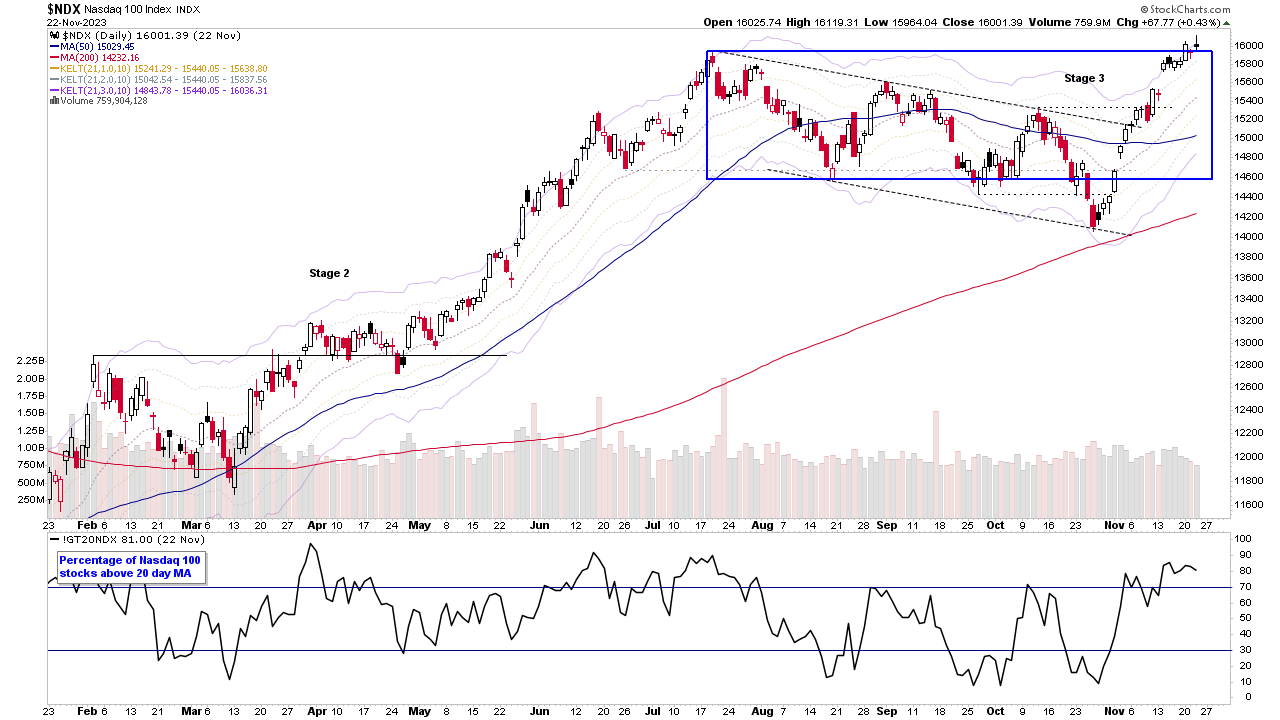
Nasdaq 100 Testing the Top of the Recent Range – Stage 2 Continuation or Developing UTAD?
The Nasdaq 100 has continued to strengthen over the last few weeks with a lockout rally since the Shakeout / Spring and gap at the start of the month. The majority of this price action has occurred in the right hand part of the multi-month base structure so far, clearing two internal swing highs within the range – which is a Change of Character and hence potentially may be Phase D of a re-accumulation base...
Read More
19 November, 2023
Stage Analysis Members Video – 19 November 2023 (1hr 15mins)
Stage Analysis members weekend video discussing the Major US Stock Market Indexes, Futures Charts, Industry Groups Relative Strength (RS) Rankings, IBD Industry Group Bell Curve – Bullish Percent, and the US watchlist stocks in detail on multiple timeframes.
Read More
19 November, 2023
US Stocks Watchlist – 19 November 2023
There were 24 stocks highlighted from the US stocks watchlist scans today...
Read More
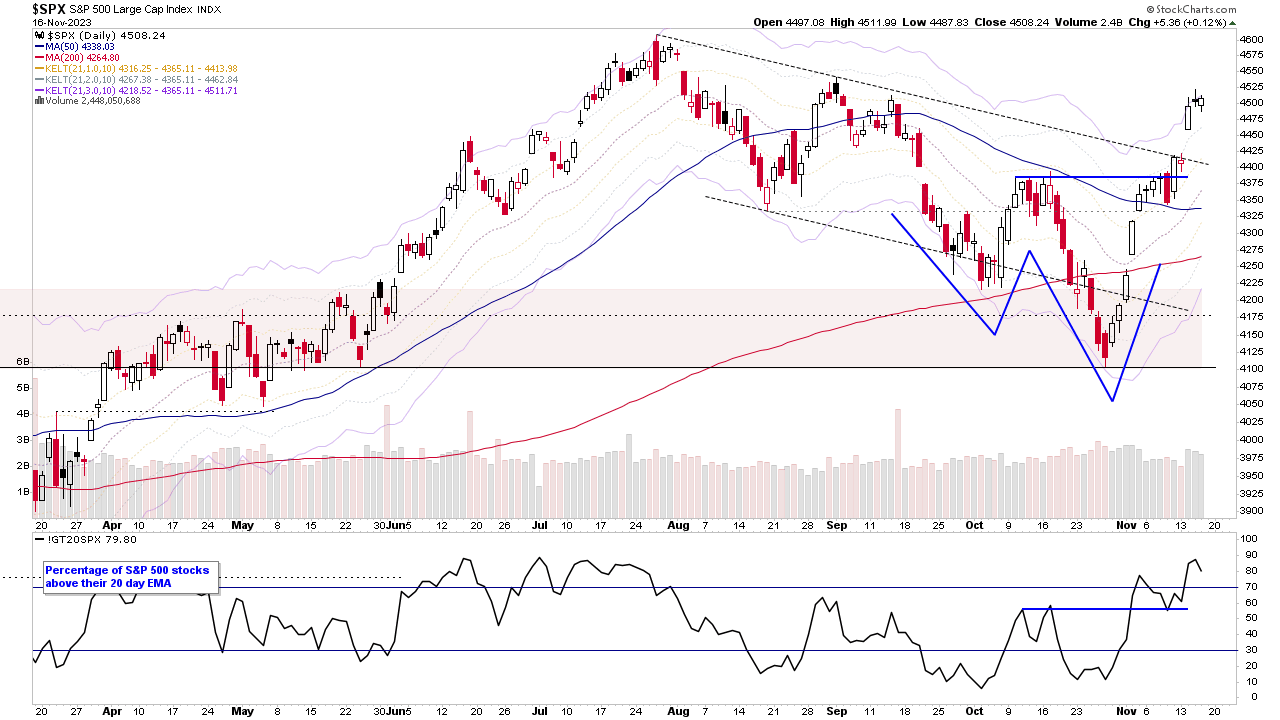
16 November, 2023
US Stocks Watchlist – 16 November 2023
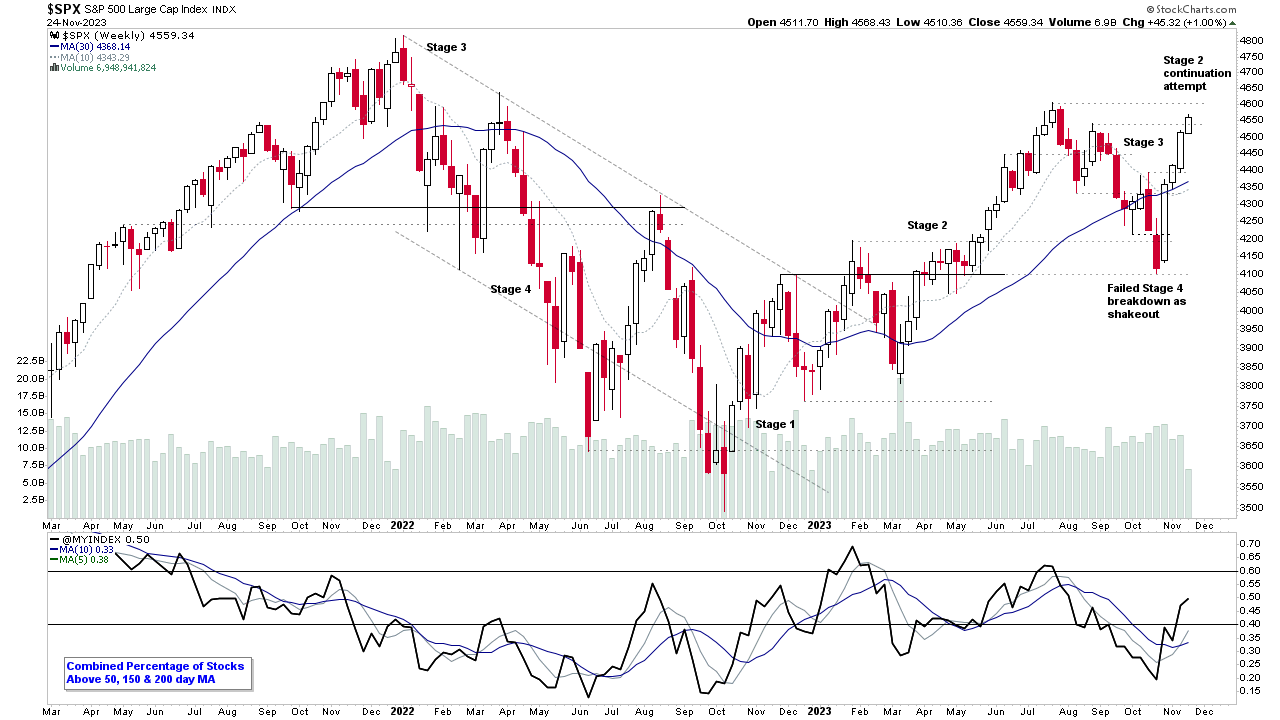
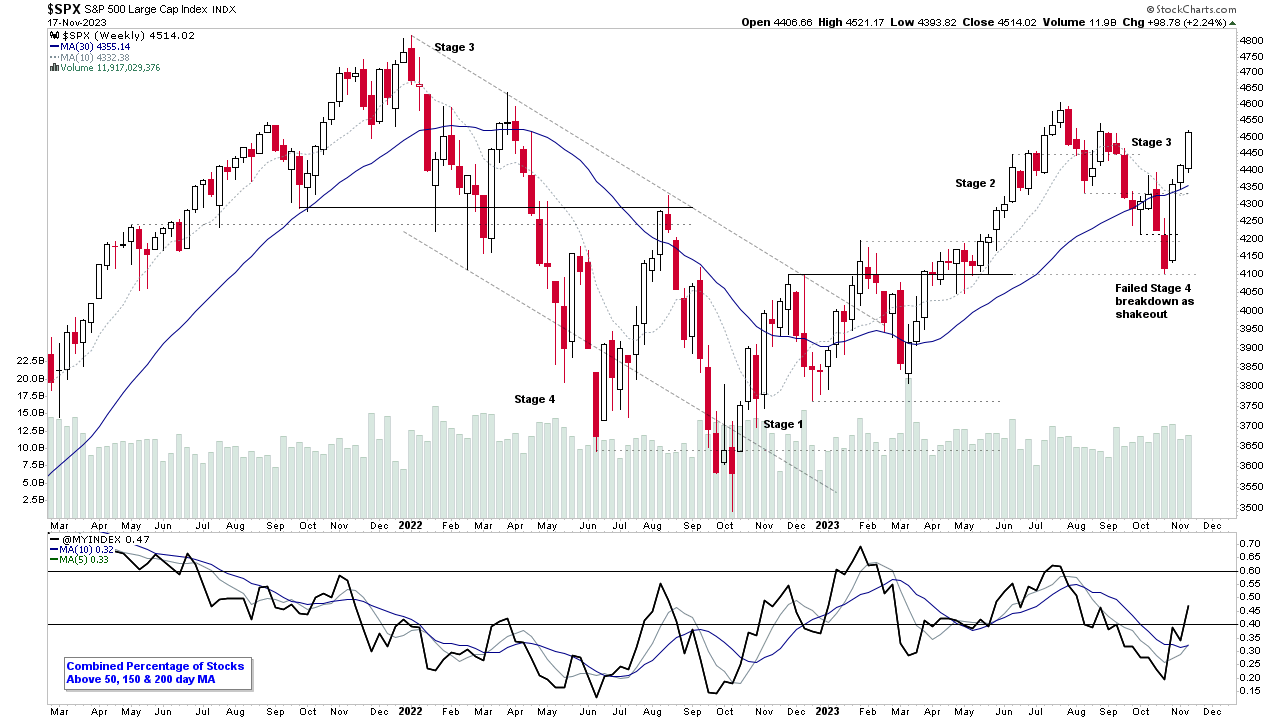
The S&P 500 consolidated for a second day, following the significant gap up on the 14th, which broke it out of the three month downtrend channel convincingly. And so the short-term change of behaviour, has now progressed into a possible change of character, as the pattern of lower highs and lower lows has been reversed, with an initial higher high and higher low developing since the recent swing low in late October...
Read More
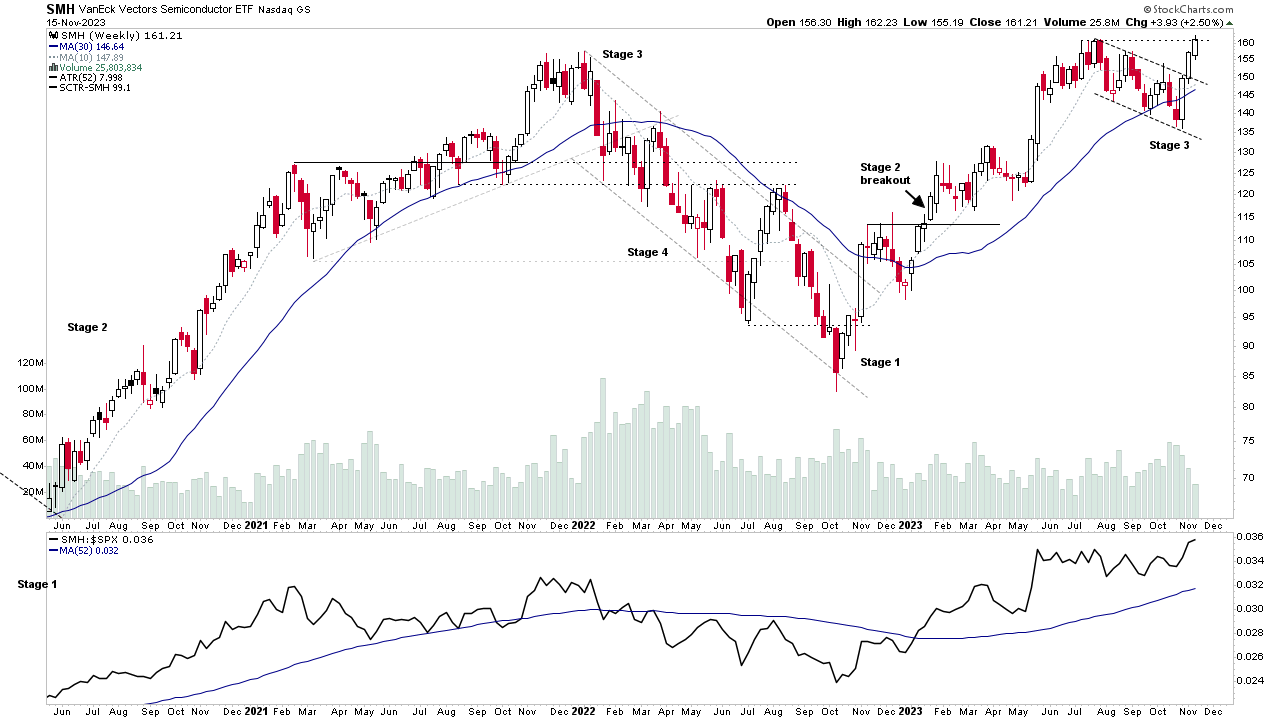
15 November, 2023
Group Focus Video: Semiconductors – 15 November 2023 (49mins)
A special group focus on the Semiconductors group, which has risen back to the top of the industry group relative strength (RS) rankings in the last few weeks, as the group chart attempts to breakout out to new 52 week highs from the recent Stage 3 structure...
Read More