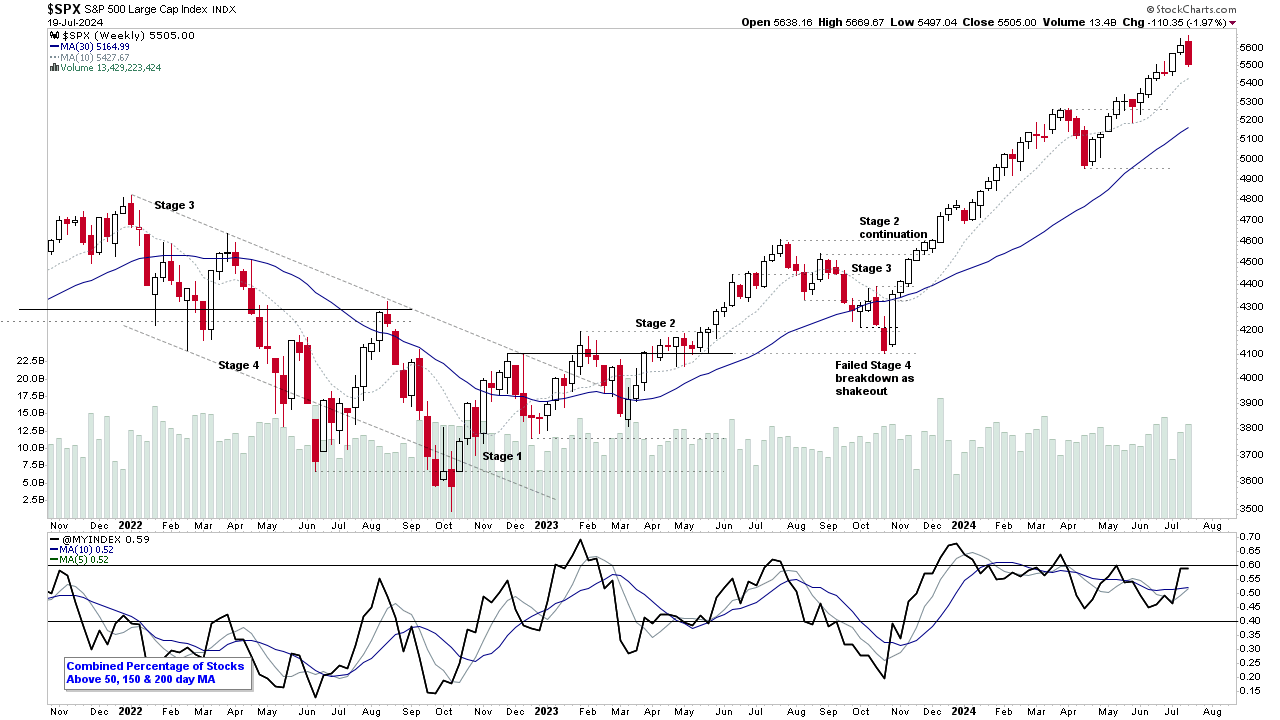
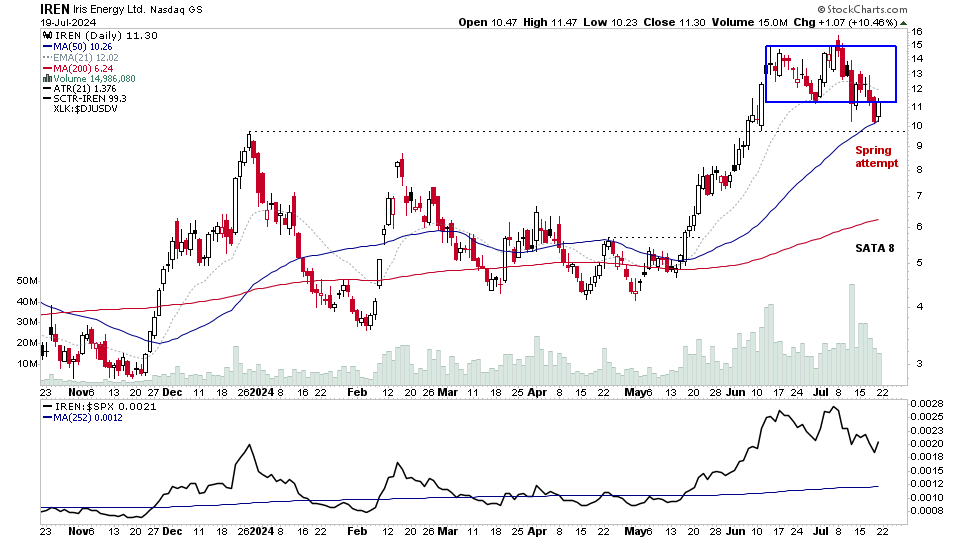
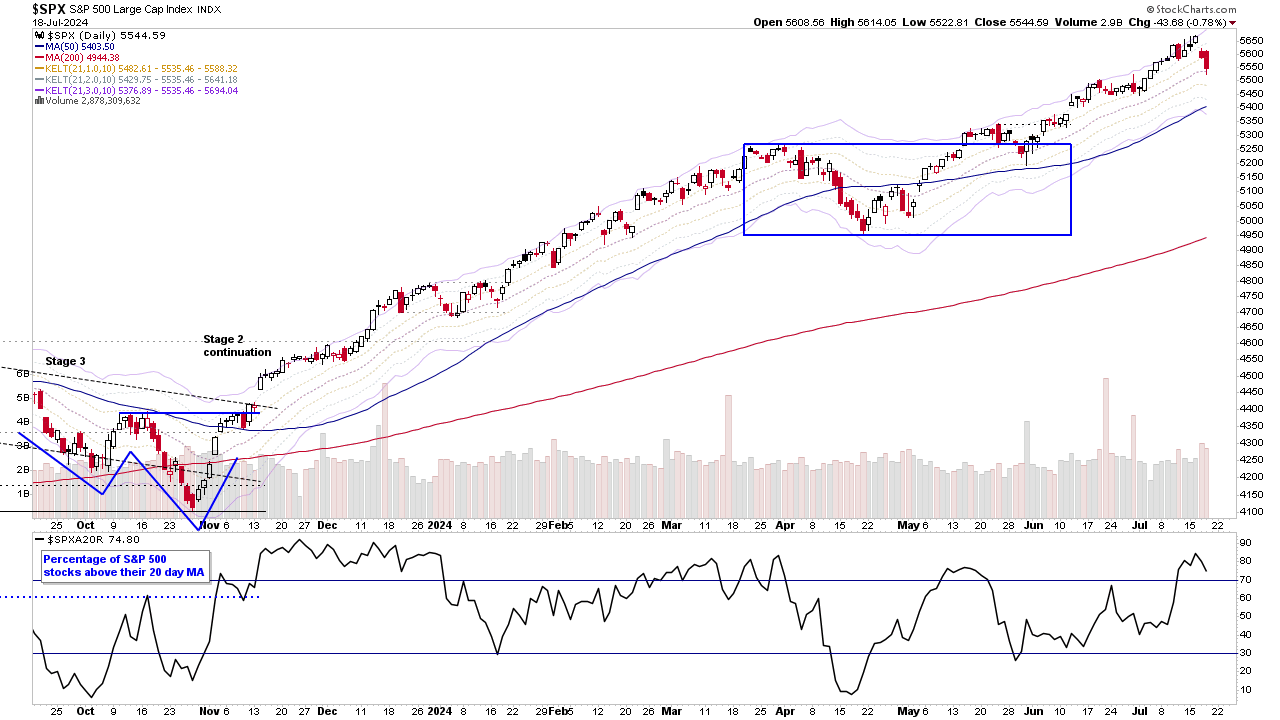
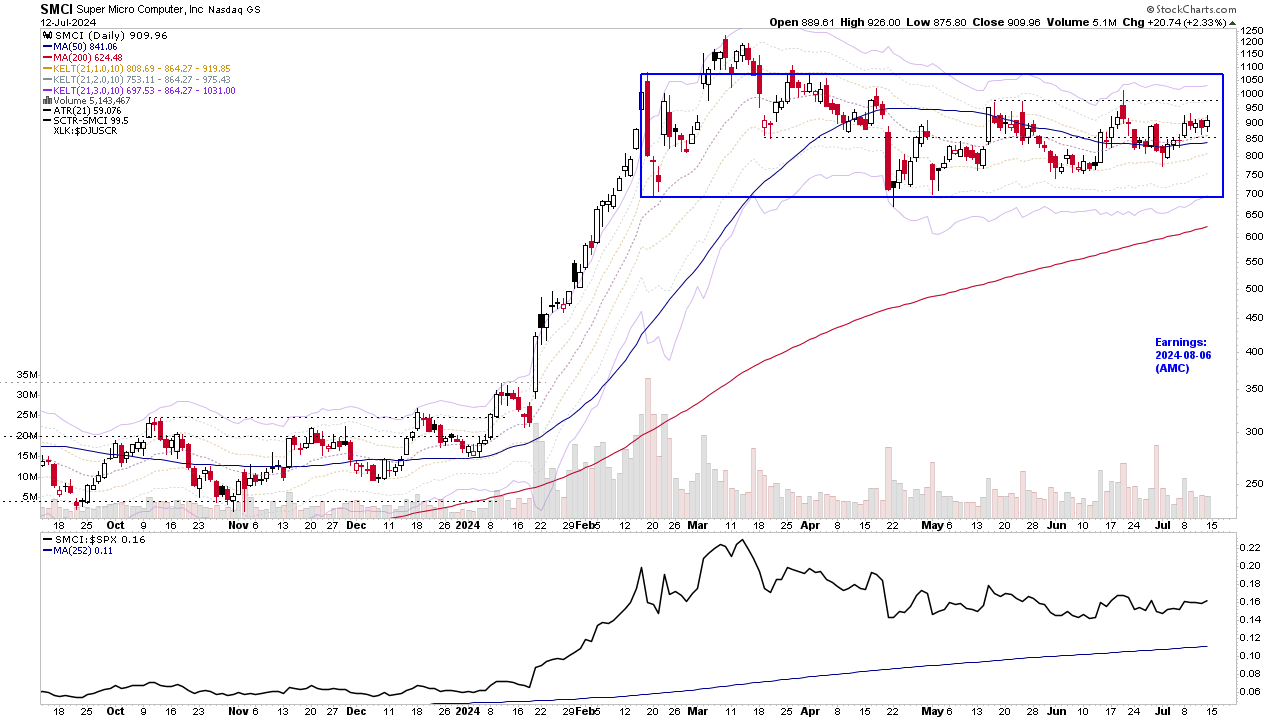
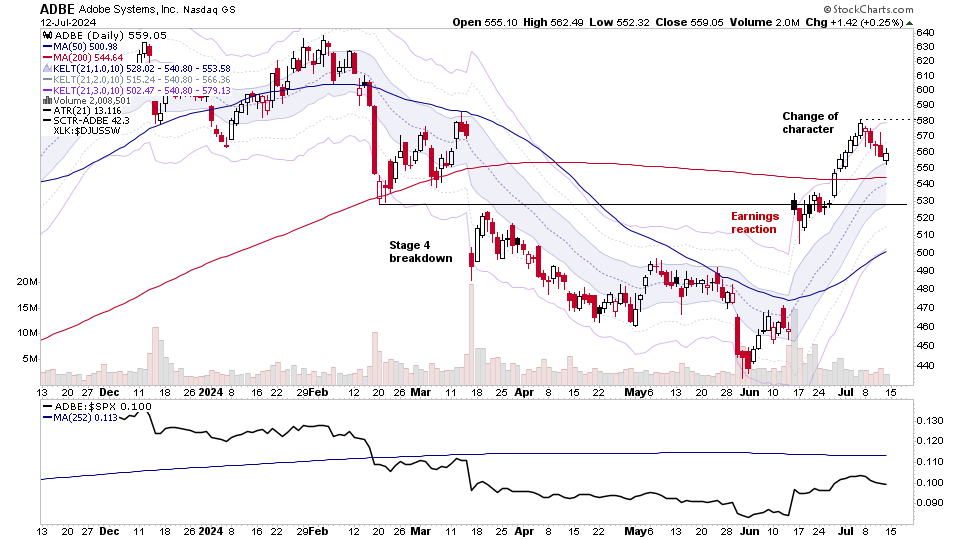
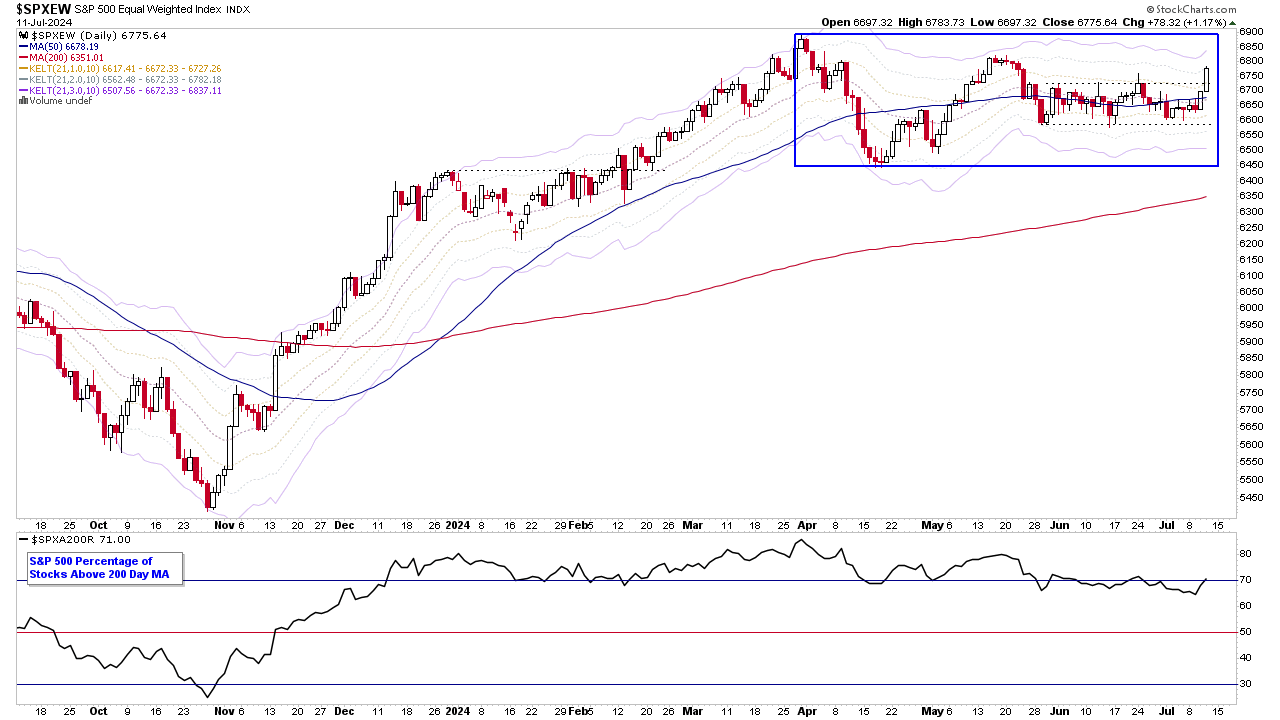
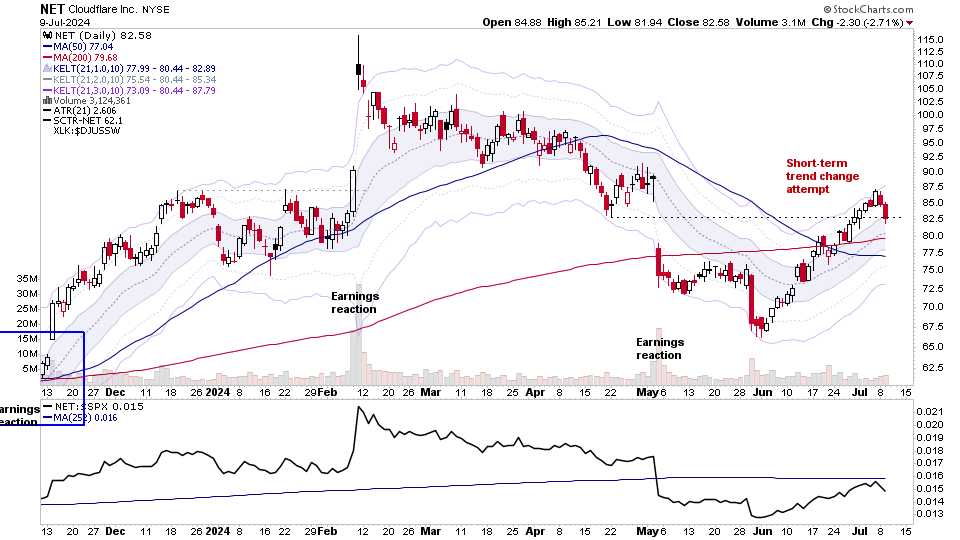
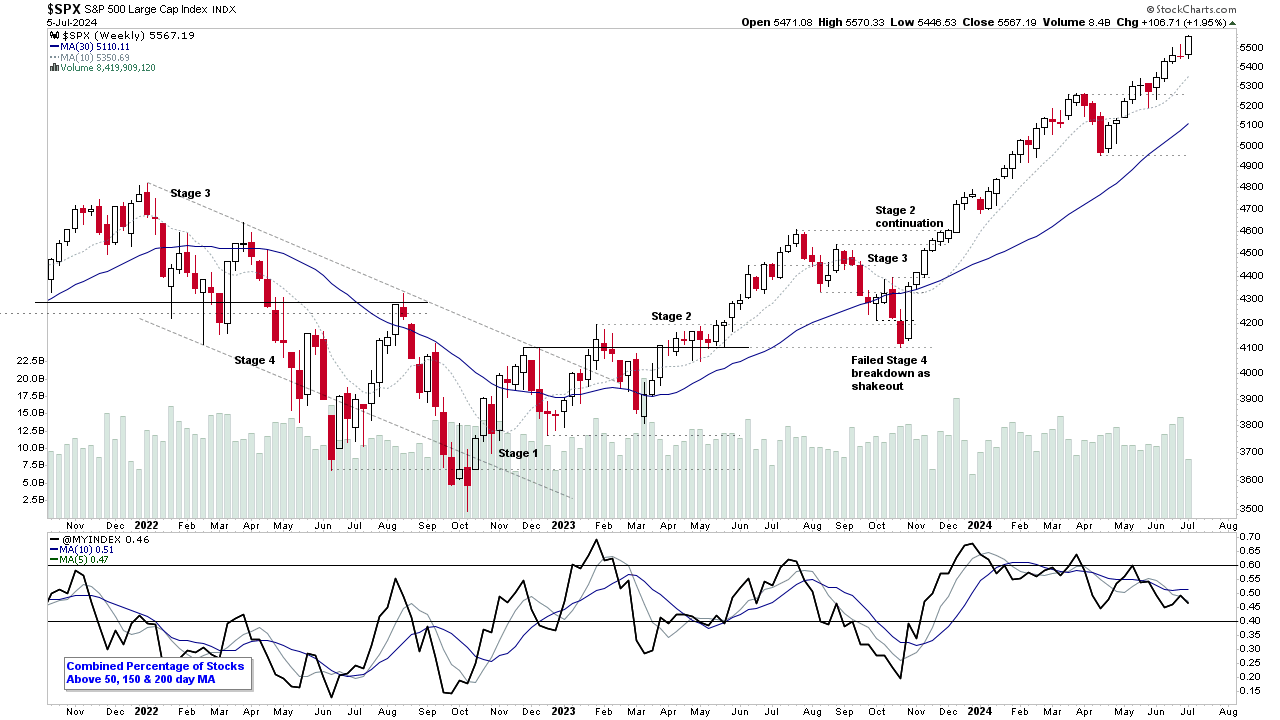
Stage Analysis members weekend video starting with a discussion of the US Watchlist Stocks in detail on multiple timeframes, the Industry Groups Relative Strength (RS) Rankings and GICS Group, Industry and Sub-industry Bell Curves with notable changes, the key Market Breadth Charts to determine the Weight of Evidence, Significant Weekly Bars, and the Major US Stock Market Indexes.
Read More
Blog
21 July, 2024
Stage Analysis Members Video – 21 July 2024 (52mins)
21 July, 2024
US Stocks Watchlist – 21 July 2024
There were 16 stocks highlighted from the US stocks watchlist scans today...
Read More
18 July, 2024
US Stocks Watchlist – 18 July 2024
There were 12 stocks highlighted from the US stocks watchlist scans today...
Read More
18 July, 2024
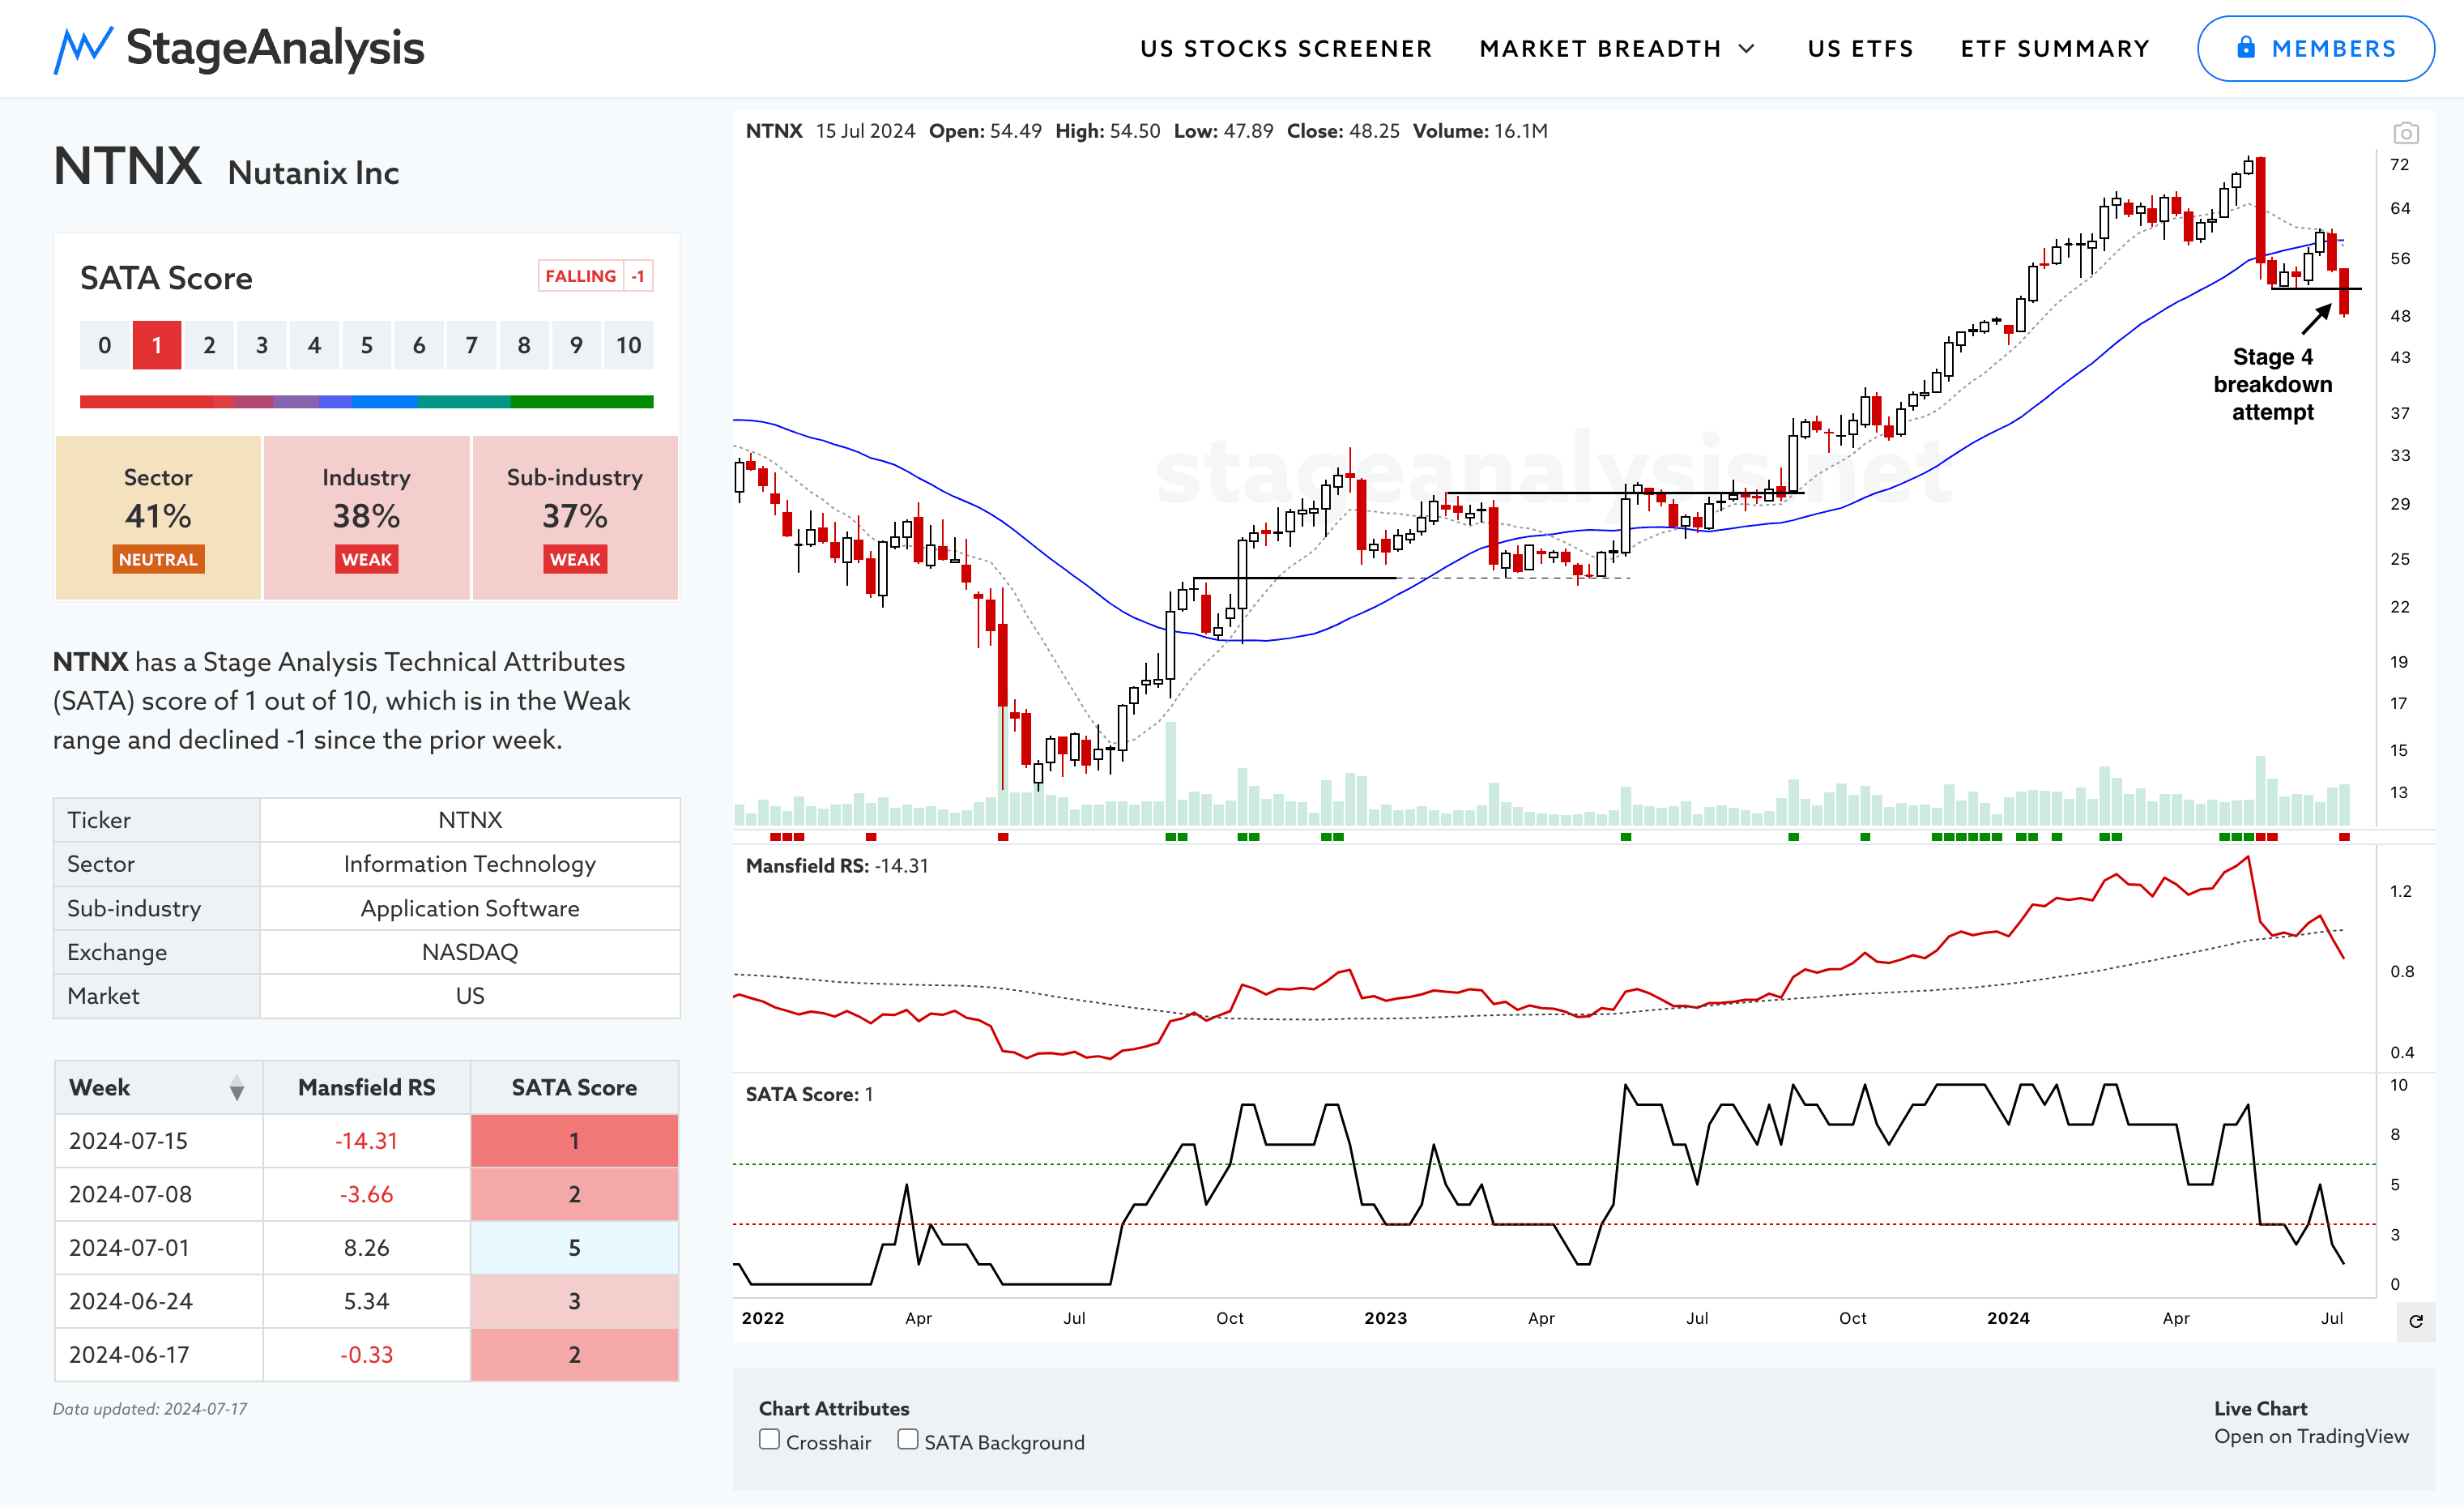
Scanning for Stage 4 Breakdown Attempts
One of the great things about the US Stocks Screener on the Stage Analysis website is that it makes it easy to find stocks making both Stage 2 breakouts and Stage 4 breakdowns. So I thought today I would focus on showing you how to find the find Stage 4 breakdowns...
Read More
16 July, 2024
Video: New Sector Pages Added - 16 July 2024
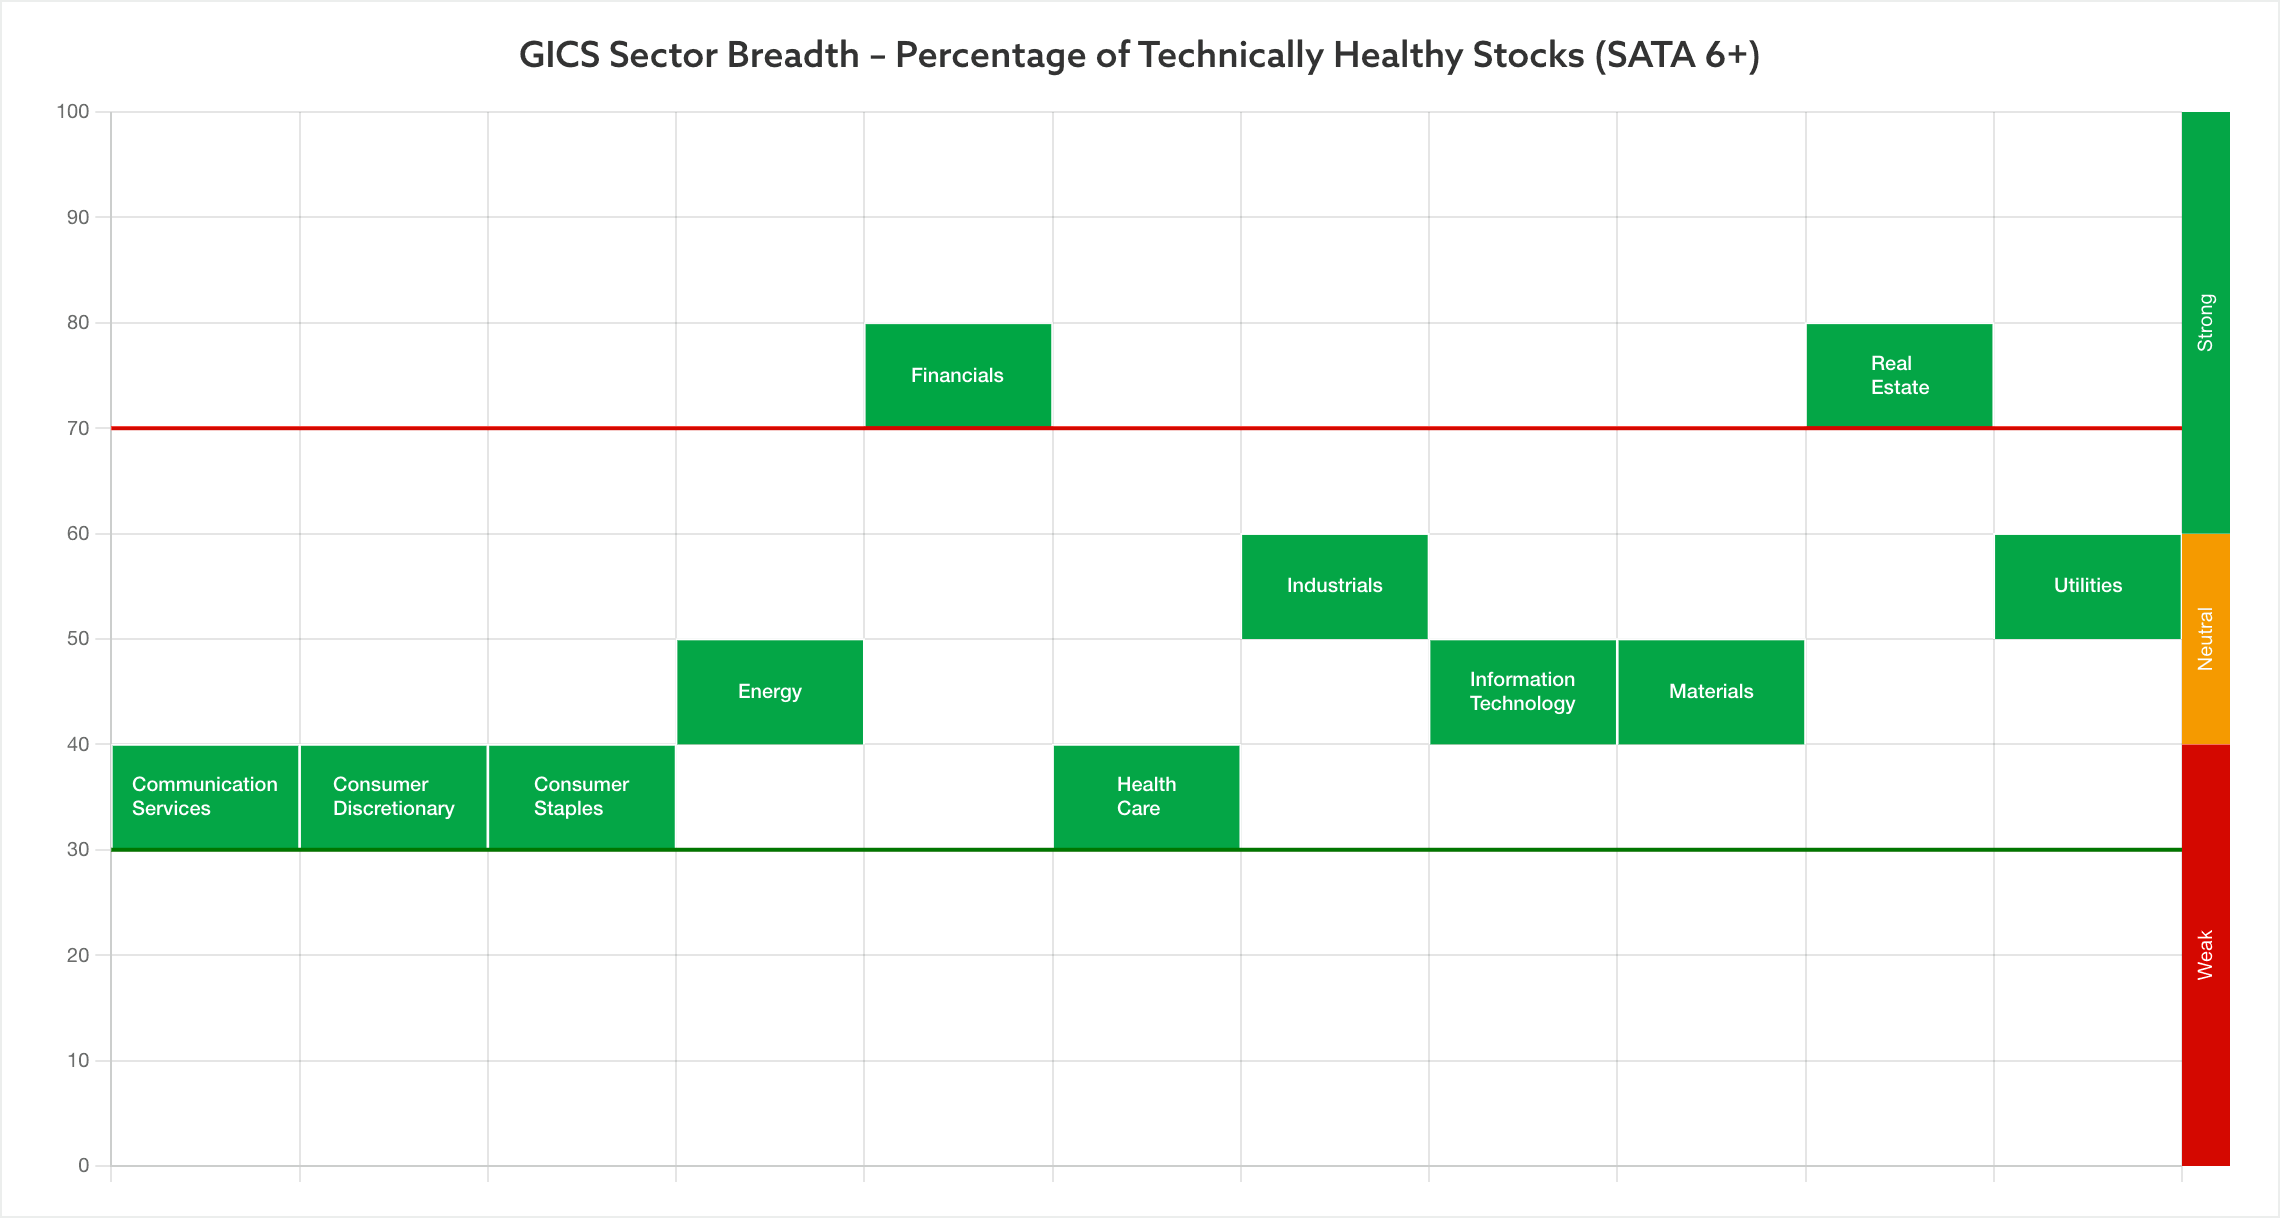
More new features have been added to the Stage Analysis website this week, with the introduction of the GICS Sectors page, and the 11 individual Sector pages which include the SATA tables of the individual stocks in order of SATA score and Mansfield Relative Strength. Plus the unique SATA 6+ breadth chart and the Percentage of Stocks Above 30 week MA chart for each sector...
Read More
14 July, 2024
Stage Analysis Members Video – 14 July 2024 (1hr)
Stage Analysis members weekend video with a discussion of the US Watchlist Stocks in detail on multiple timeframes, Upgraded GICS Filters in the Stage Analysis Screener, the Industry Groups Relative Strength (RS) Rankings and GICS Group, Industry and Sub-industry Bell Curves with notable changes, the key Market Breadth Charts to determine the Weight of Evidence, Significant Weekly Bars, and the Major US Stock Market Indexes.
Read More
14 July, 2024
US Stocks Watchlist – 14 July 2024
There were 17 stocks highlighted from the US stocks watchlist scans today...
Read More
11 July, 2024
US Stocks Watchlist – 11 July 2024
There were 24 stocks highlighted from the US stocks watchlist scans today...
Read More
09 July, 2024
US Stocks Watchlist – 9 July 2024
There were 16 stocks highlighted from the US stocks watchlist scans today...
Read More
07 July, 2024
Stage Analysis Members Video – 7 July 2024 (1hr 1min)
Stage Analysis members weekend video beginning with a discussion of Bitcoin & Ethereum as they both test their respective Stage 4 levels, followed by the US Watchlist Stocks in detail on multiple timeframes, the Industry Groups Relative Strength (RS) Rankings and GICS Group, Industry and Sub-industry Bell Curves with notable changes, the key Market Breadth Charts to determine the Weight of Evidence, Significant Weekly Bars, and the Major US Stock Market Indexes.
Read More

