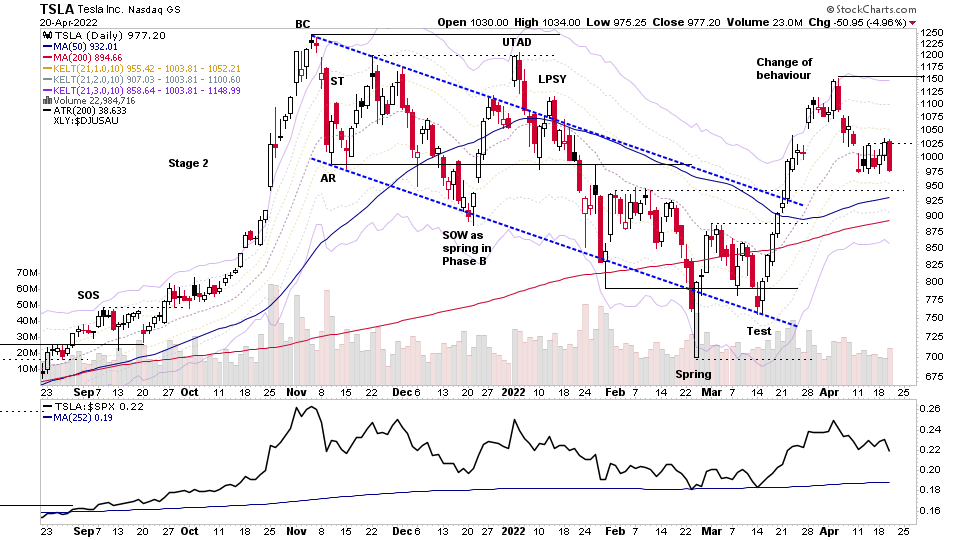
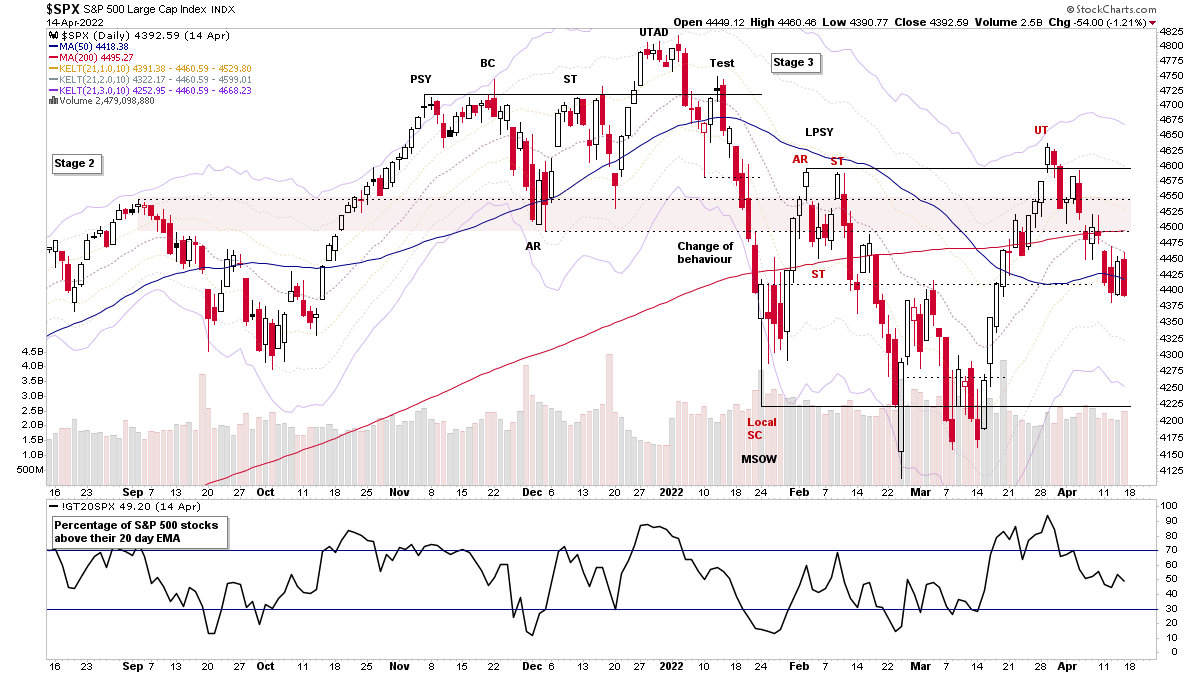
Stage Analysis Members Midweek Video with a FREE preview covering the Stage 4 continuation breakdown in NFLX Netflix, and then members only content going through the Major Indexes, Short Term Market Breadth Charts, todays after hours moves from earnings in TSLA and UAL. The Uranium group attempt to rebound and the US Stocks Watchlist and Group Themes in more detail.
Read More
Blog
17 April, 2022
Stage Analysis Members Weekend Video – 17 April 2022 (1hr 14mins)
This weekends Stage Analysis Members Video features analysis of the Major US Stock Market Indexes – S&P 500, Nasdaq Composite, Russell 2000 etc, plus a detailed run through of the key Market Breadth charts (with exclusive charts only on Stage Analysis) in order to determine the Weight of Evidence...
Read More
14 April, 2022
Stage Analysis Members Midweek Video - 14 April 2022 (50 mins)
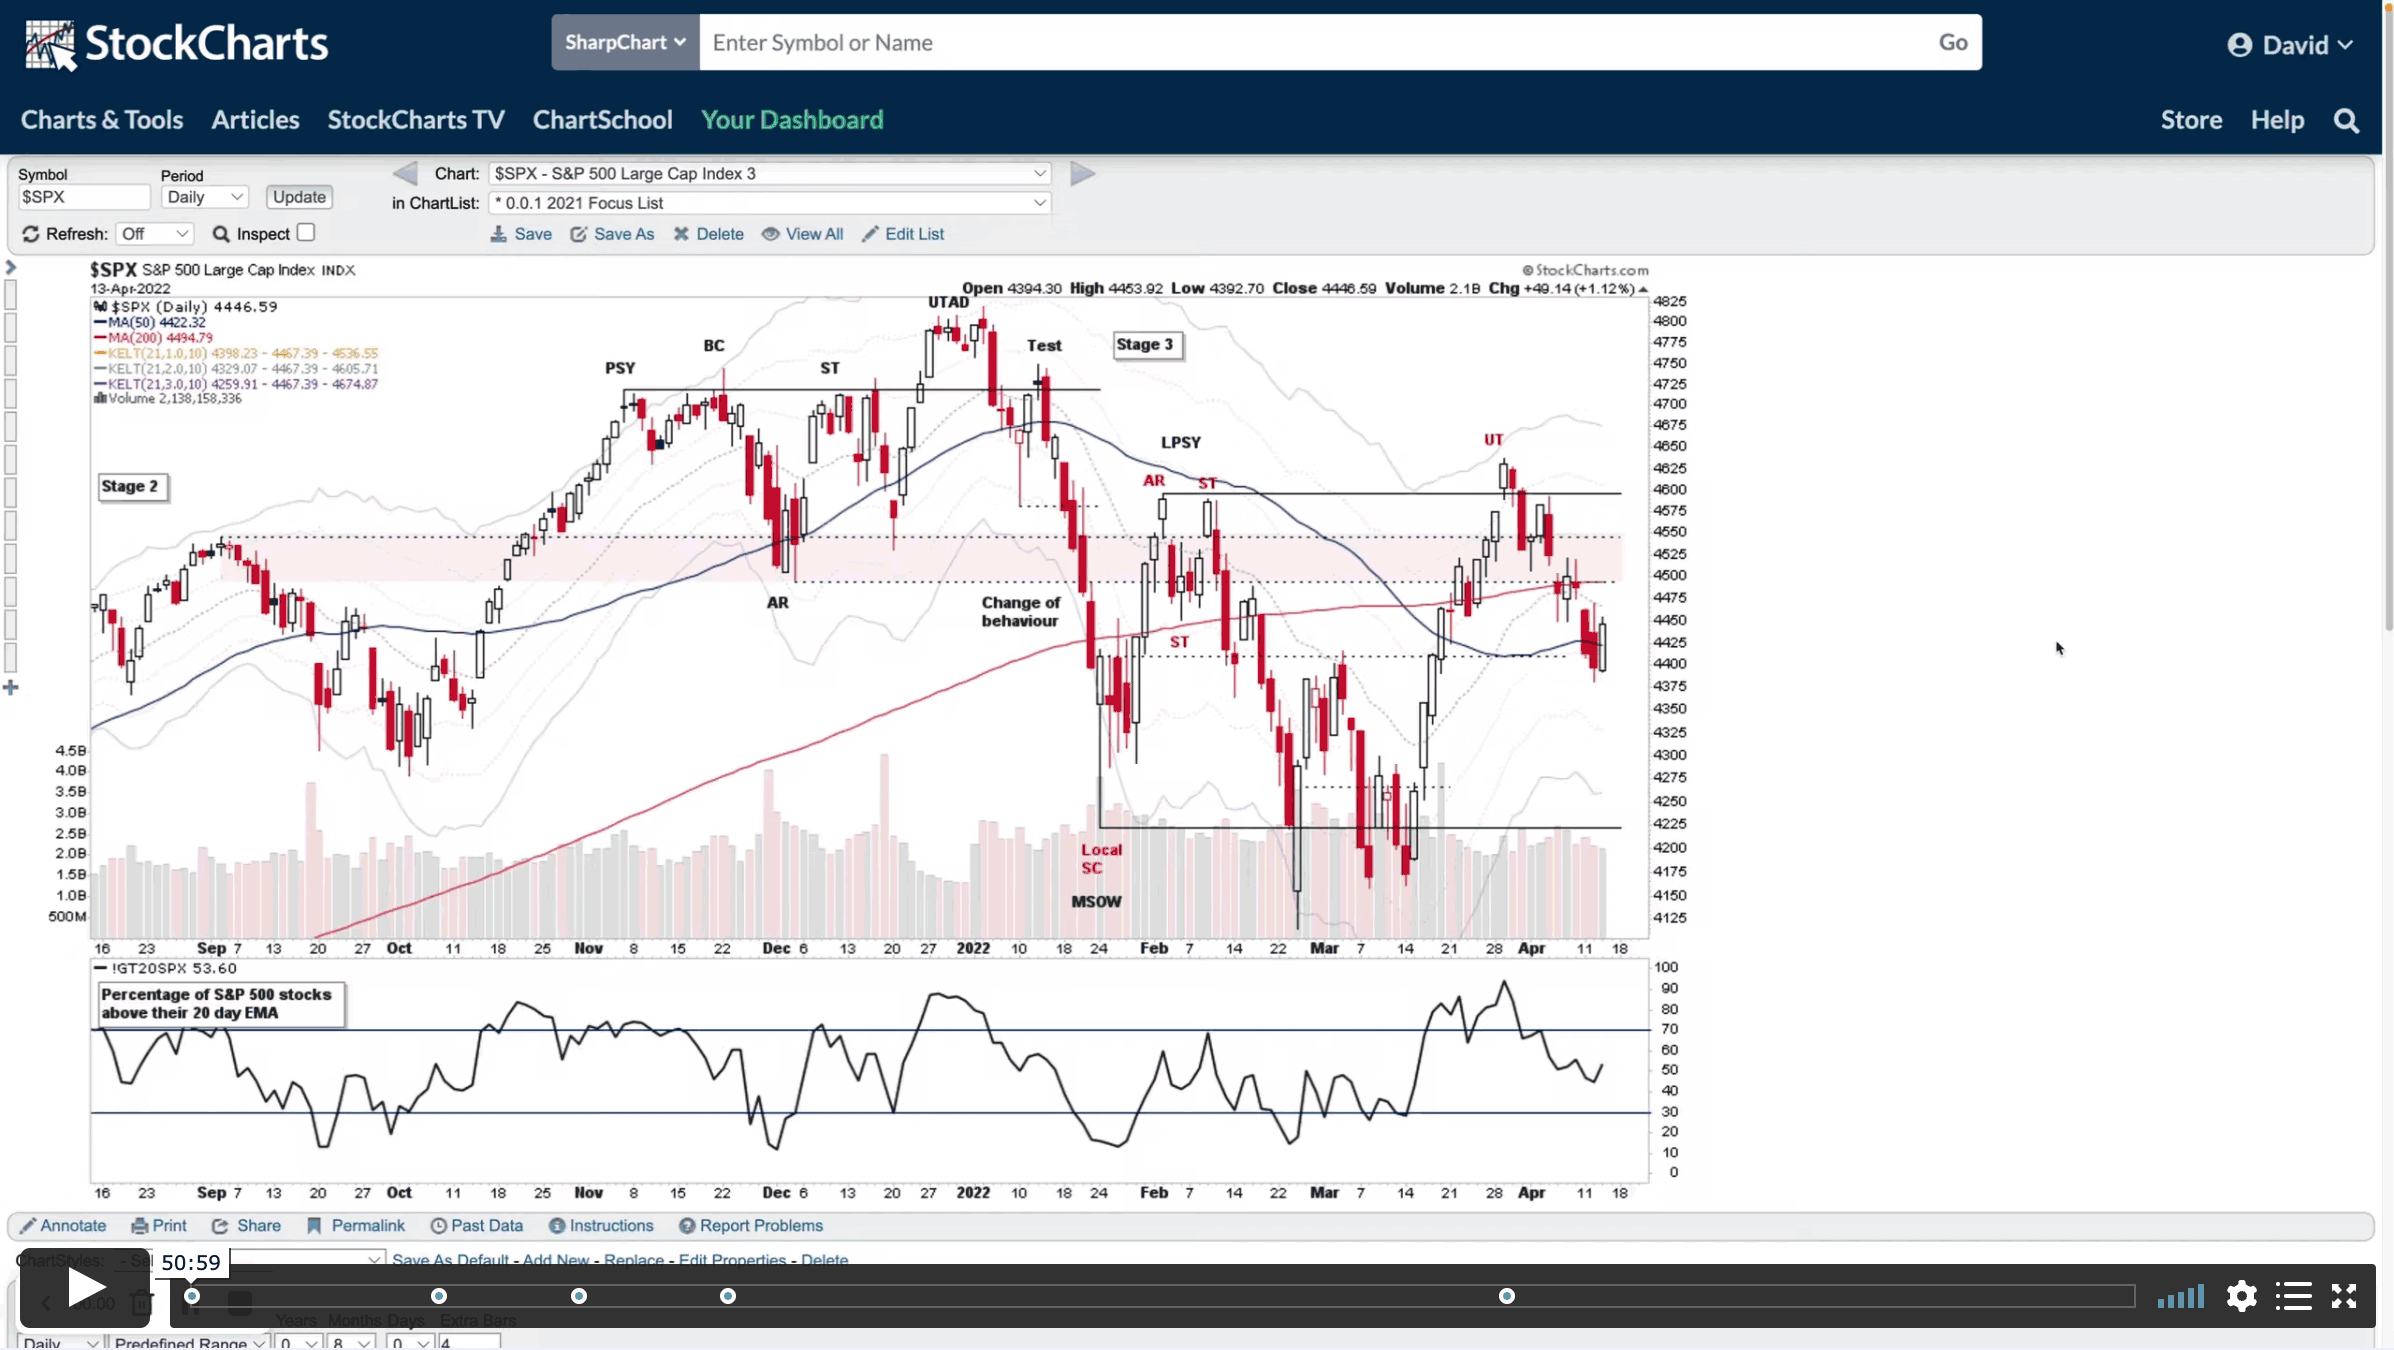
The Stage Analysis Members Midweek Video covers the major indexes, short term market breadth charts, AAPL and TSLA attempts to the hold their short term MAs.The group themes from the last week, and the US watchlist stocks in more detail...
Read More
10 April, 2022
Stage Analysis Members Weekend Video – 10 April 2022 (1hr 42mins)
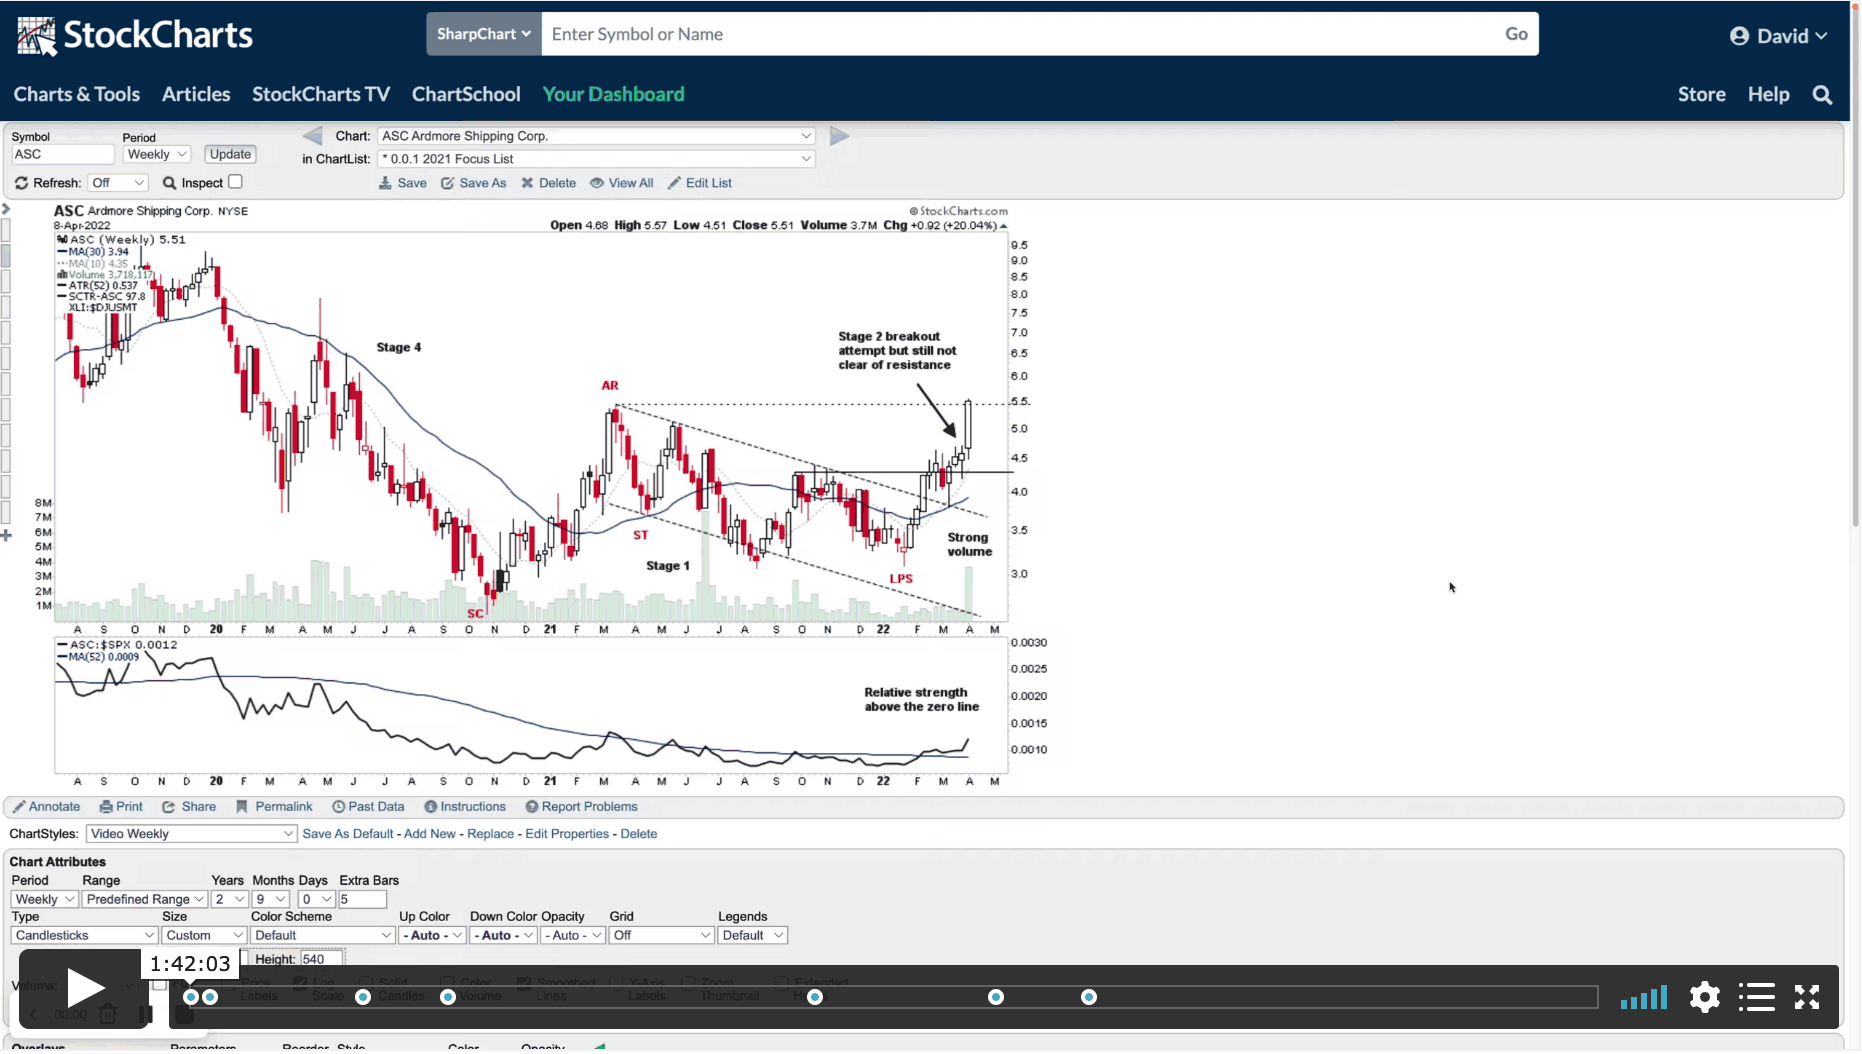
This weekends Stage Analysis Members Video features the Major Indexes – Nasdaq, S&P 500, Russell 2000, Sector Relative Strength, Market Breadth charts to determine the Weight of Evidence, Industry Group Relative Strength. A Group Focus on the Uranium Stocks and the US Stocks Watchlist in detail with marked up charts and explanations of the group themes and what I'm looking for in various stocks.
Read More
07 April, 2022
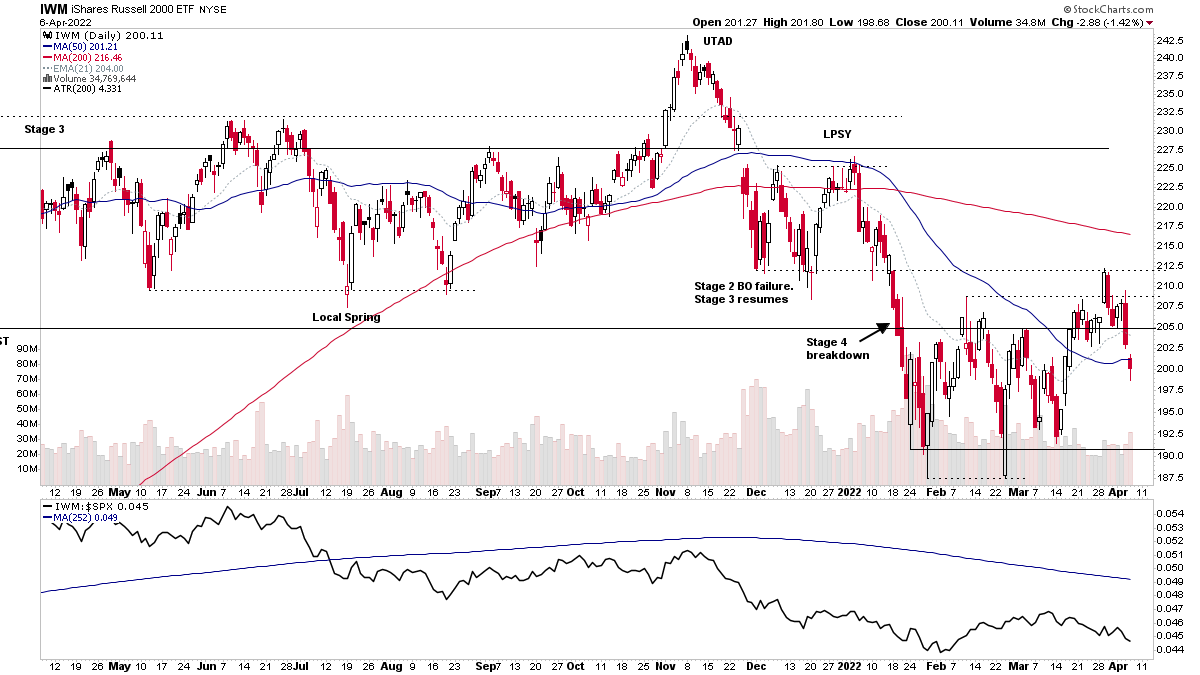
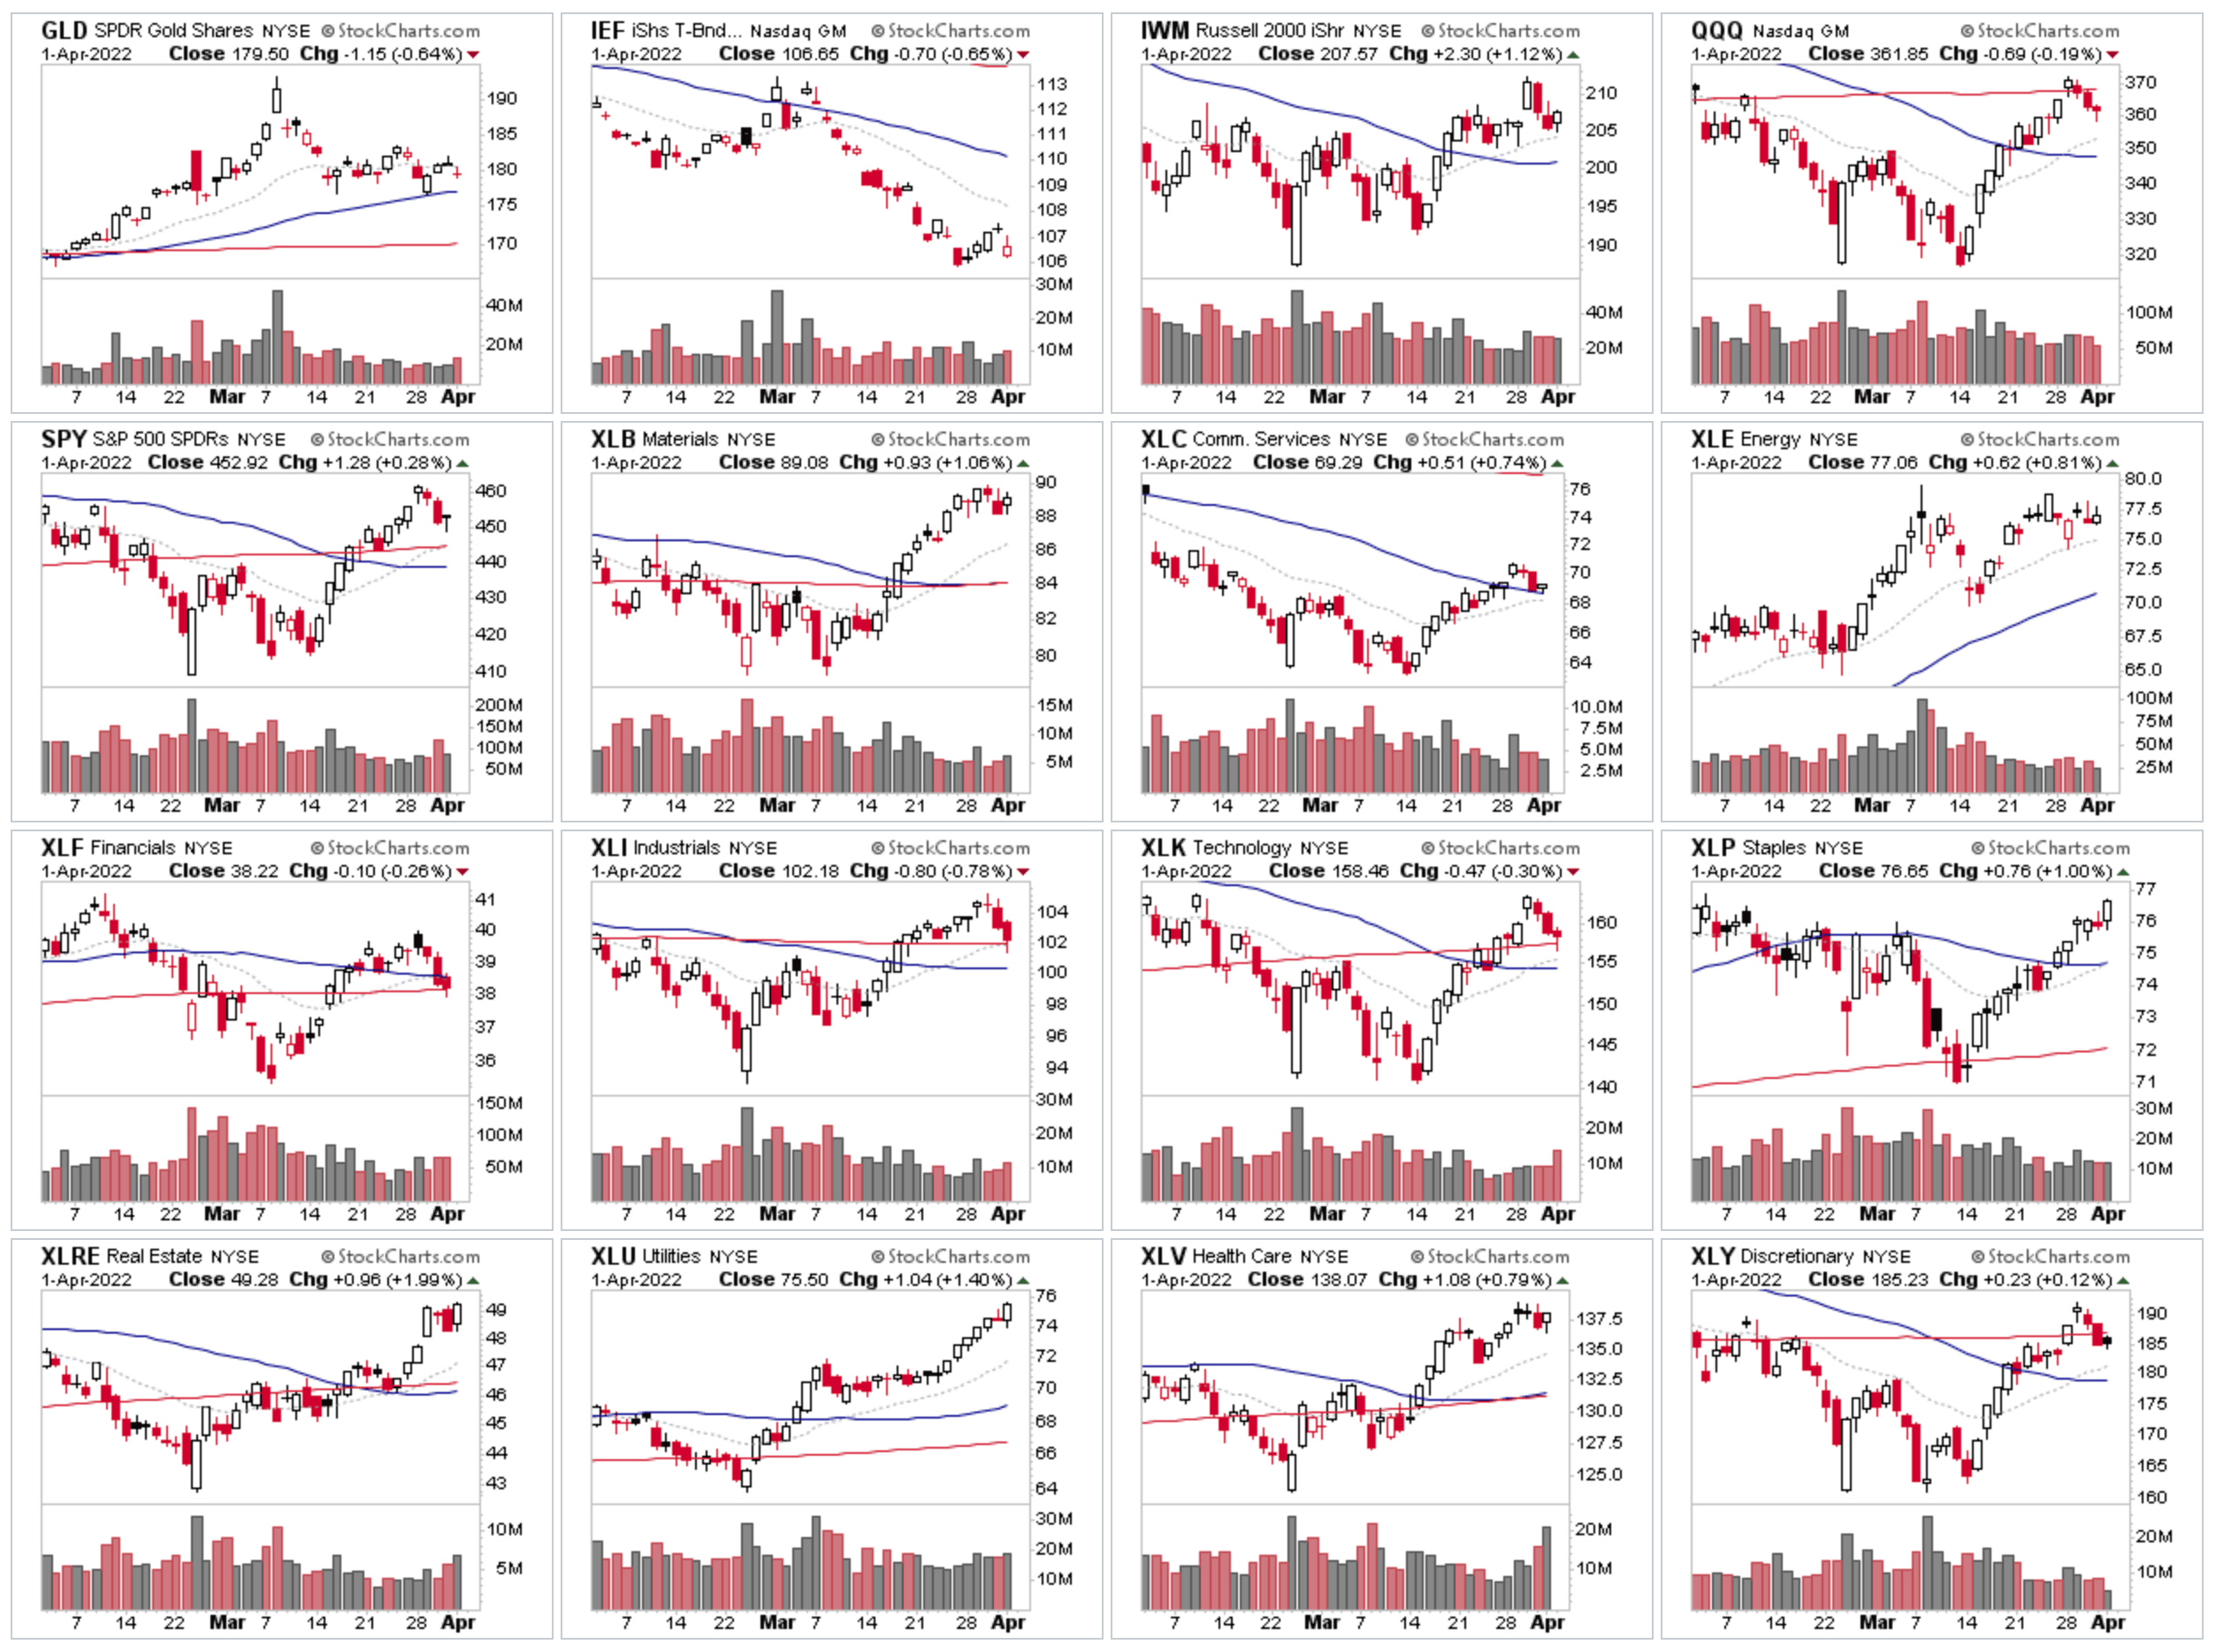
Stage Analysis Members Midweek Video - 6 April 2022
This weeks Members Midweek Video focuses on some of the recent areas of weakness, like the Semiconductors groups, plus brief reviews of some of other featured groups in the last few months – as well as the regular midweek features on the indexes, short term market breadth charts and the watchlist stocks in focus.
Read More
03 April, 2022
Stage Analysis Members Weekend Video - 3 April 2022 (1hr 24mins)
In this weekends members video I discuss the Stan Weinstein Interview on Twitter Spaces, as well as the regular content of the Major Indexes, Sectors Relative Strength Tables & Charts, Industry Group RS Tables and Themes, Market Breadth: Weight of Evidence, 2x Weekly Volume Stocks and the US Watchlist Stocks in detail.
Read More
31 March, 2022
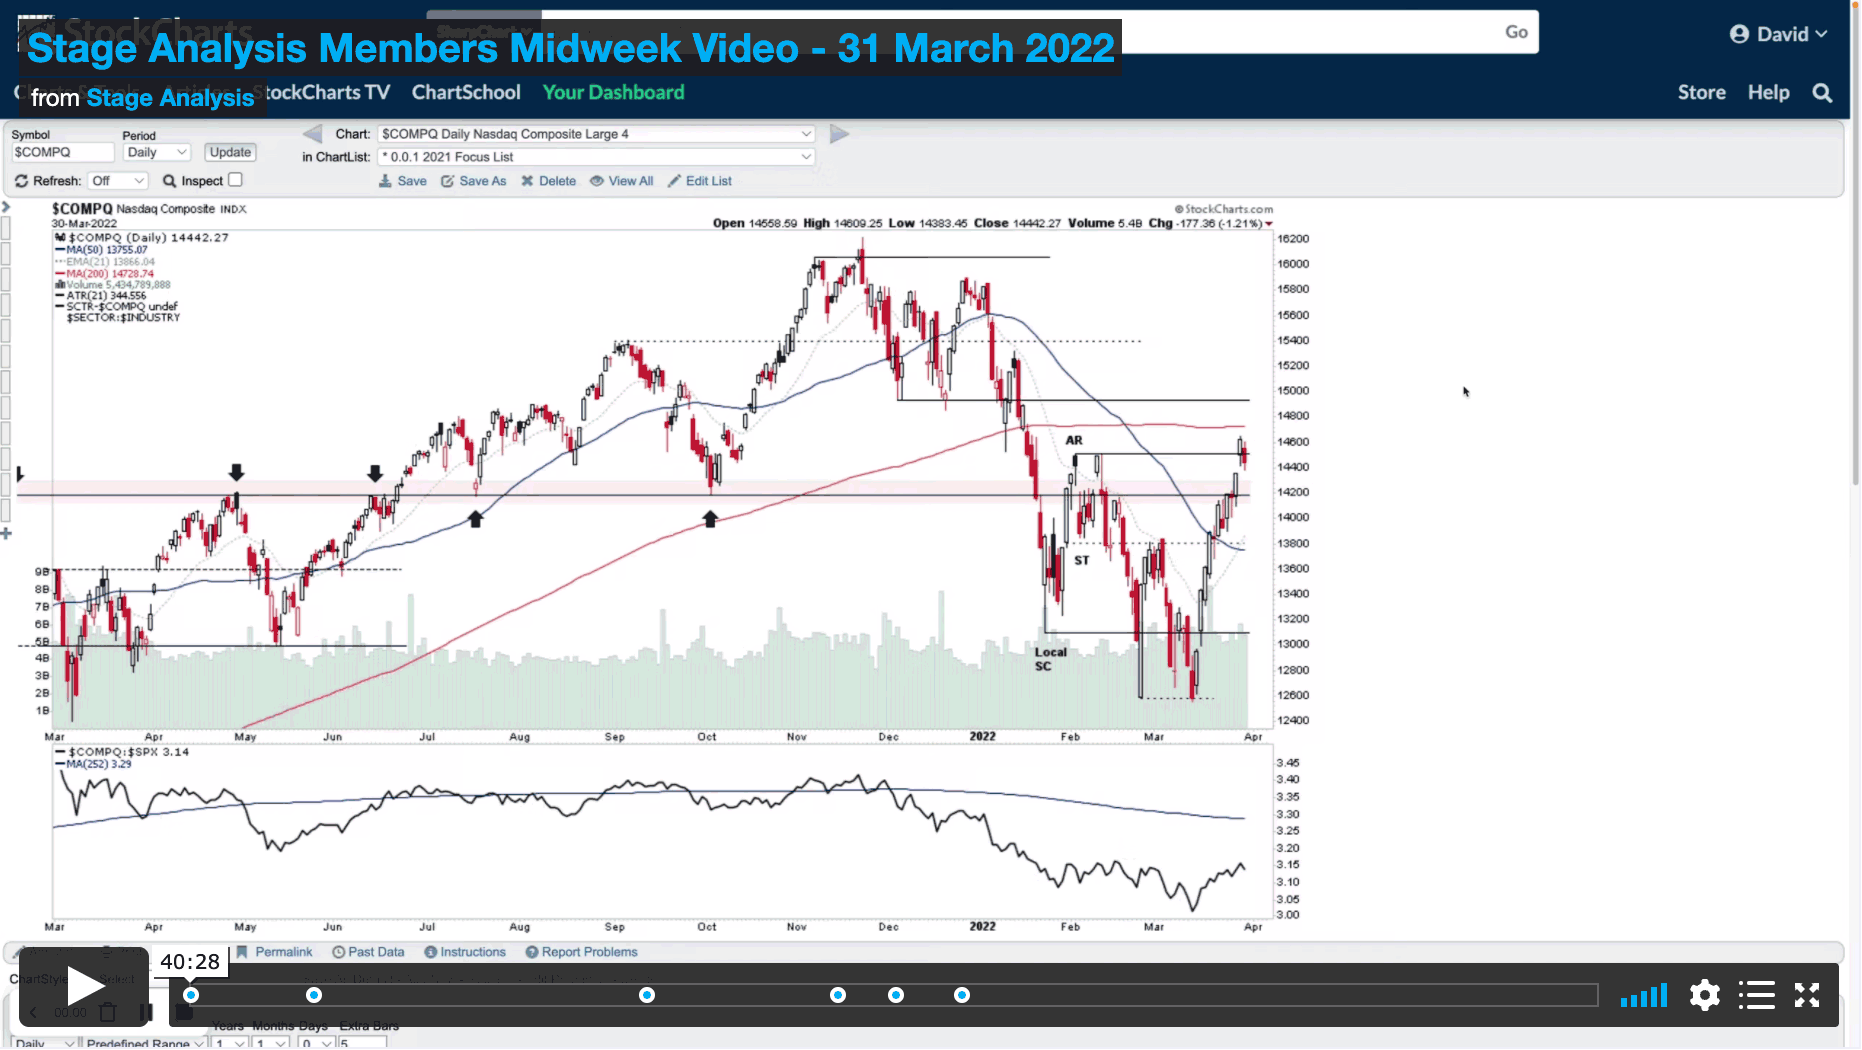
Stage Analysis Members Midweek Video - 31 March 2022 (40mins)
Todays video covers the Major Indexes, Short term market breadth, Bitcoin and Ethereum's Stage 2 attempt on the daily timeframe and the US Stocks Watchlist. I also spend the first 13 mins talking through how to use the watchlist based on the methods entry points and important cookie updates that break videos if they are not selected. So make sure that you accept them to be able to view the videos, as Vimeo videos only play once they are accepted.
Read More
27 March, 2022
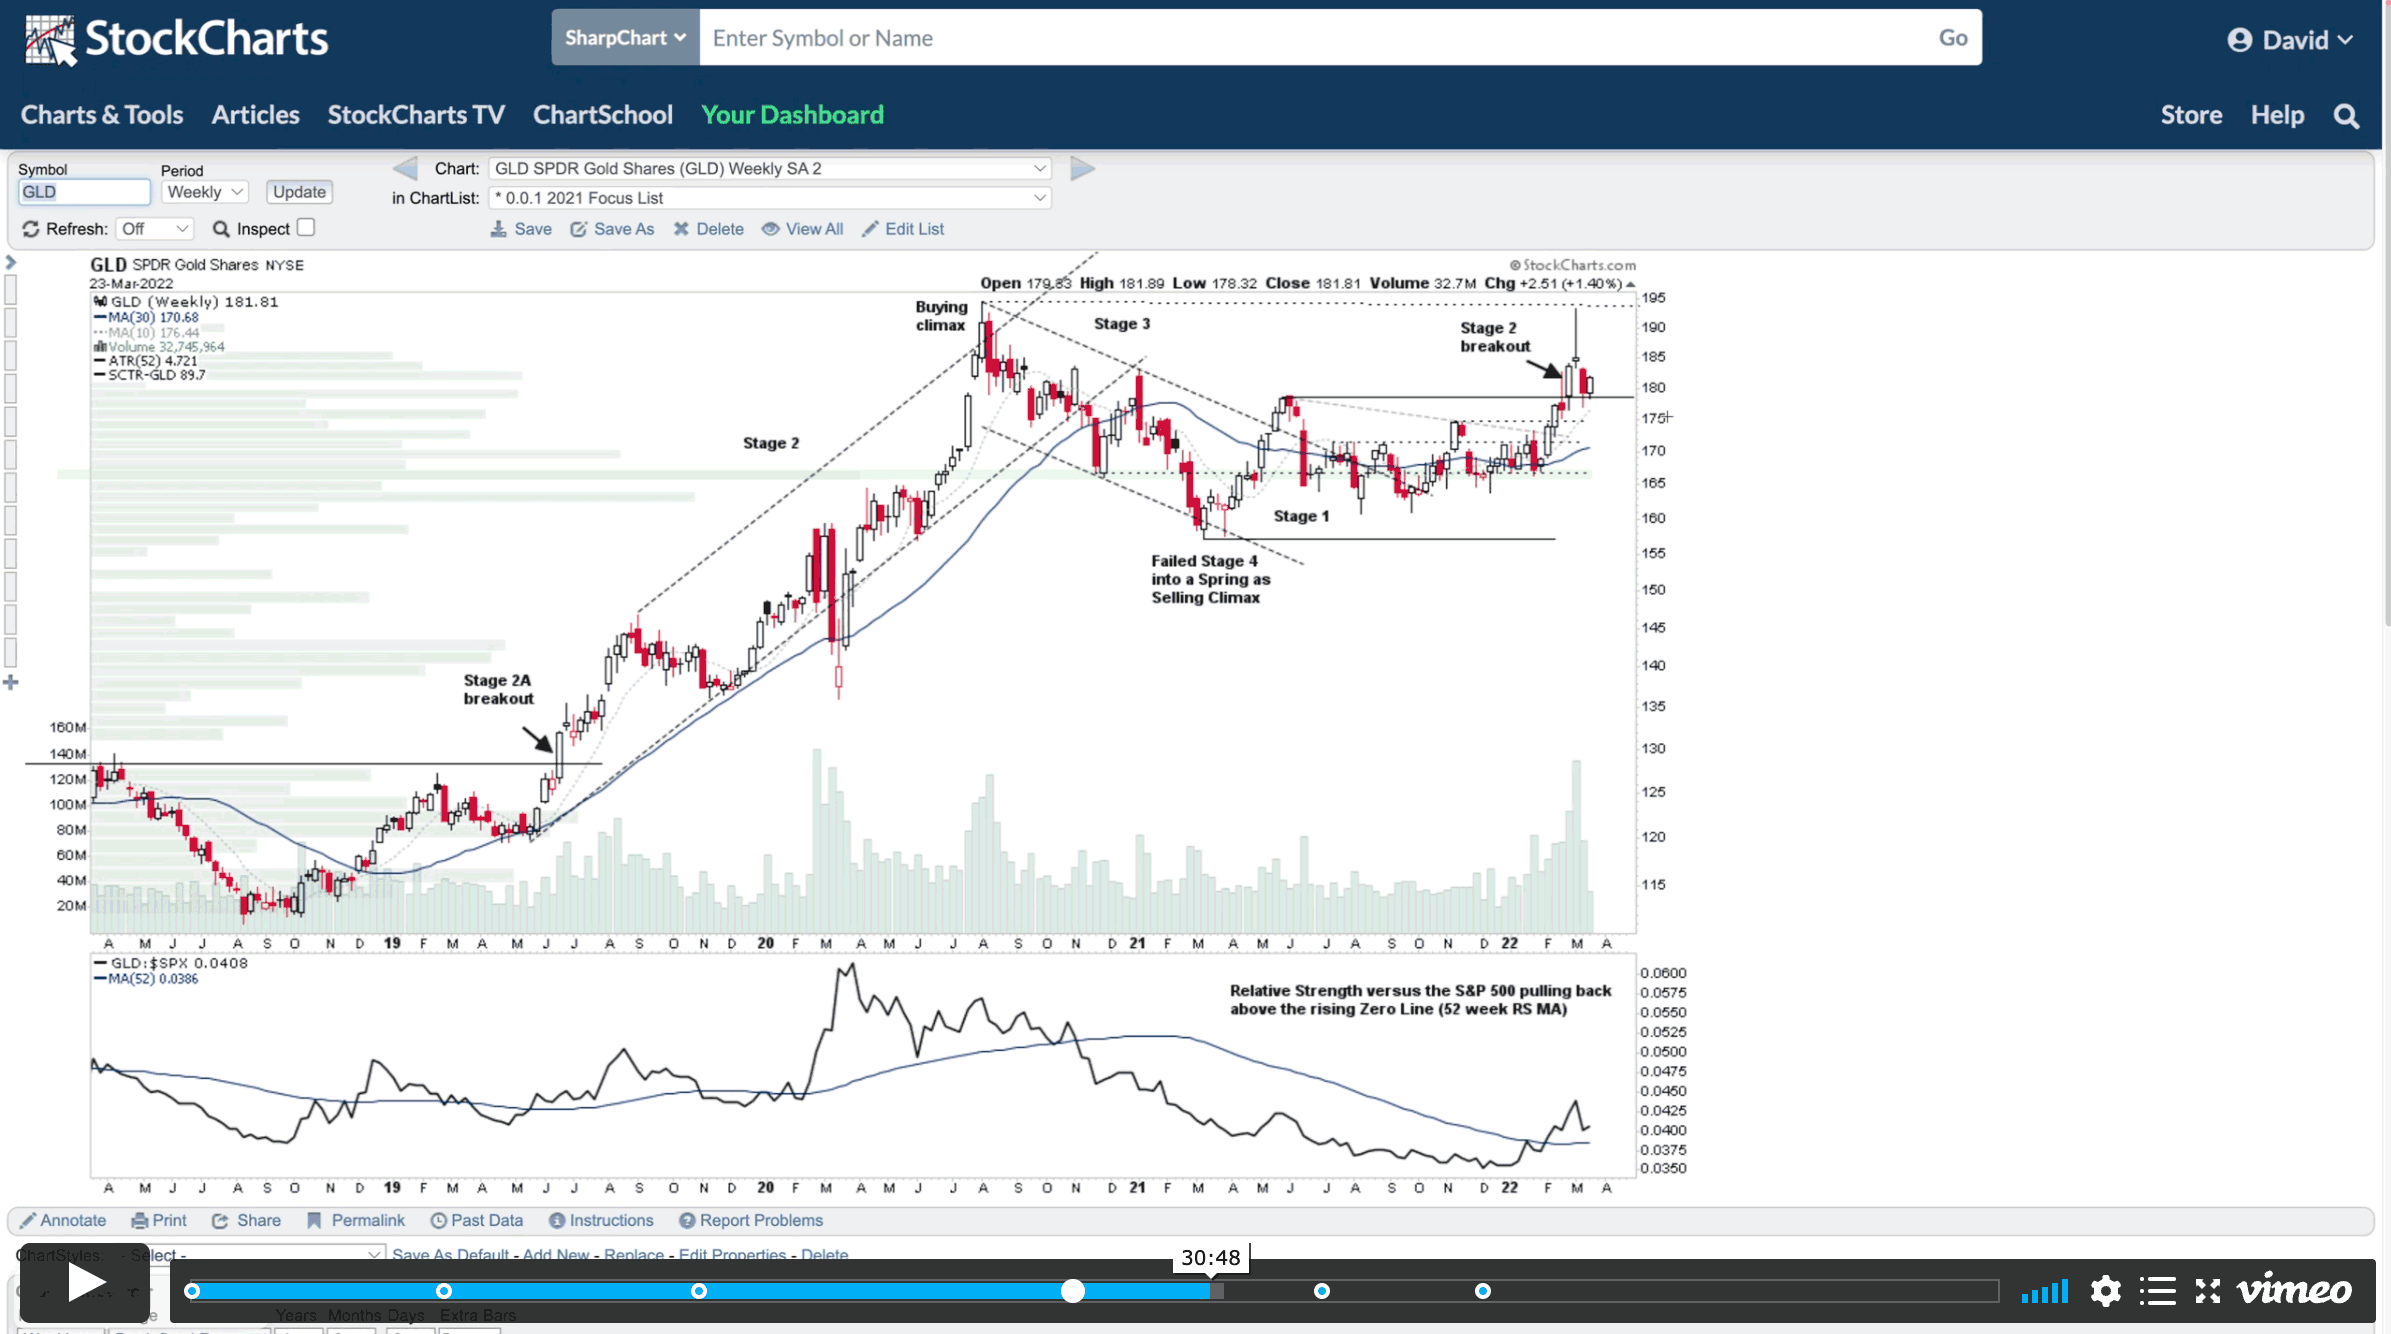
Stage Analysis Members Weekend Video – Part 2 – 27 March 2022 (1hr 3mins) – Gold and Silver Miners Feature
Part 2 of this weekends Stage Analysis Members Weekend video is free to view for the public and has a feature on the Gold and Silver miners that have been appearing in the watchlist over the last few months as they've developed from Stage 1 in Stage 2 in some cases. So I run through the strongest of the Gold and Silver miners and then in the second half of the video I cover this weeks Stage 2 Breakouts and Stage 2 Continuations and finish off with a look at the weekends US watchlist stocks in a but more detail.
Read More
26 March, 2022
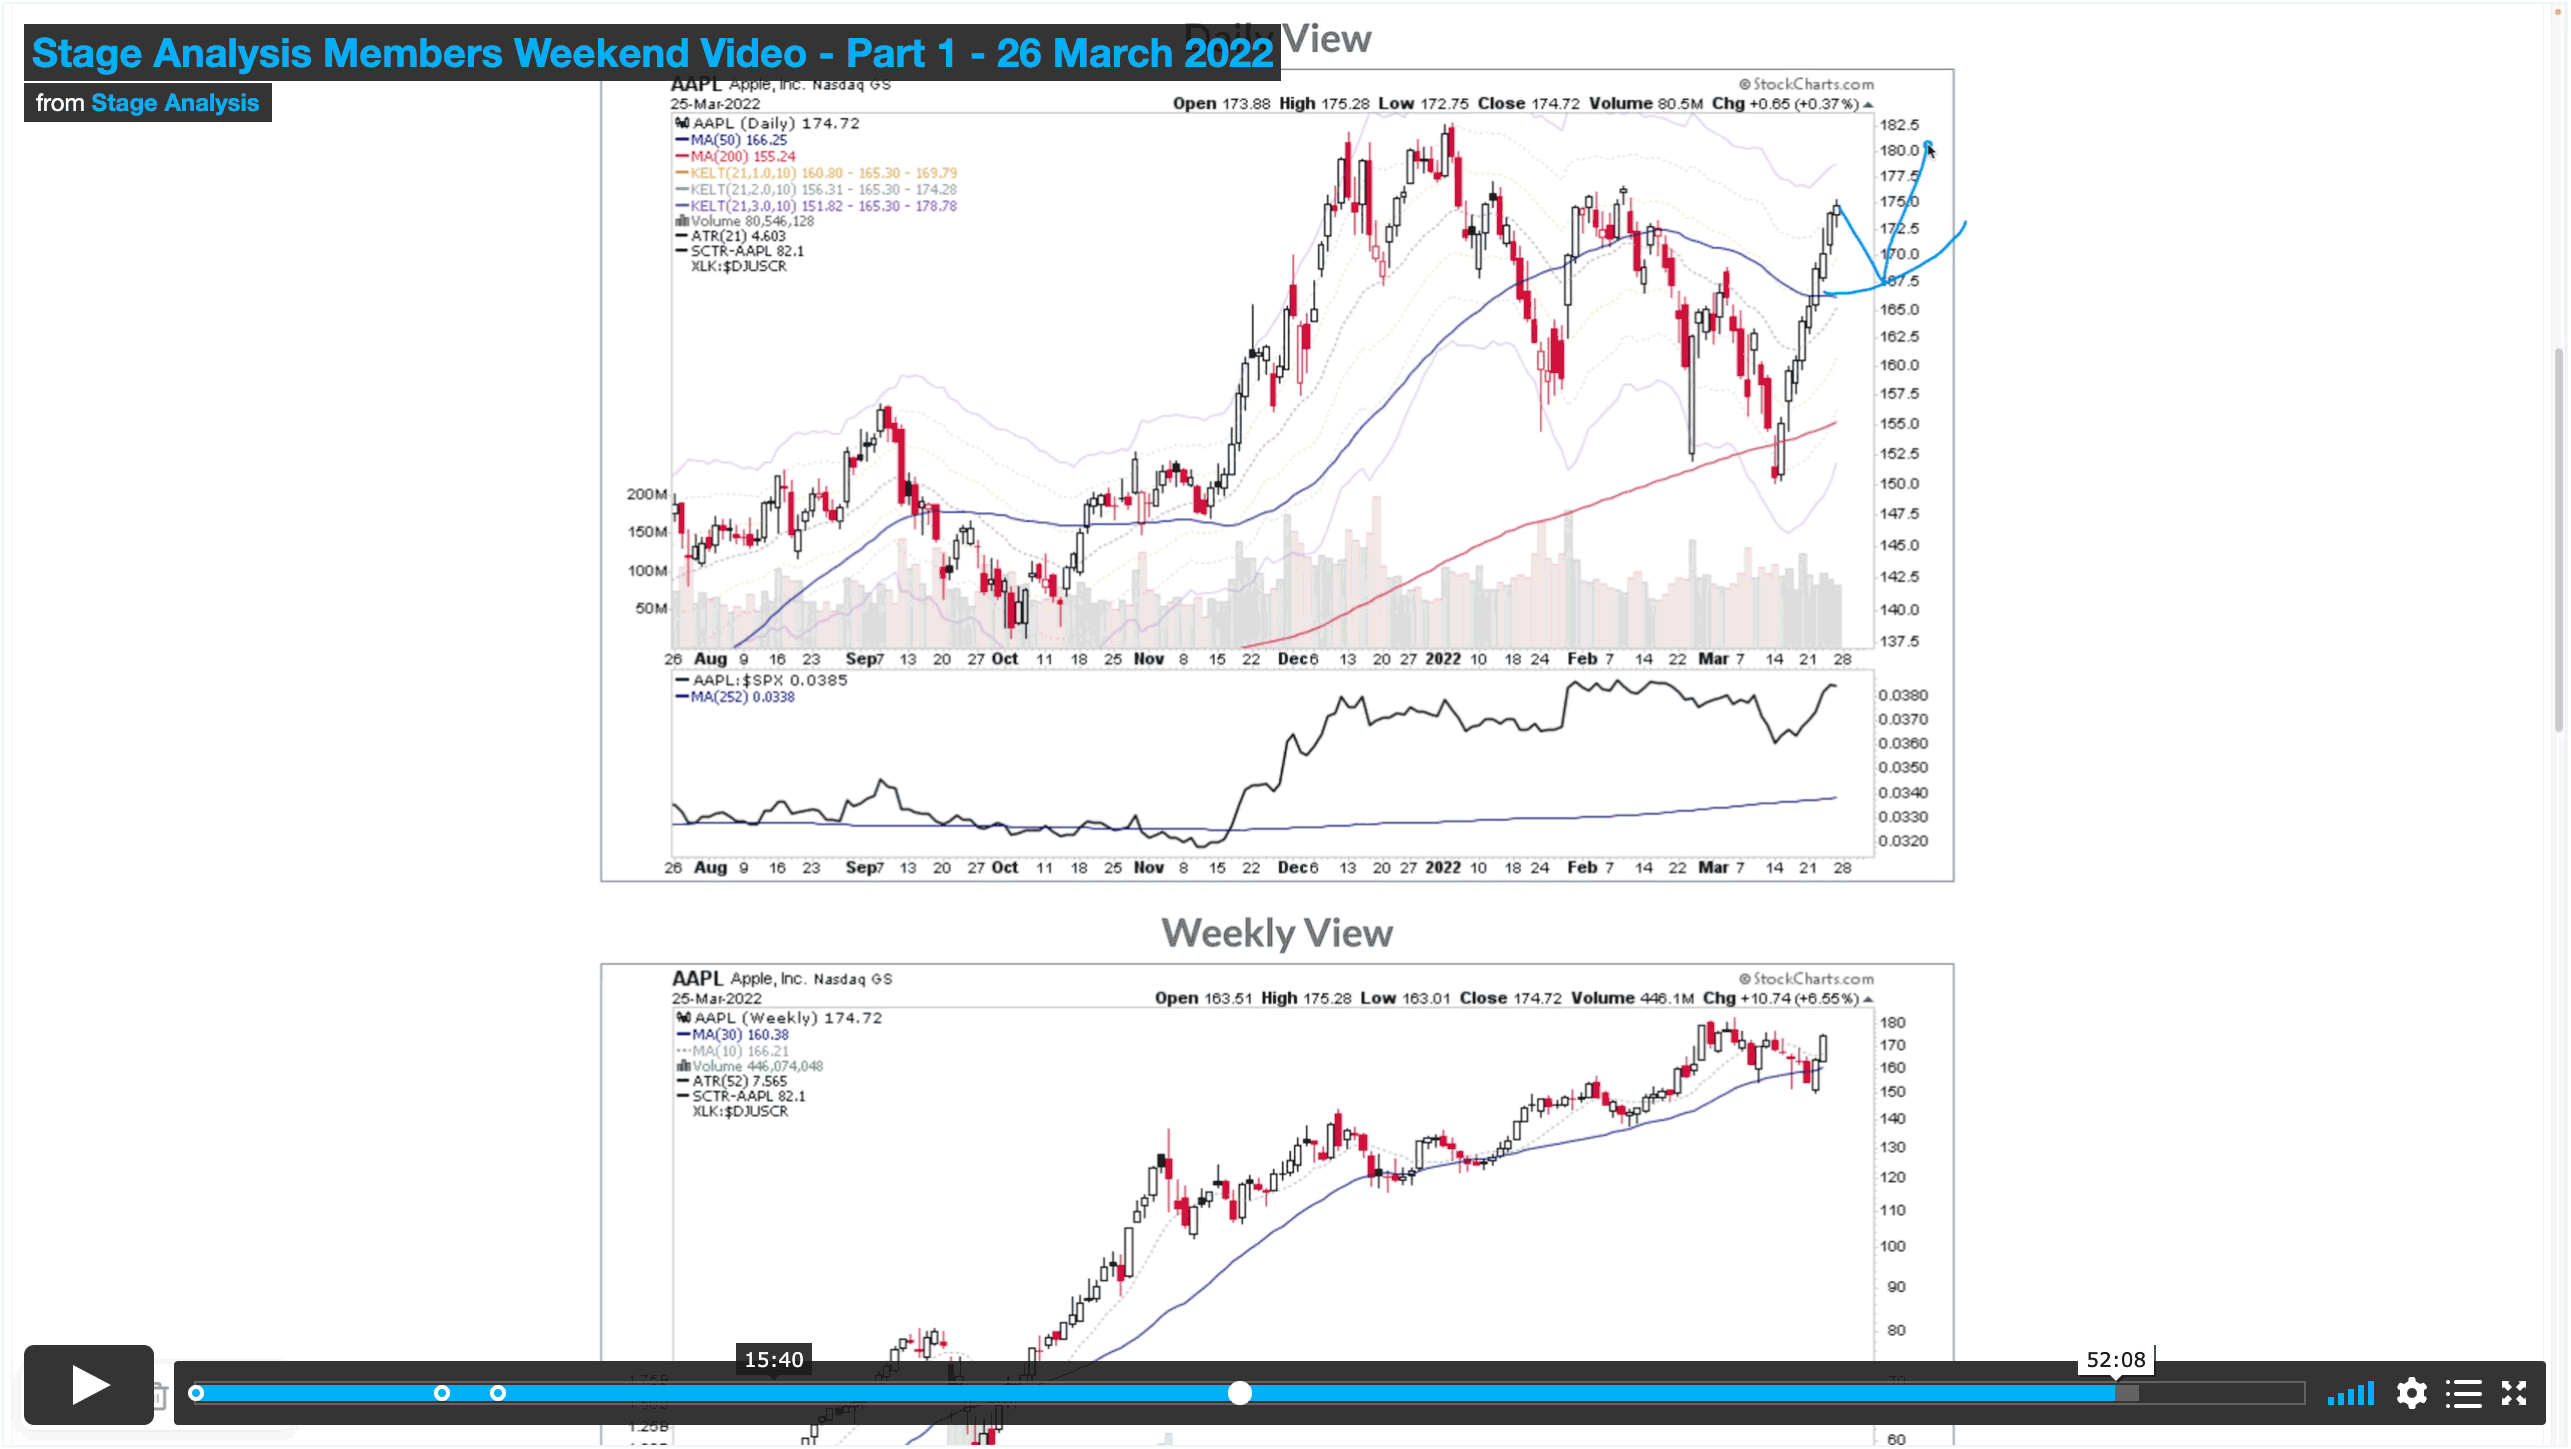
Stage Analysis Members Weekend Video – Part 1 – 26 March 2022 (57 mins)
In Part 1 of the Stage Analysis Members Video I cover the Major Indexes (i.e. S&P 500, Nasdaq Composite, Russell 2000 and the VIX etc), US Sectors Relative Strength Rankings and charts, Market Breadth charts to determine the Weight of Evidence, and the US Stocks Industry Group Relative Strength Tables and the Groups in focus this week.
Read More
24 March, 2022
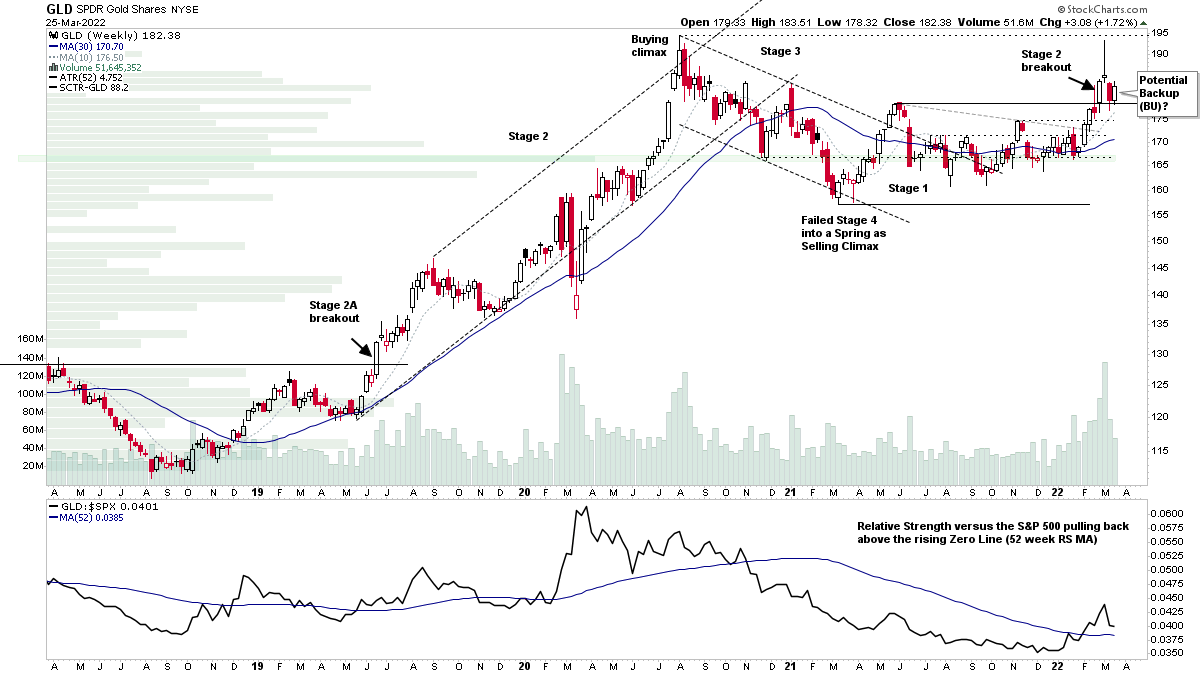
Stage Analysis Members Midweek Video - 23 March 2022 (54 mins)
Stage Analysis Members Midweek Video covering the Major Indexes, Short Term Market Breadth Indicators, the 104 Industry Groups Exclusive Bell Curve diagram, the potential Stage 2 Backup Entry Zone for Gold, the daily Stage 1 base structures in Bitcoin & Ethereum and the US Watchlist Stocks in more detail.
Read More

