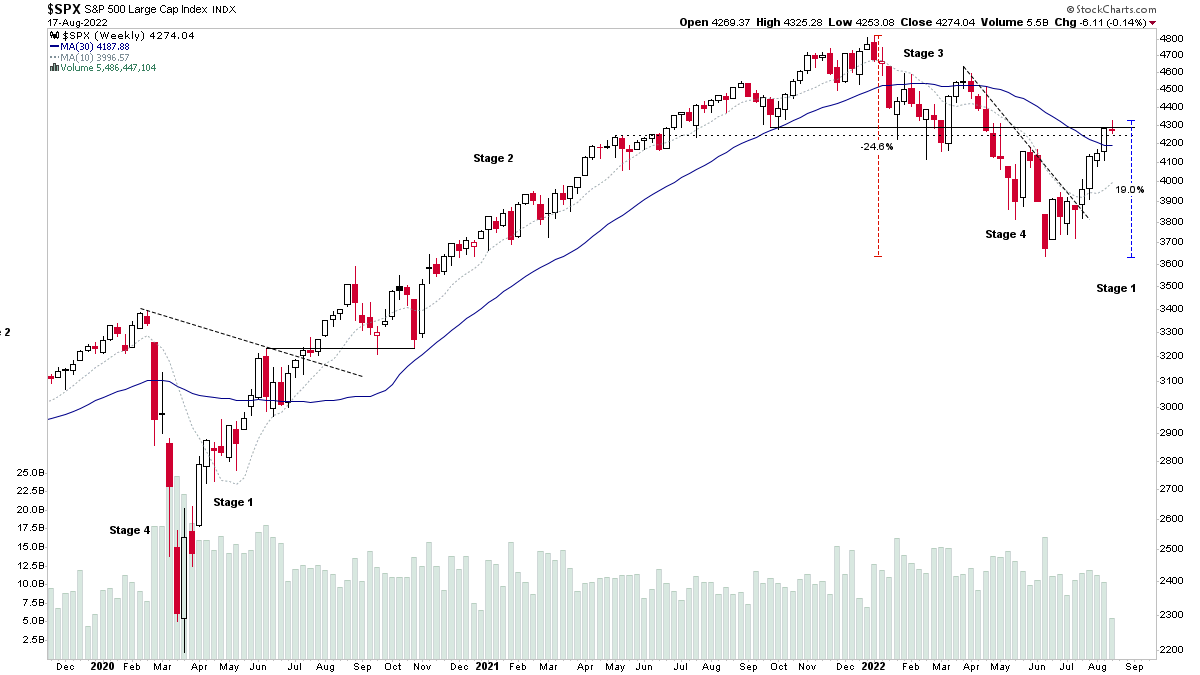
This weeks midweek video starts with a feature on the IBD Industry Group Bullish Percent Index, which I highlighted in the blog post on Tuesday. So I wanted to do a deeper discussion on the comparative periods from the chart to show the type of market behaviour that came next during each of the previous periods.
Read More

Blog
14 August, 2022
Stage Analysis Members Weekend Video – 14 August 2022 (1hr 32mins)
This weeks Stage Analysis Members weekend video begins with a detailed run through of the weekend watchlist stocks on multiple timeframes, with live markups of the charts and explanations of what we are looking for in each.
Read More
11 August, 2022
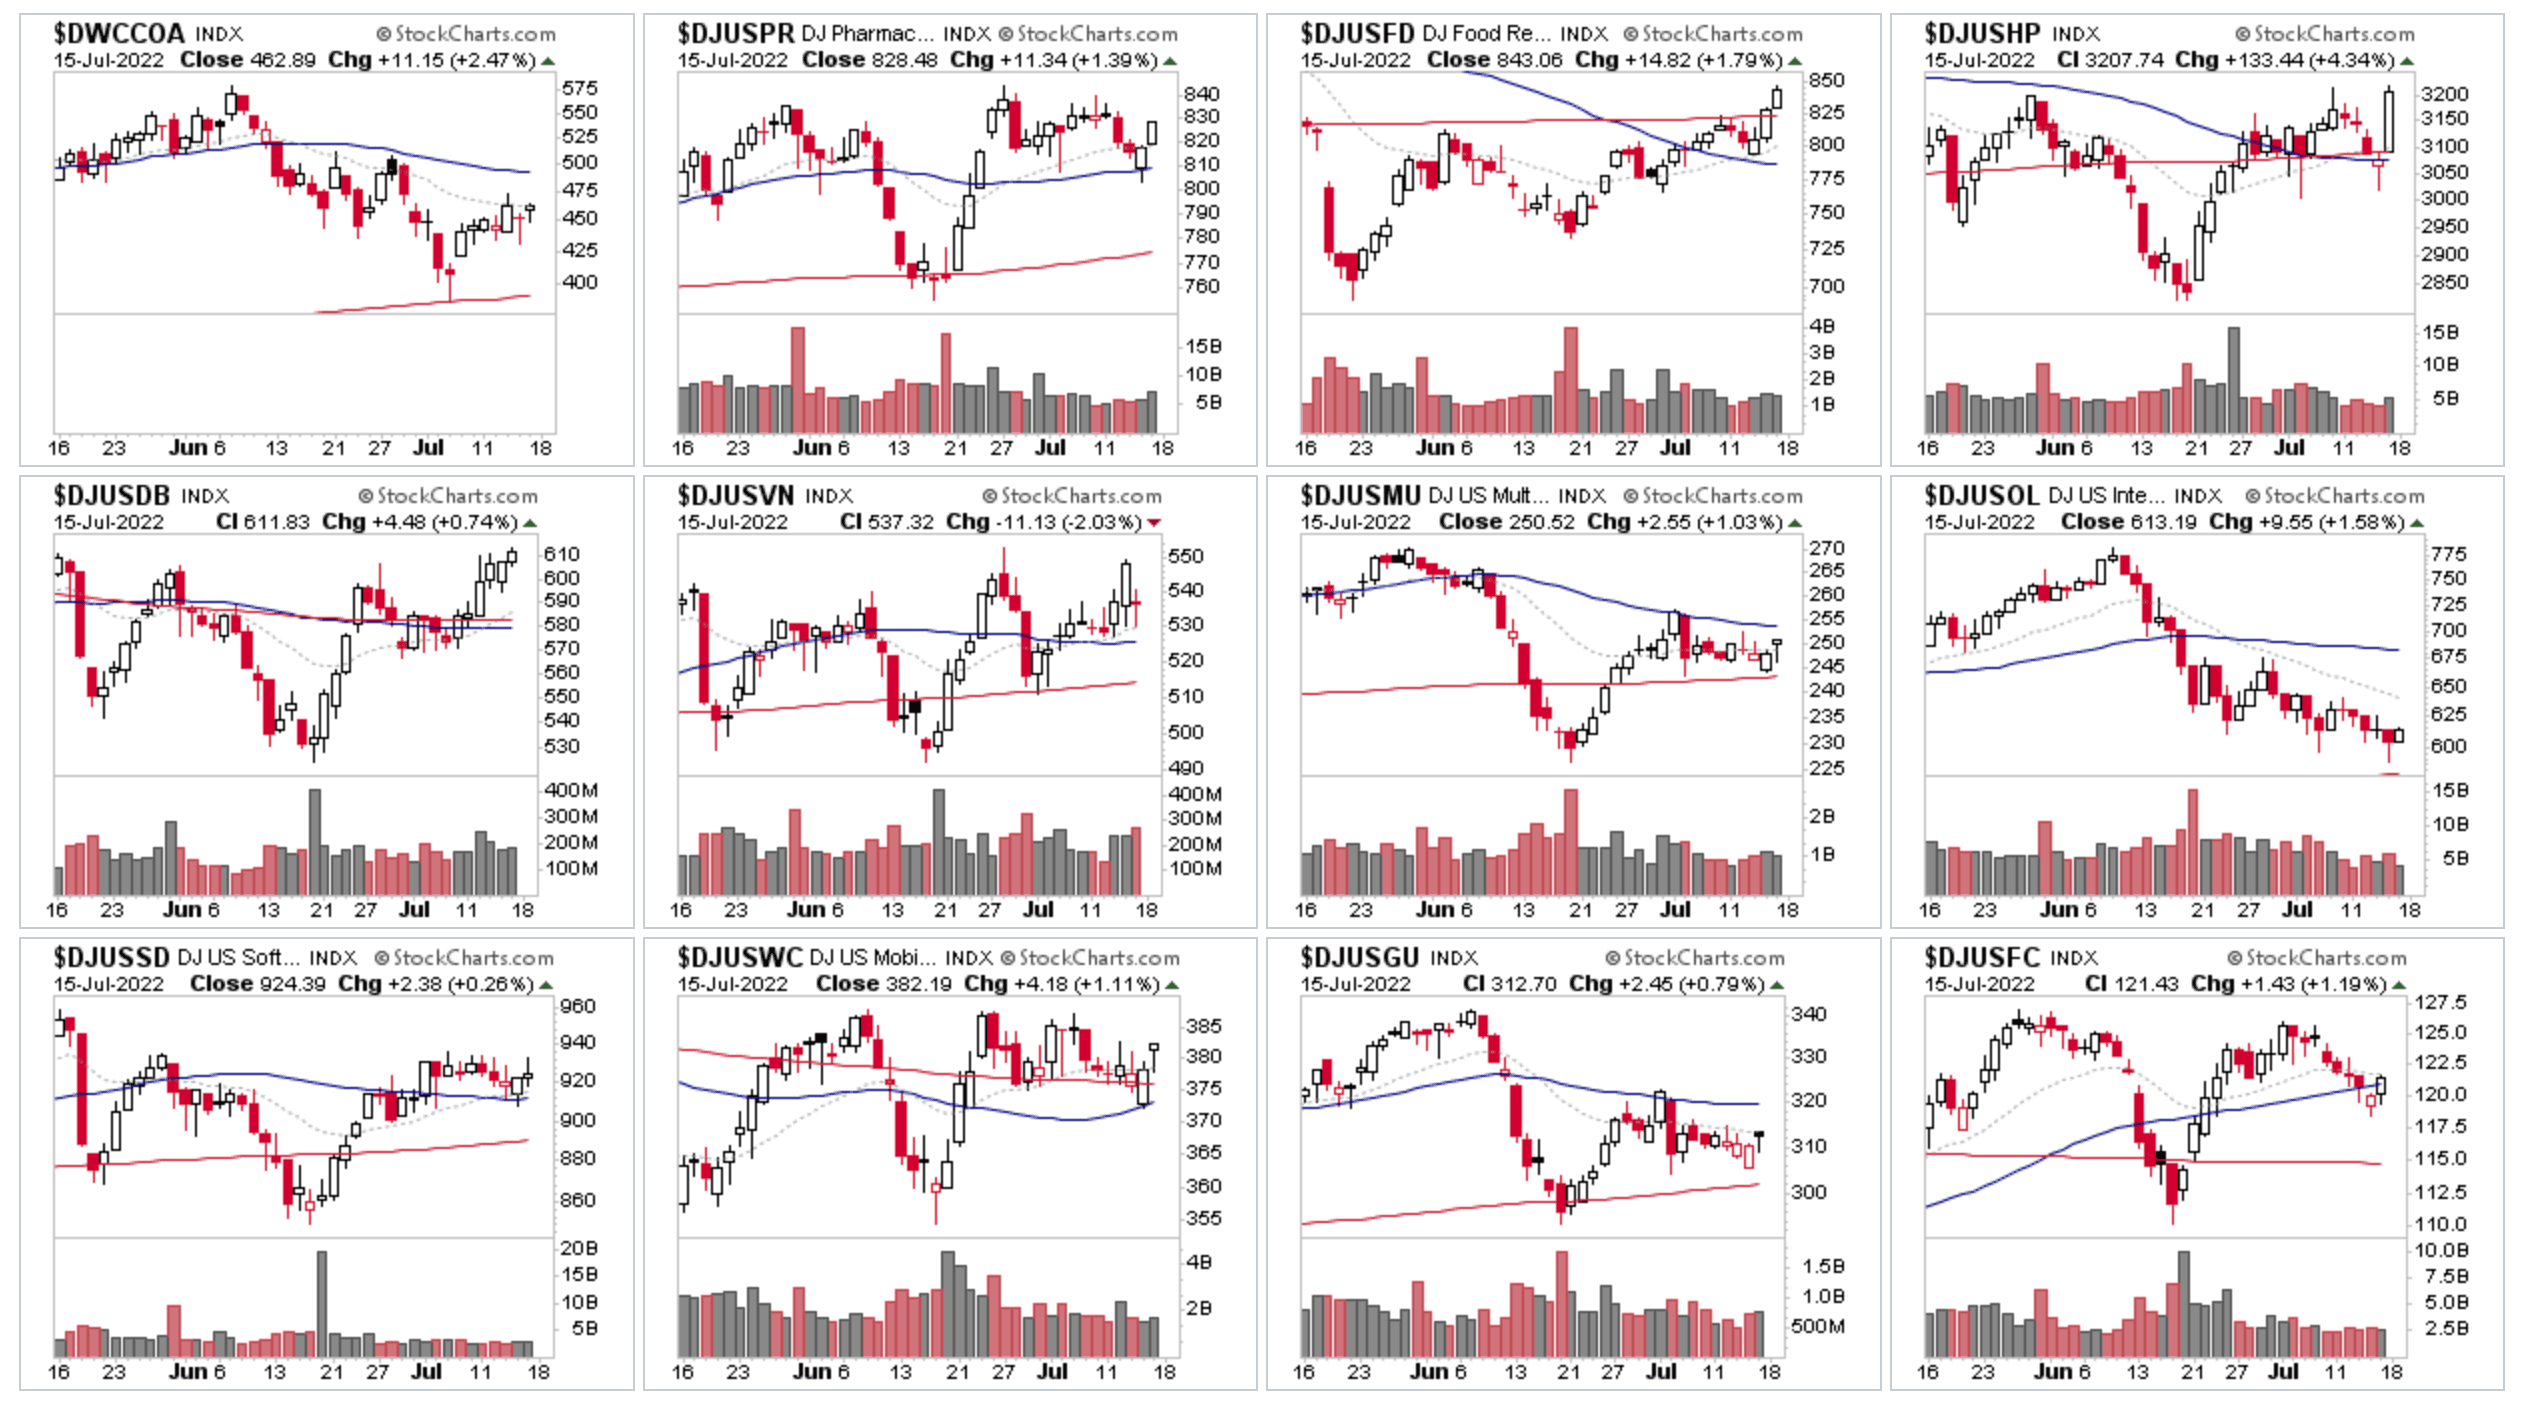
Video: Software Stocks Group Focus – Stage 1 Bases Proliferate – 10 August 2022 (1hr 7mins)
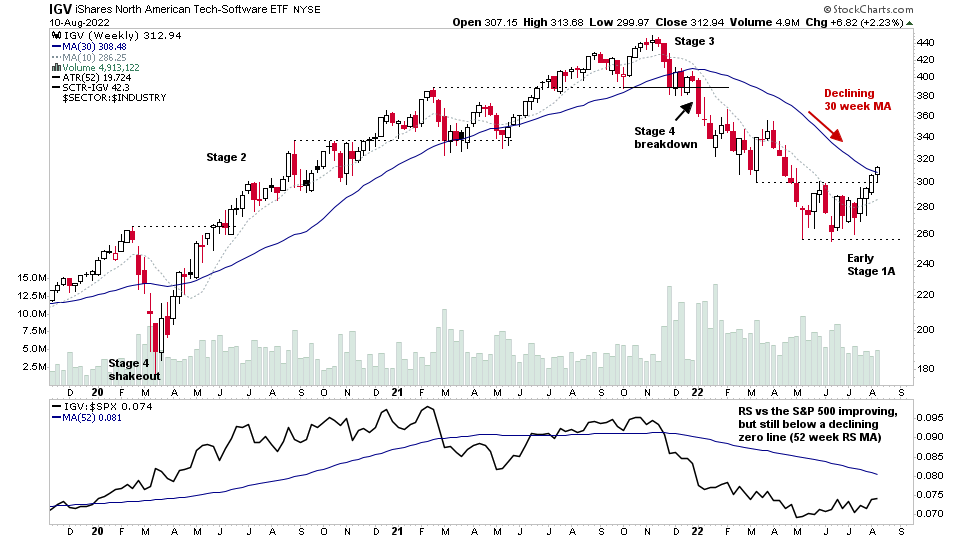
Todays Stage Analysis Members midweek video is a special feature on the Software group, which has been rising up the relative strength rankings over the last month, and has seen many stocks from the group appearing in the watchlist, due to the large number of stocks bases transitioning towards Stage 1, as well as a smaller number of stronger stocks in the group making the move into early Stage 2...
Read More
07 August, 2022
Stage Analysis Members Weekend Video – 7 August 2022 (1hr 30mins)
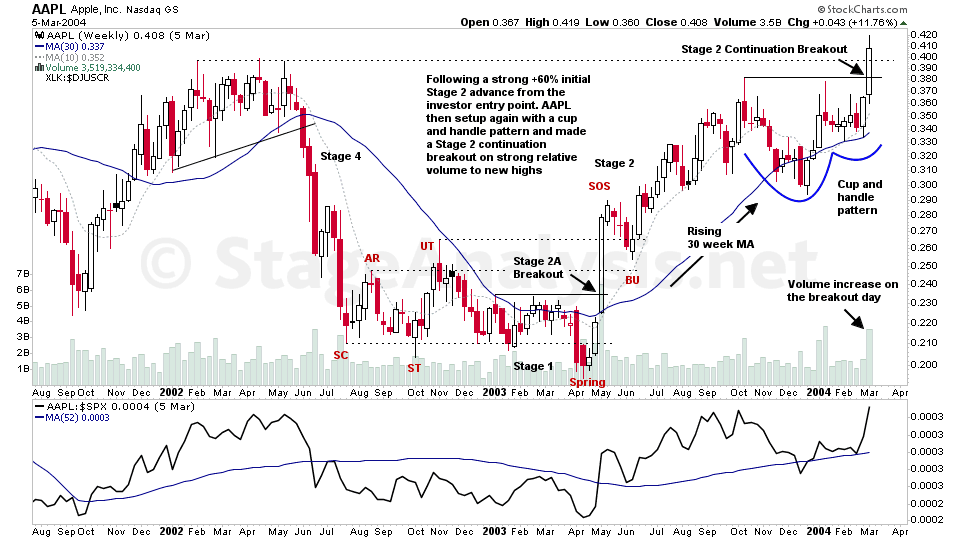
With the increased interest in Stan Weinstein's Stage Analysis method recently, I thought it would be useful to begin this weekends video with an educational feature on the Stage 2A entry point, using the example of AAPL from May 2003...
Read More
31 July, 2022
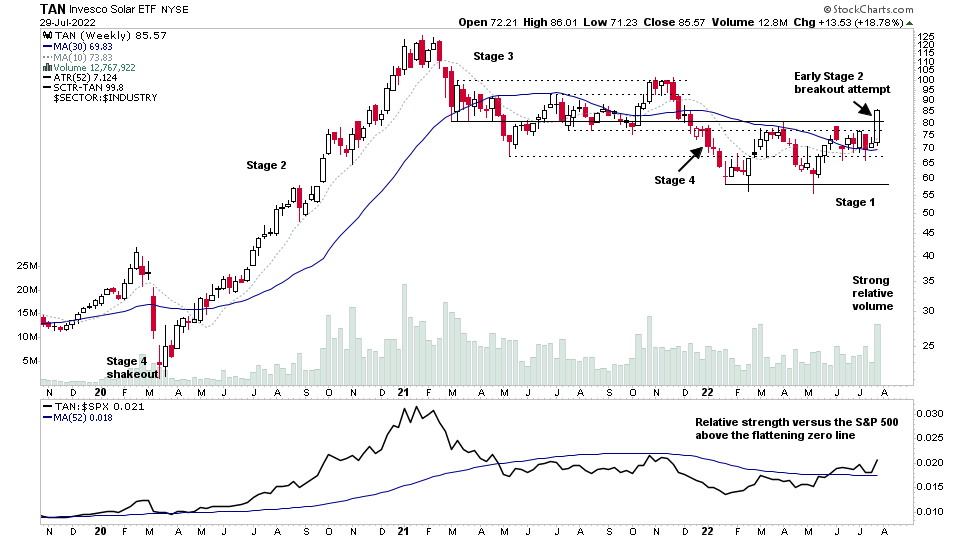
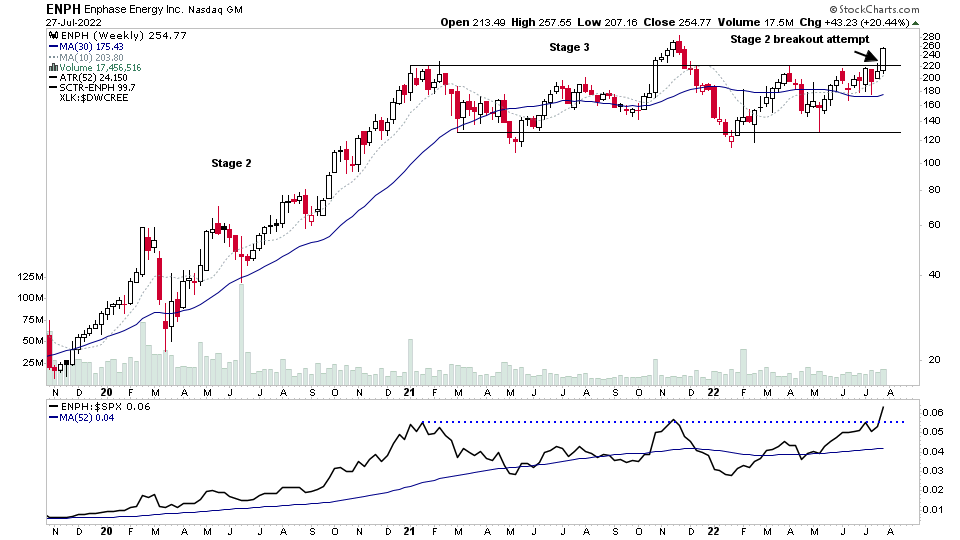
Stage Analysis Members Weekend Video – 31 July 2022 (1hr 36mins)
The Stage Analysis members weekend video begins with a focus on the Solar Group following this weeks climate spending deal, plus earnings results in multiple stocks in the group which caused a Stage 2 breakout attempt in the group on strong relative volume...
Read More
28 July, 2022
Stage Analysis Members Midweek Video – 27 July 2022 (1hr)
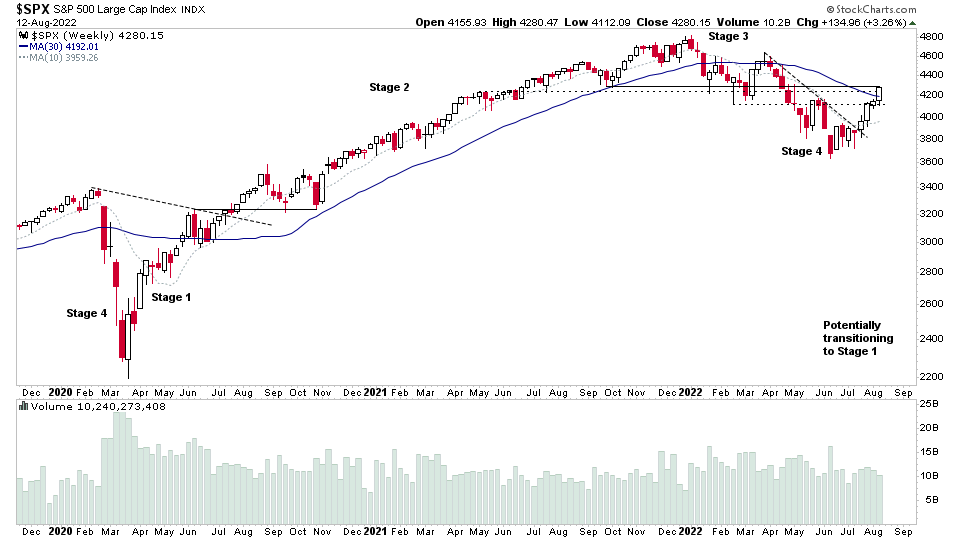
This weeks Stage Analysis Members midweek video starts with a review of the price and volume action in the major indexes, and some short term Market breadth indicators, such as the Nasdaq Composite Bullish Percent Index, which had a Bull Confirmed P&F status change today and the Percentage of Stocks above their 20 day EMAs.
Read More
24 July, 2022
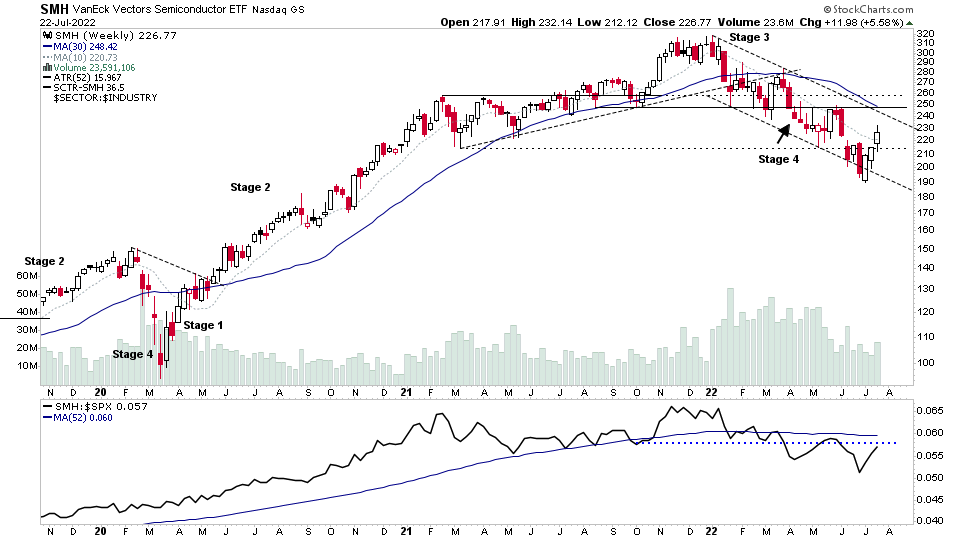
Stage Analysis Members Weekend Video – 24 July 2022 (1hr 17mins)
The Stage Analysis members weekend video starts this week with a focus on the Semiconductors group, as around 1/4 of the group are reporting earnings in the coming week, and have shown strong relative strength since the start of the month, rising back up the relative strength rankings and and industry group bell curve.
Read More
20 July, 2022
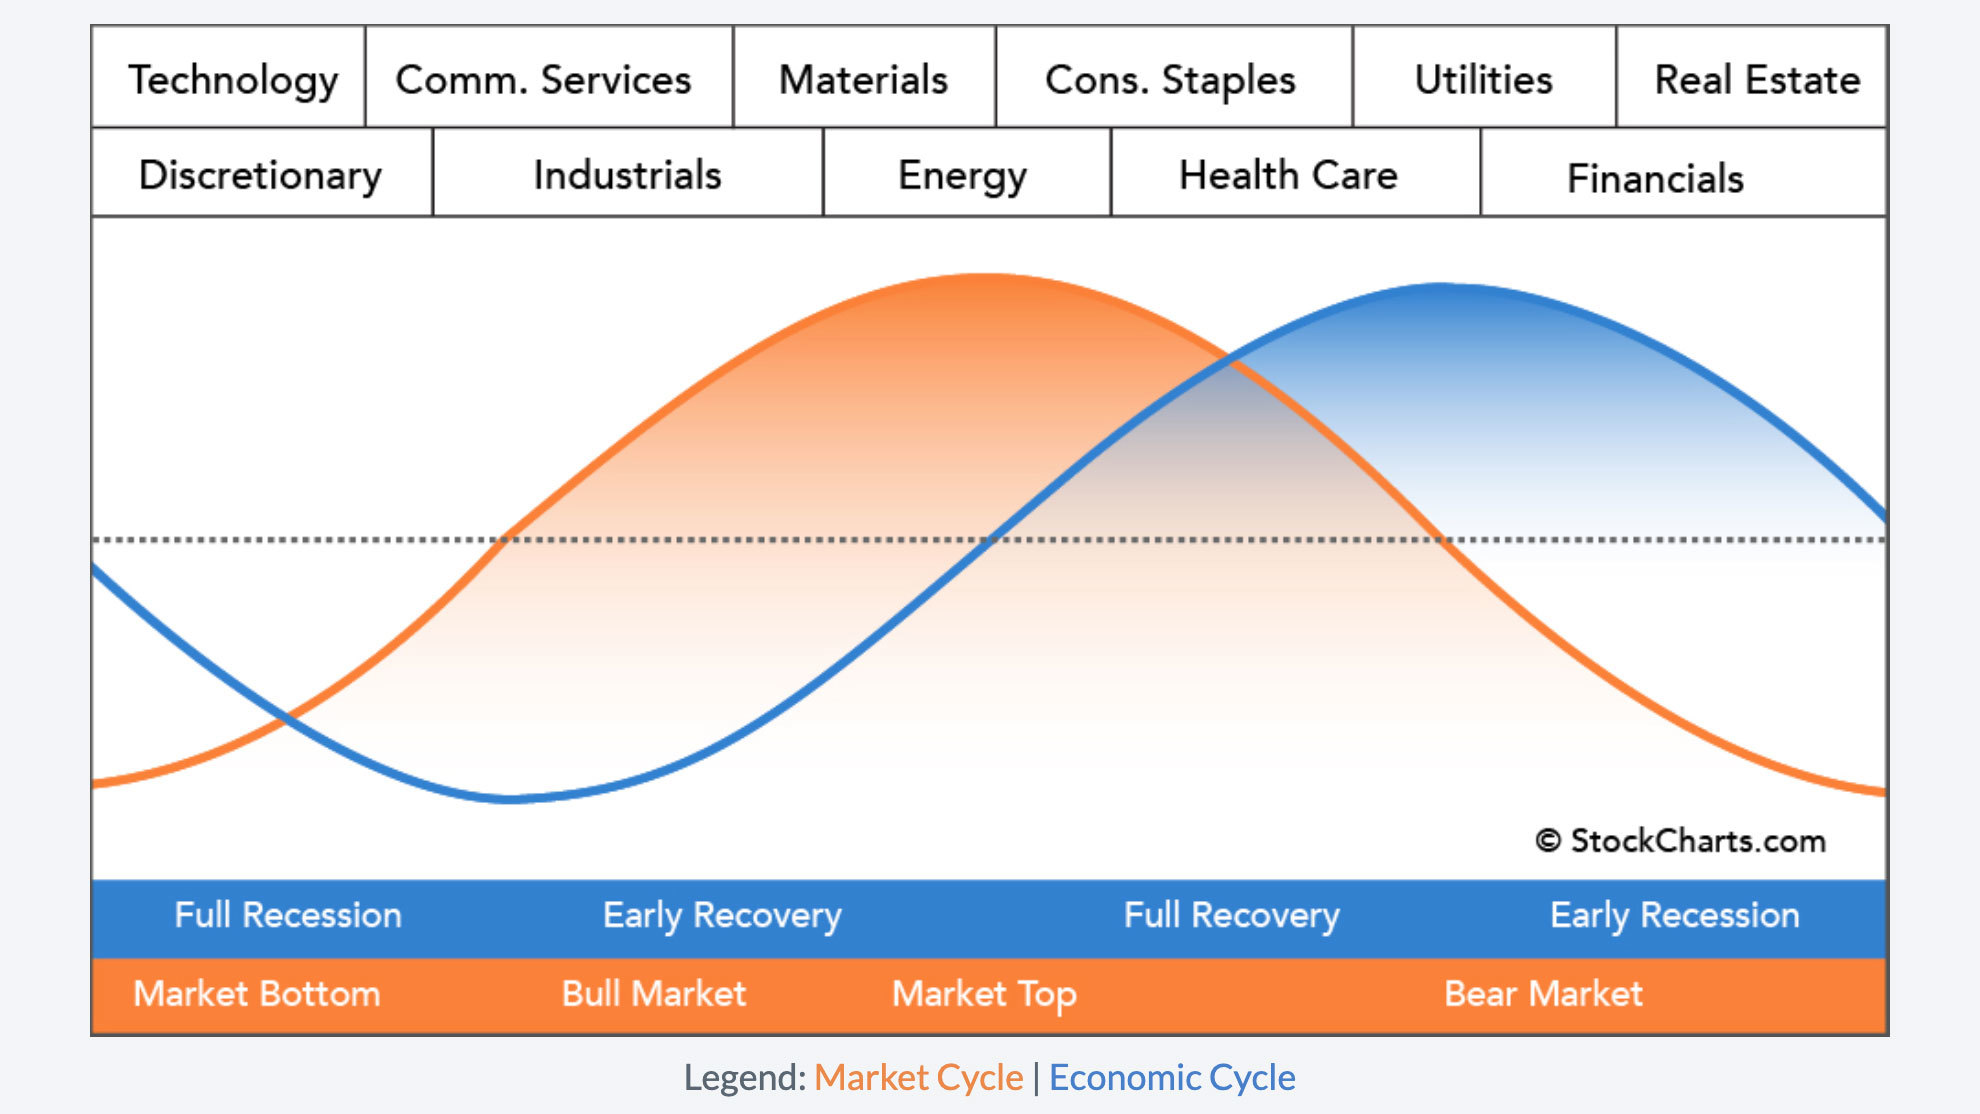
Stage Analysis Members Midweek Video – 20 July 2022 (1hr 22mins)
Tonights Stage Analysis Members midweek video begins with a look at the Sector Rotation Model that suggests the sectors that tend to lead the market at the different points in the market cycle and economic cycle. Followed by a brief chat of the recent article on the Top 5 Books To Learn the Wyckoff Method, before discussing the Major Index charts...
Read More
17 July, 2022
Stage Analysis Members Weekend Video – 17 July 2022 (1hr 30mins)
The Stage Analysis Members weekend video starts with a look at US Stocks Industry Groups Relative Strength Rankings and some of the groups on the move and stocks from those groups. Then in the members only content first a review of the Major Indexes – S&P 500, Nasdaq, Russell 2000 as well as chart analysis of Oil, Copper, Treasuries, Gold and the VIX...
Read More
14 July, 2022
Stage Analysis Members Midweek Video – 13 July 2022 (1hr 5mins)
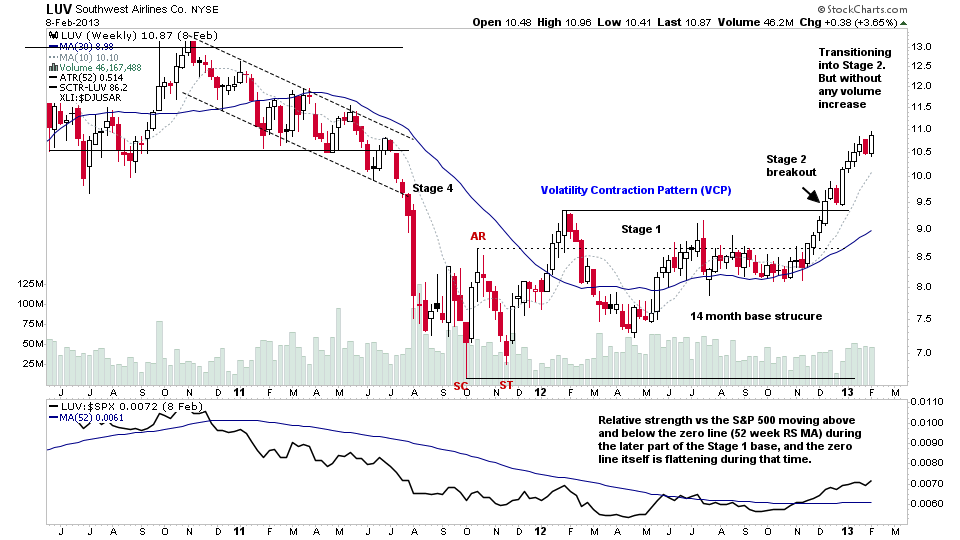
The Stage Analysis members midweek video begins this week with a further discussion on How Stocks Transition From the Stage 4 Declining Phase to the Stage 1 Basing Phase using an early Stage 1 example from the Global Trend Alert to help to explain some of the characteristics to look for...
Read More