The Stage Analysis members weekend video begins with discussion of the the US Watchlist Stocks in detail on multiple timeframes, Stages Summary, Relative Strength Rankings, the Sector breadth and Sub-industries Bell Curves, the key Market Breadth Charts to determine the Weight of Evidence, Bitcoin & Ethereum and the Major US Stock Market Indexes Update.
Read More

Blog
13 April, 2025
Stage Analysis Members Video – 13 April 2025 (1hr 5mins)
06 April, 2025
Stage Analysis Members Video – 6 April 2025 (26 mins)
The Stage Analysis members weekend video reviewing the major US indexes and mega cap stocks as well the usual regular features to help to determine the Weight of Evidence.
Read More
30 March, 2025
Stage Analysis Members Video – 30 March 2025 (43mins)
The Stage Analysis members weekend video this week reviews the Stages of the major mega cap stocks and some of the leaders of the current cycle – PLTR, APP, CVNA etc, as well the usual regular features to help to determine the Weight of Evidence.
Read More
22 March, 2025
Stage Analysis Members Video – 22 March 2025 (1hr)
The Stage Analysis members weekend video begins with discussion of the the US Watchlist Stocks in detail on multiple timeframes, Stages Summary, Relative Strength Rankings, the Sector breadth and Sub-industries Bell Curves, the key Market Breadth Charts to determine the Weight of Evidence, Bitcoin & Ethereum and the Major US Stock Market Indexes Update.
Read More
16 March, 2025
Stage Analysis Members Video – 16 March 2025 (58mins)
The Stage Analysis members weekend video begins with discussion of the the US Watchlist Stocks in detail on multiple timeframes, Stages Summary, Relative Strength Rankings, the Sector breadth and Sub-industries Bell Curves, the key Market Breadth Charts to determine the Weight of Evidence, Bitcoin & Ethereum and the Major US Stock Market Indexes Update.
Read More
14 March, 2025
Video: New Feature: Full Screen Mode on Stock Charts - 14 March 2025 (3mins)
The individual stock charts now have the option to go into full screen mode on desktop and mobile. Making it easier to see the charts on small screens, and also giving you the option to scroll back through the stocks history* on the chart, and change the scaling of the chart.
Read More
11 March, 2025
New Feature: Organise Screener Table Columns – 10 March 2025
Usability improvement for the Stage Analysis Screener with tabs added under filter to organise the large amount of table columns into sections...
Read More
09 March, 2025
Stage Analysis Members Video – 9 March 2025 (44mins)
The Stage Analysis members weekend video begins with discussion of the the US Watchlist Stocks in detail on multiple timeframes, Stages Summary, Relative Strength Rankings, the Sector breadth and Sub-industries Bell Curves, the key Market Breadth Charts to determine the Weight of Evidence, Bitcoin & Ethereum and the Major US Stock Market Indexes Update.
Read More
07 March, 2025
Video: New Features: Stages Column on Chartlists & ETF Summary – 7 March 2025 (5mins)
The Stages column in the tables has been added to the Chartlists and ETF Summary pages, as well as a new button on the Chartlists pages to quickly jump to the Stage Analysis Screener so that you can view the full data available for each stock in one click.
Read More
03 March, 2025
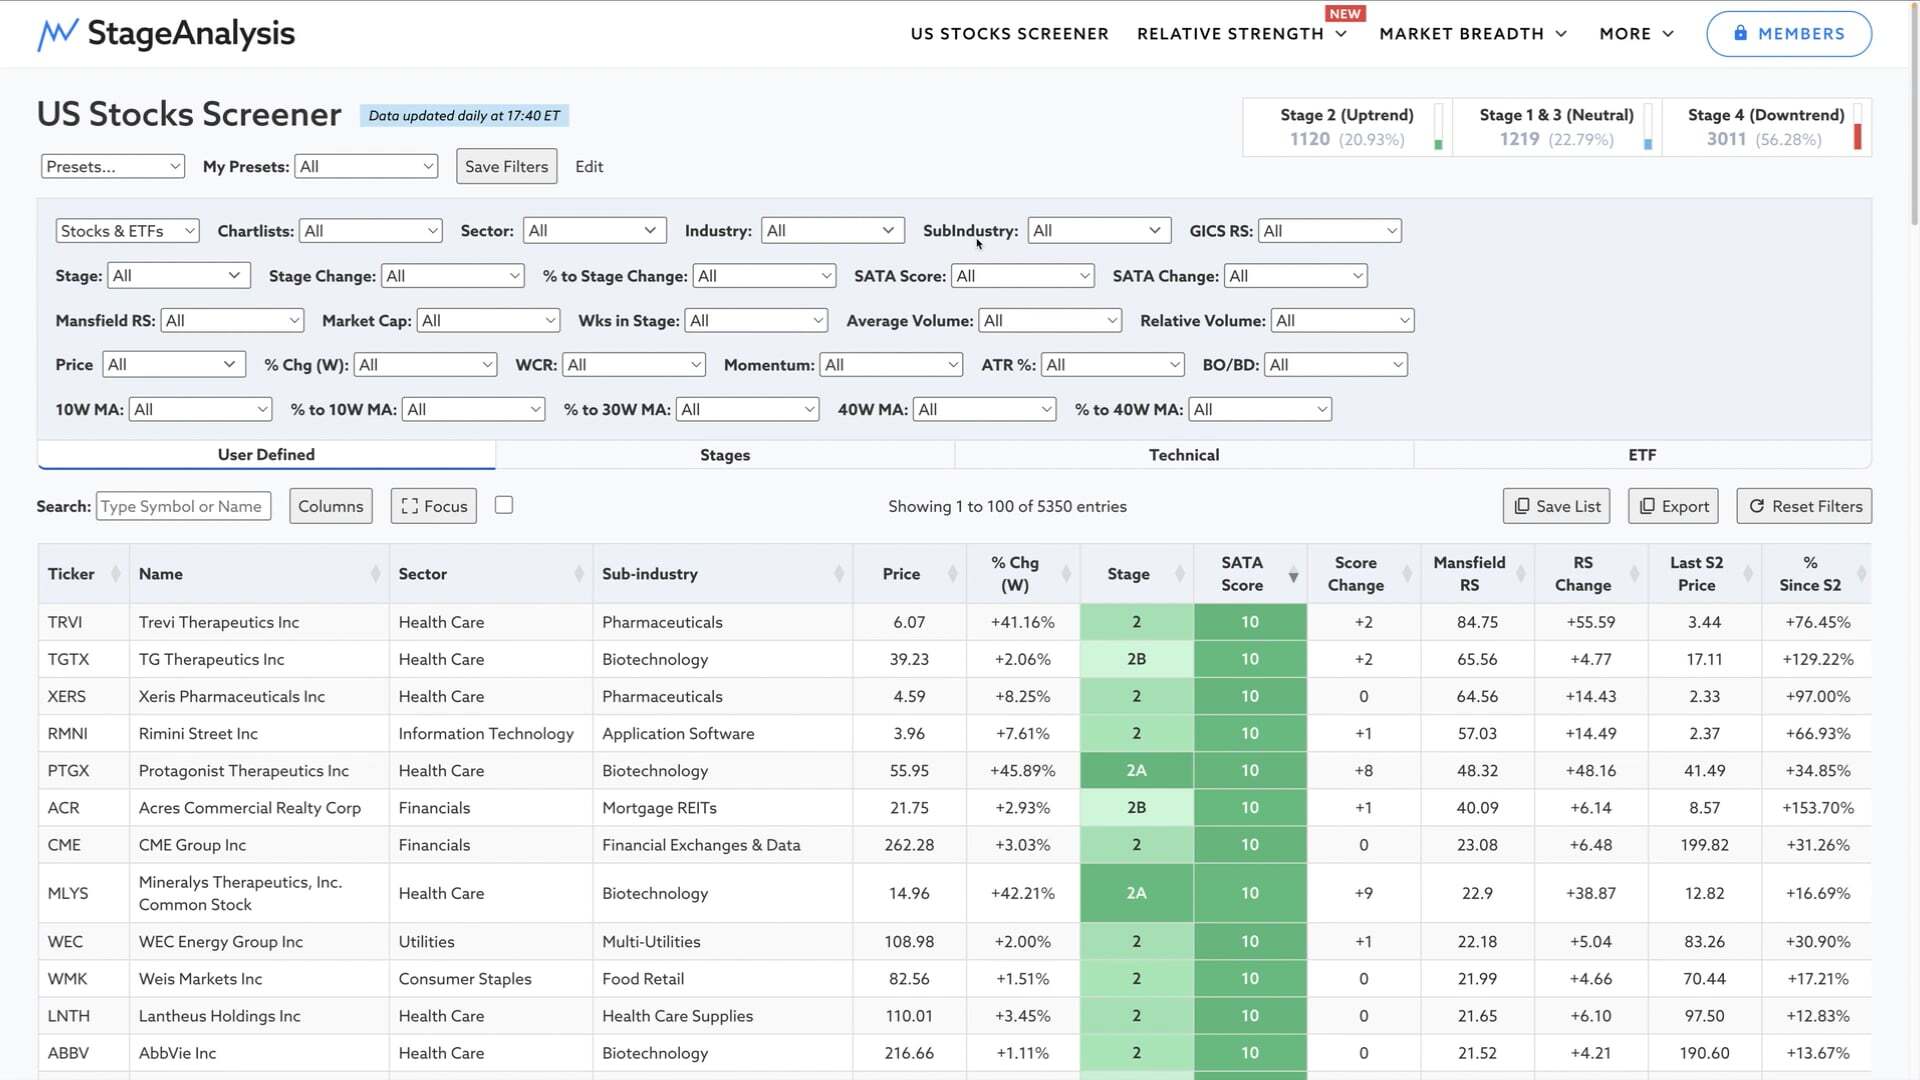
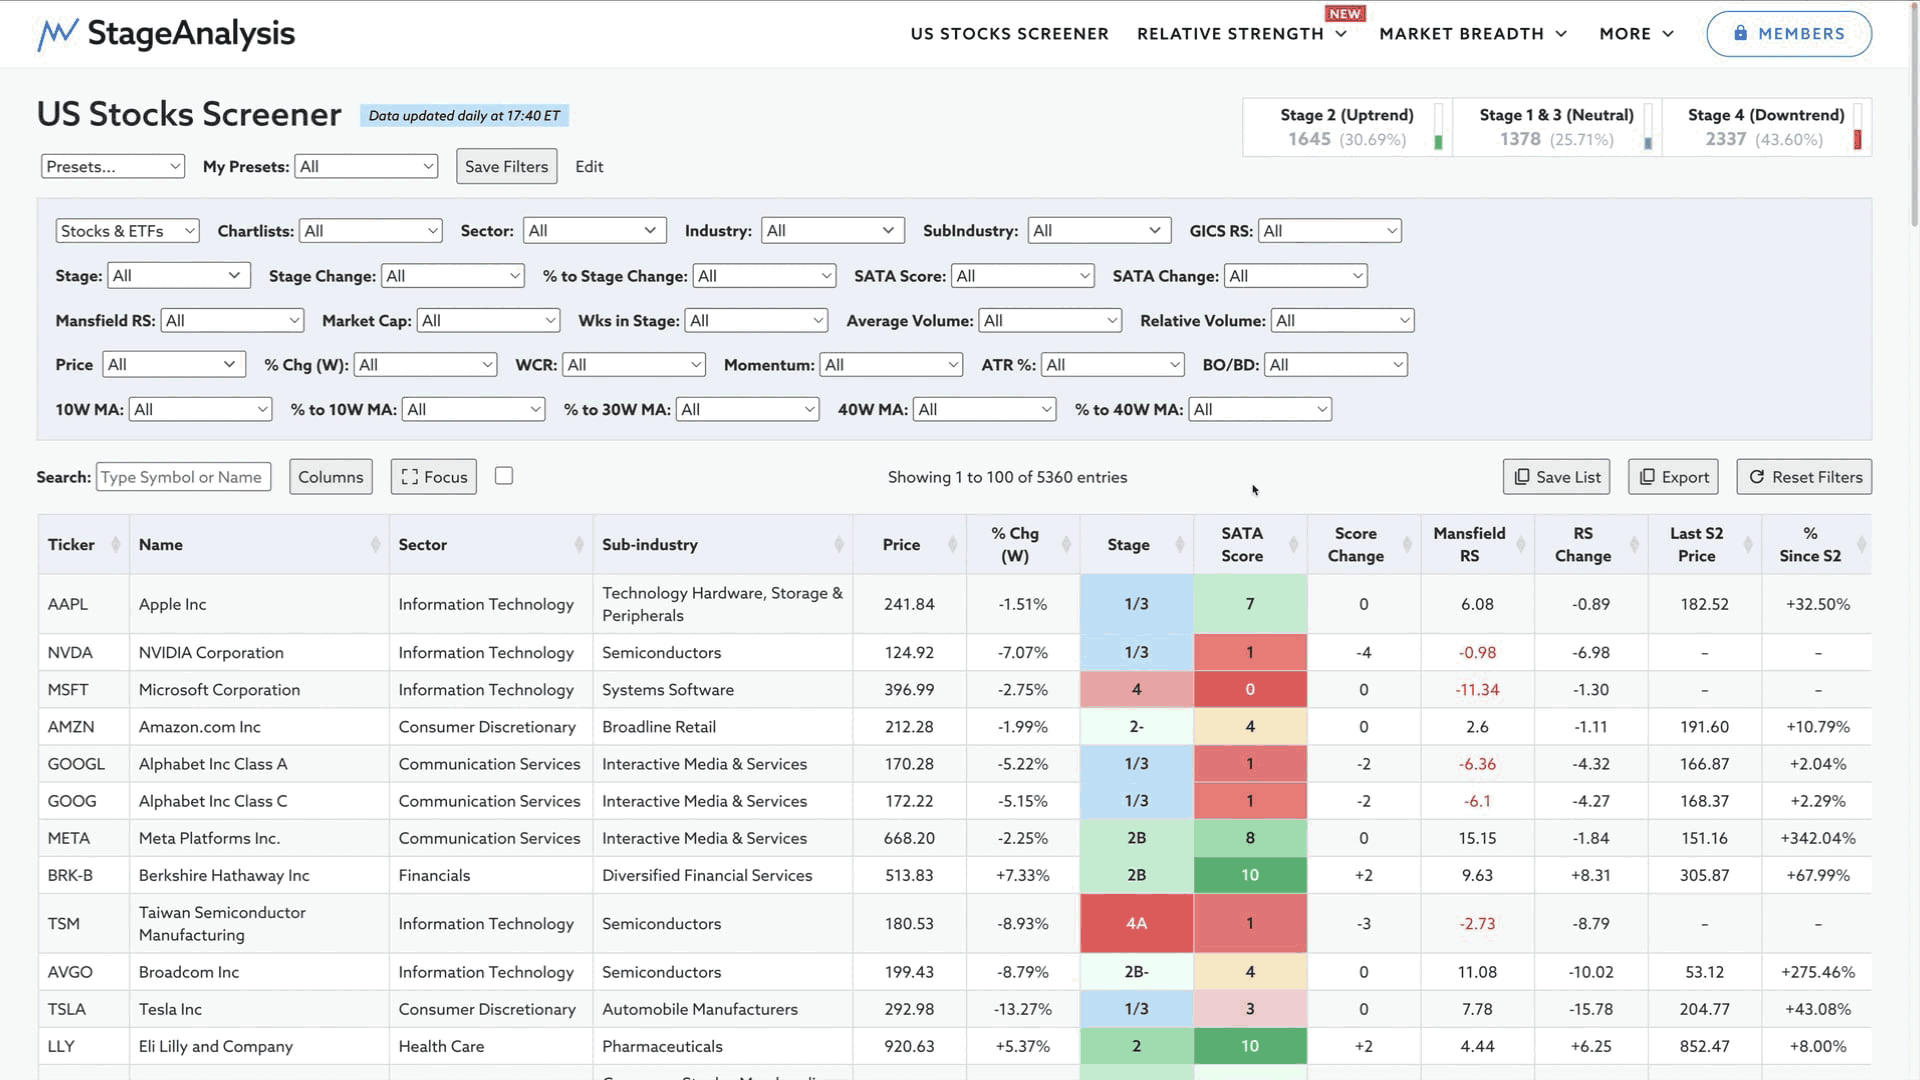
Video: How to Use the Stage Analysis Screener – 3 March 2025
Detailed video explaining the current features available in the Stage Analysis Screener at the time of recording in March 2025 and how to use them, as well as an overview of the various other Stage Analysis tools and features available to the members on the website...
Read More