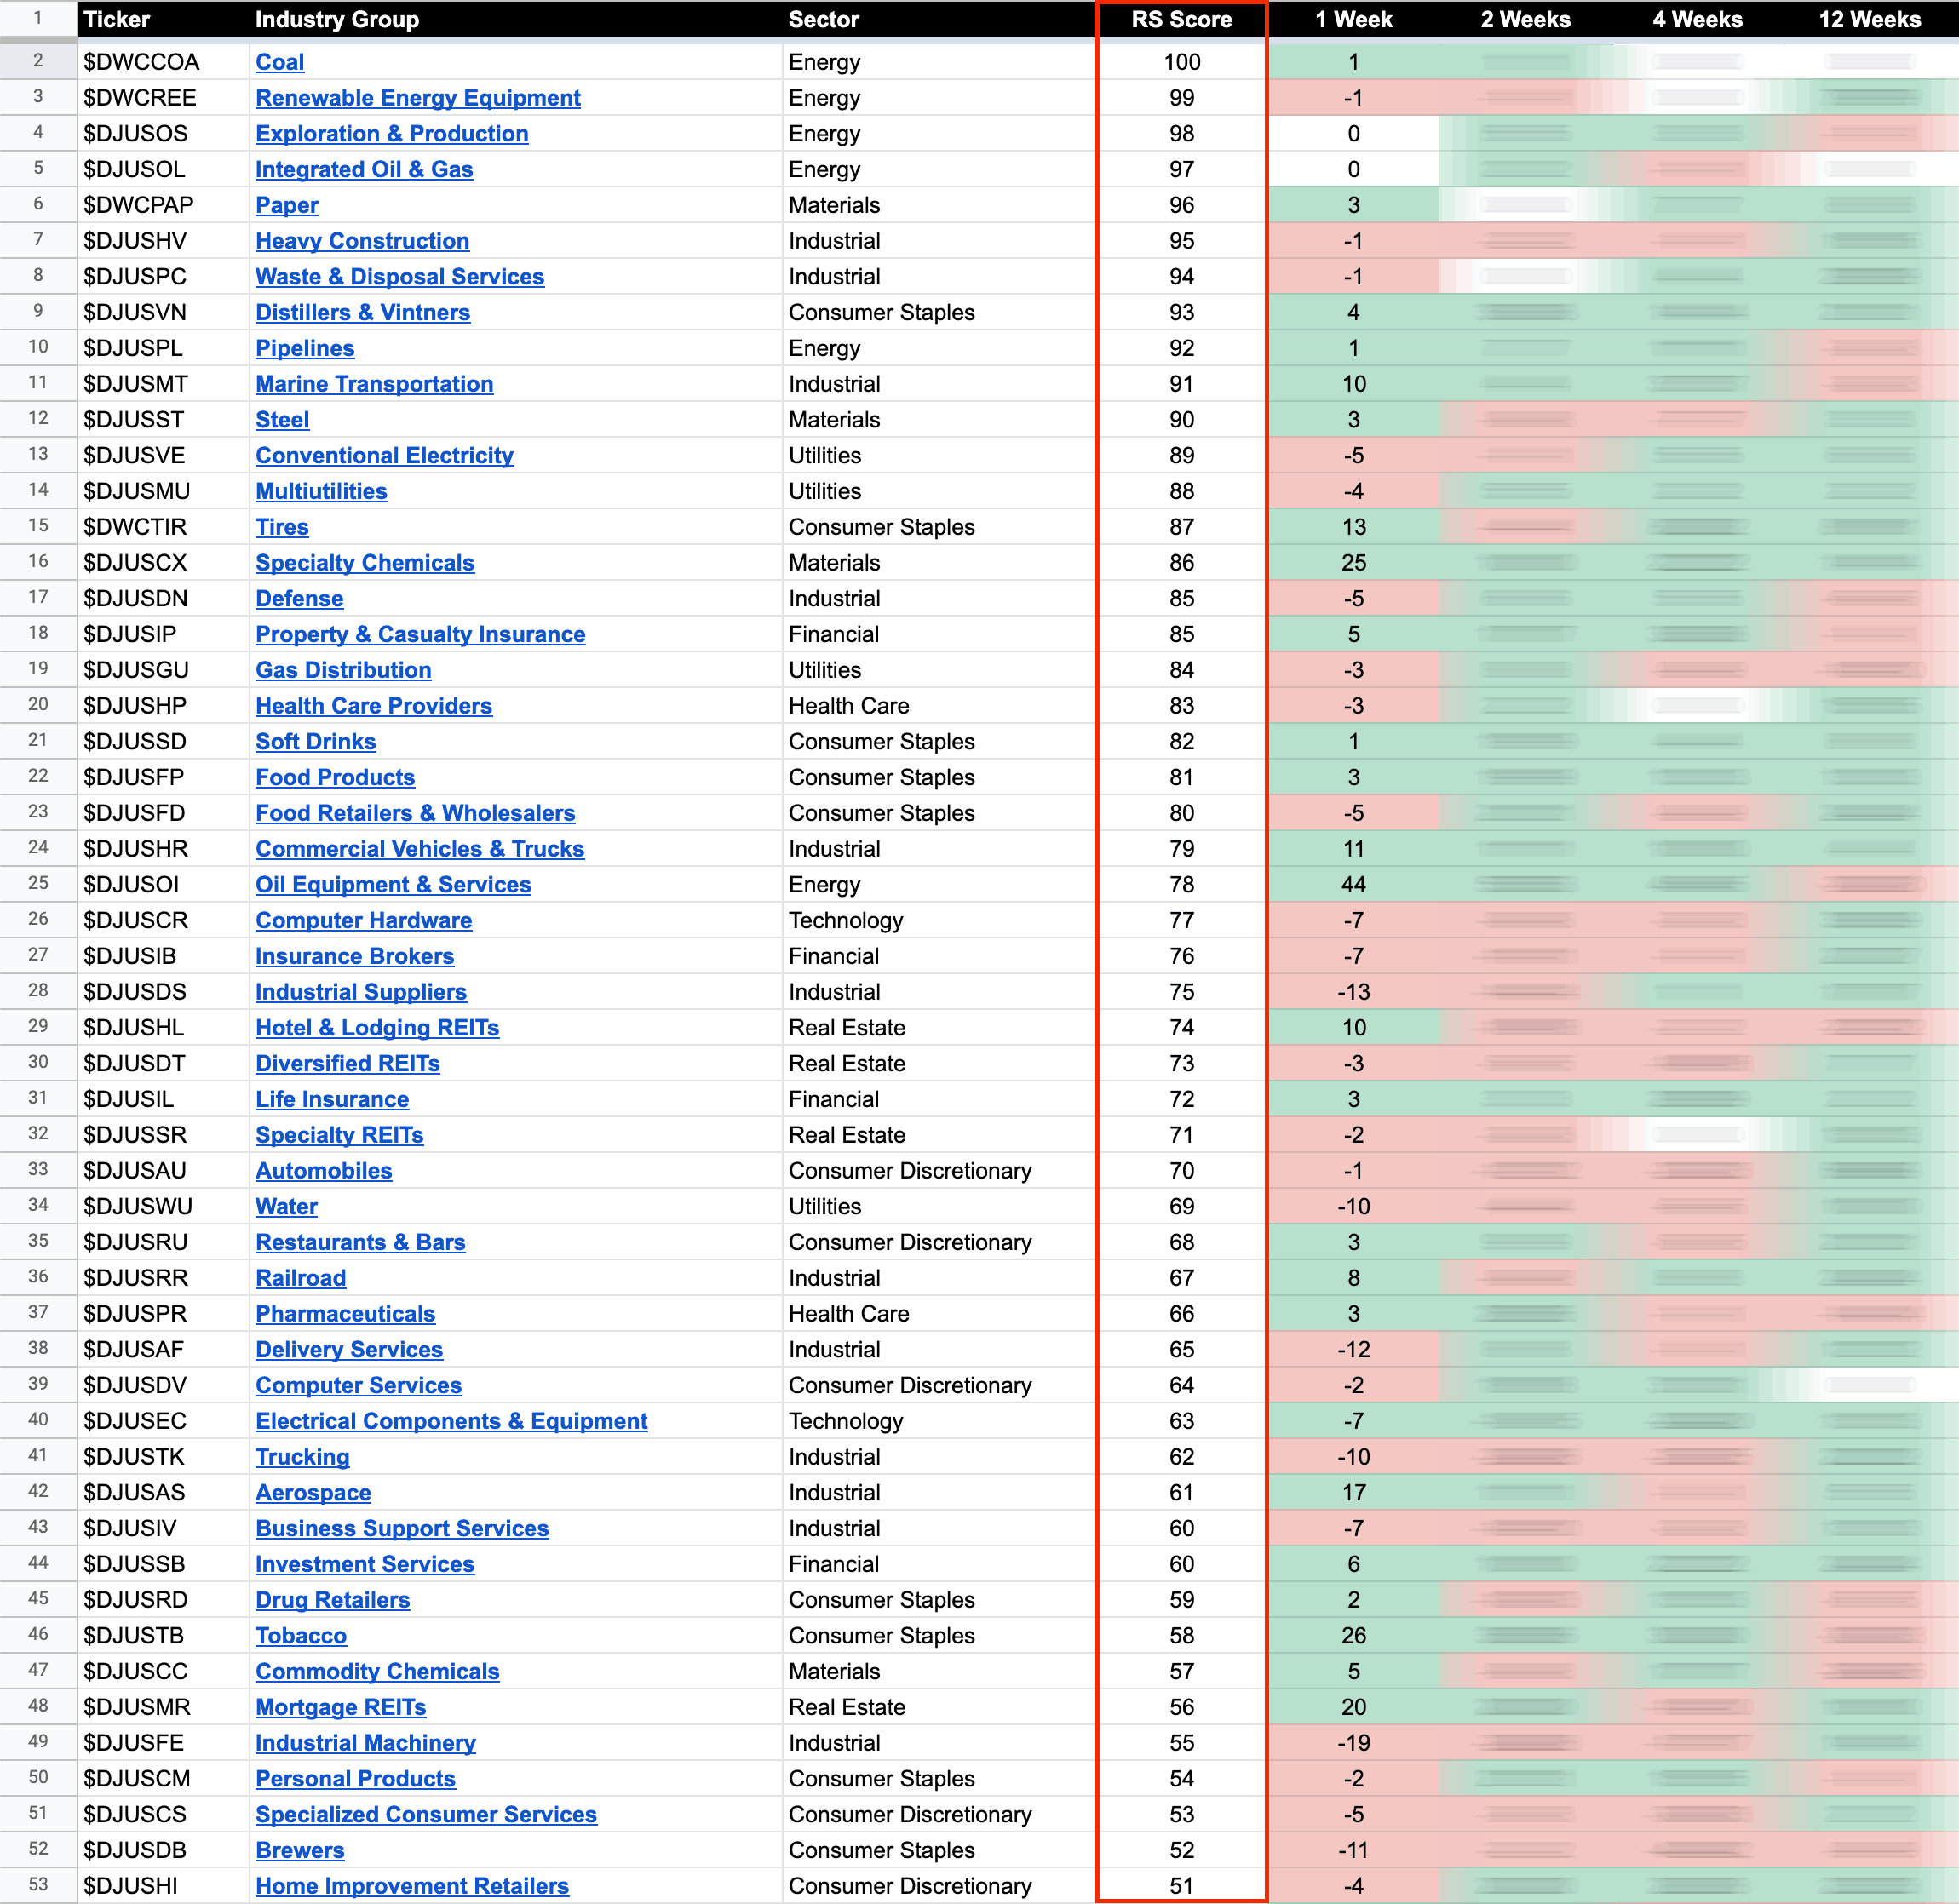
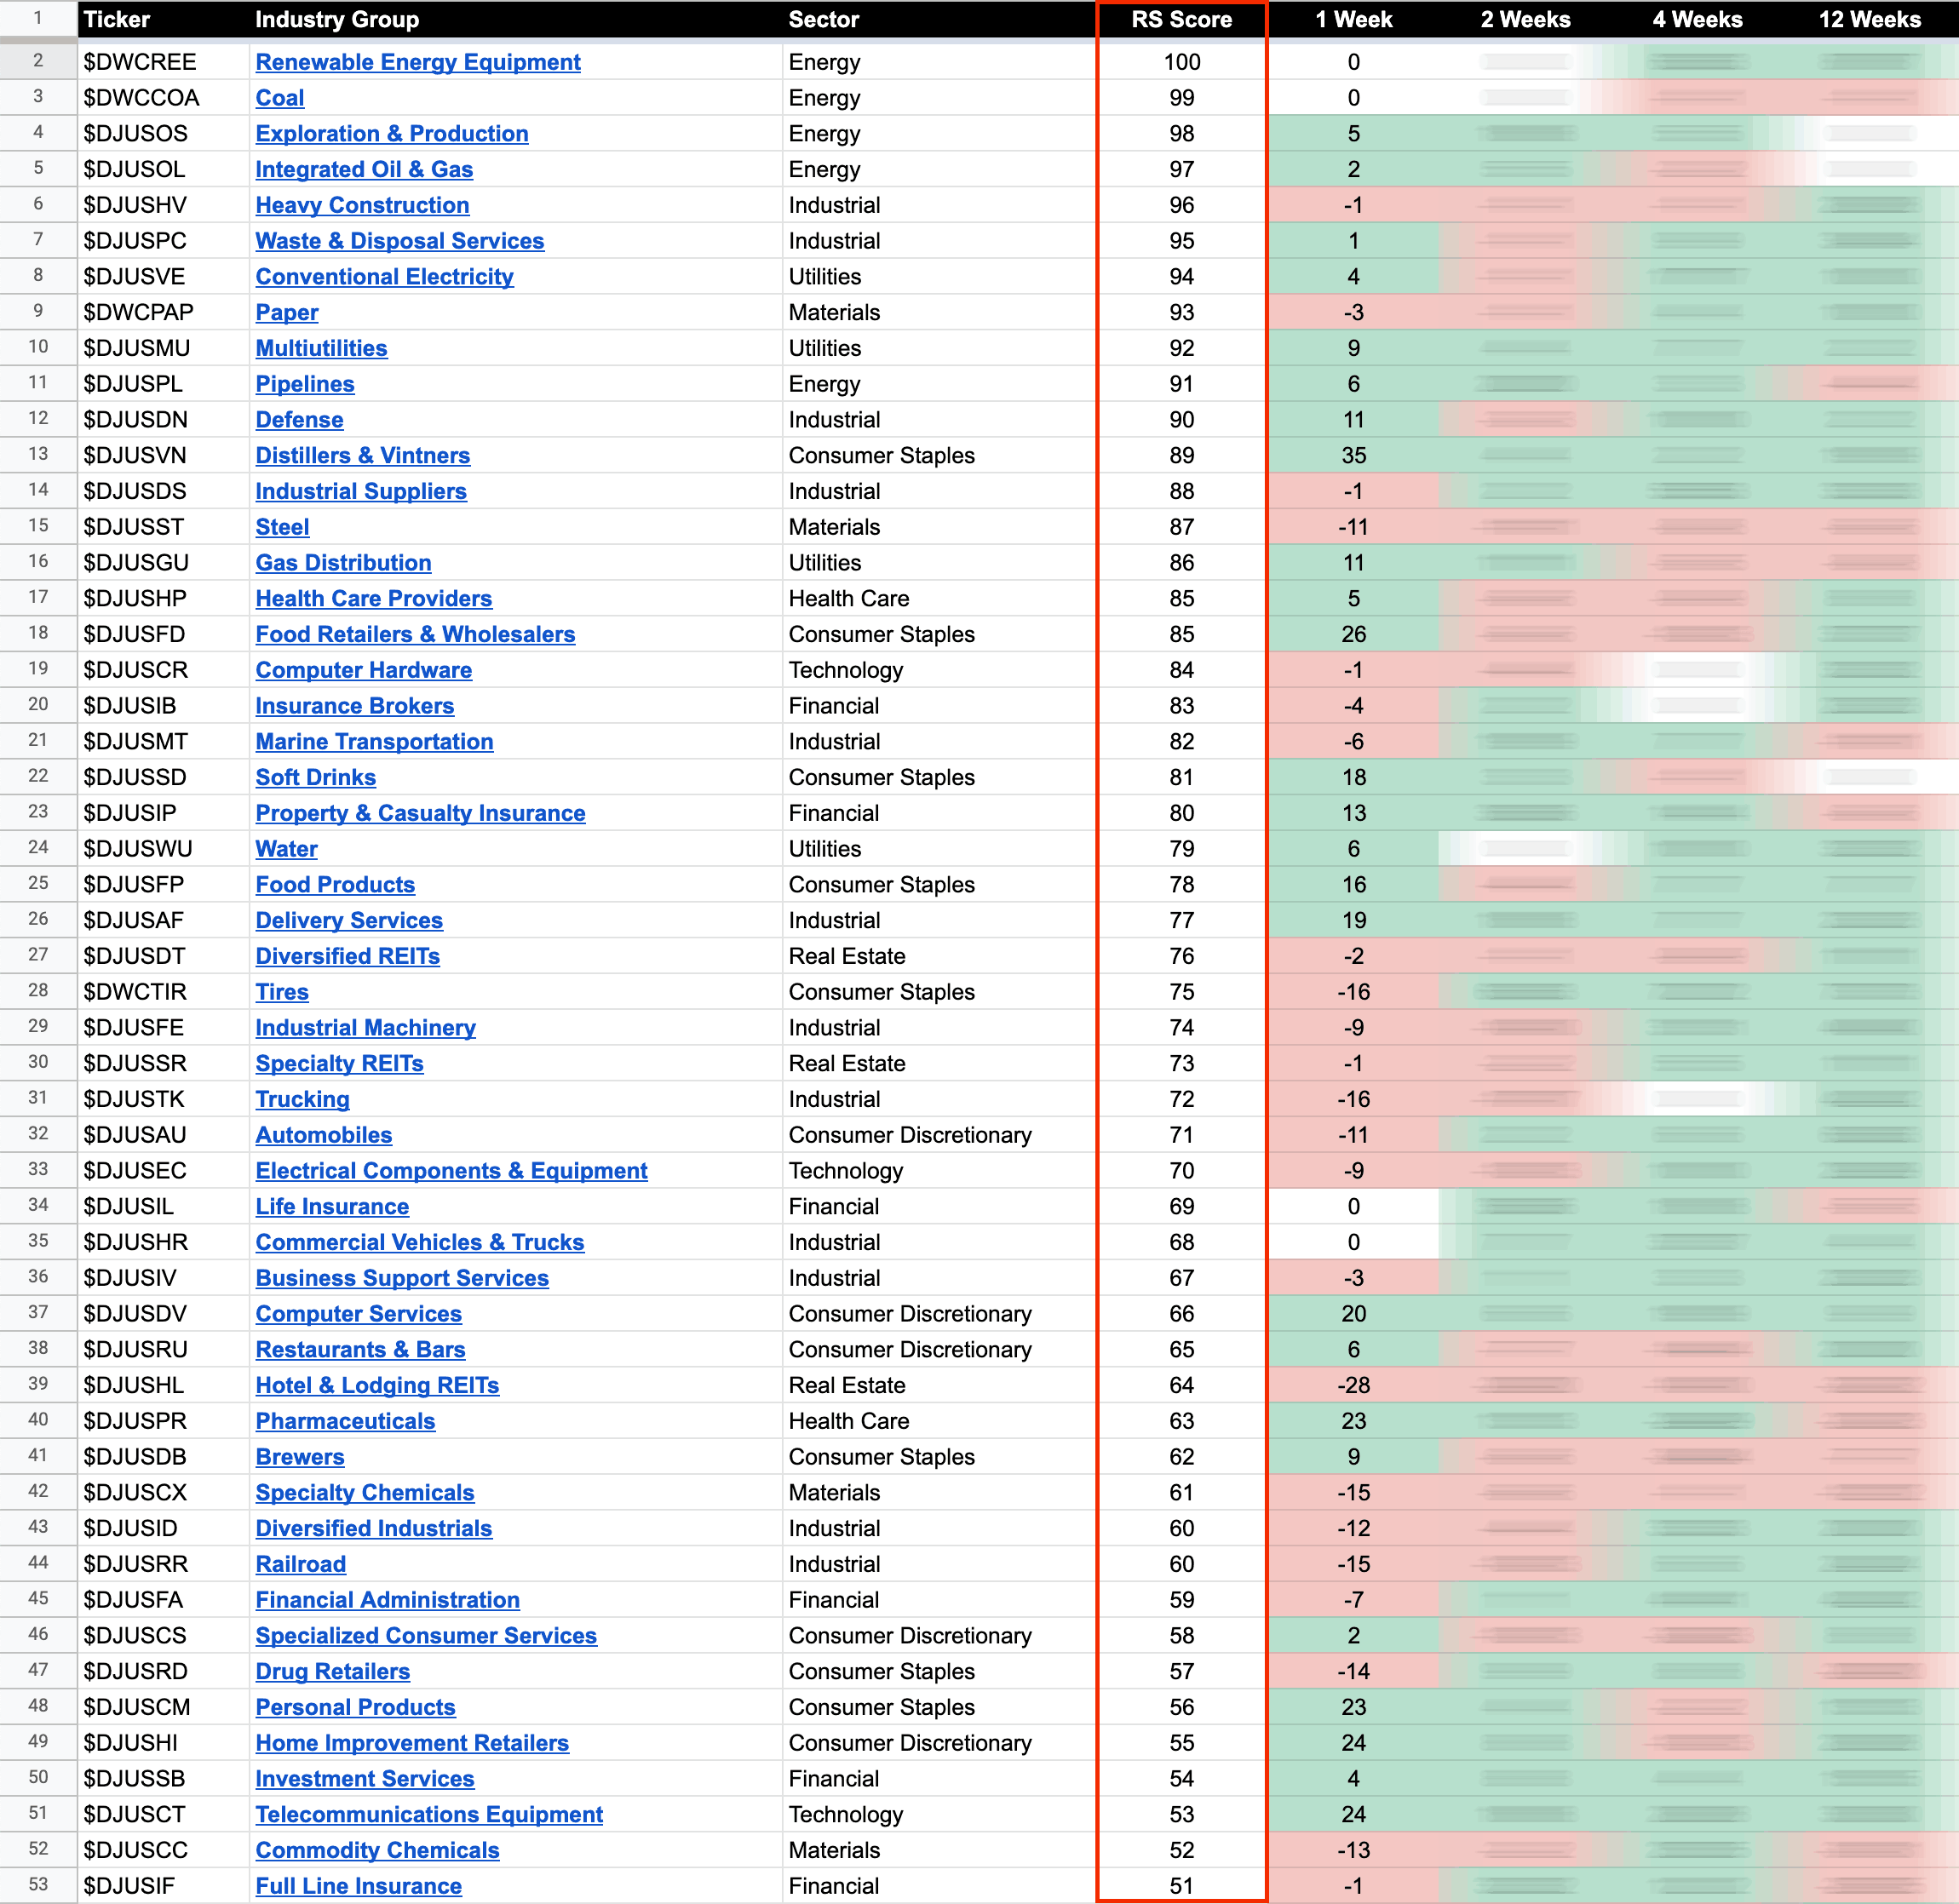
The purpose of the Relative Strength (RS) tables is to track the short, medium and long term RS changes of the individual groups to find the new leadership earlier than the crowd...
Read More
Blog
26 August, 2022
US Stocks Industry Groups Relative Strength Rankings
26 August, 2022
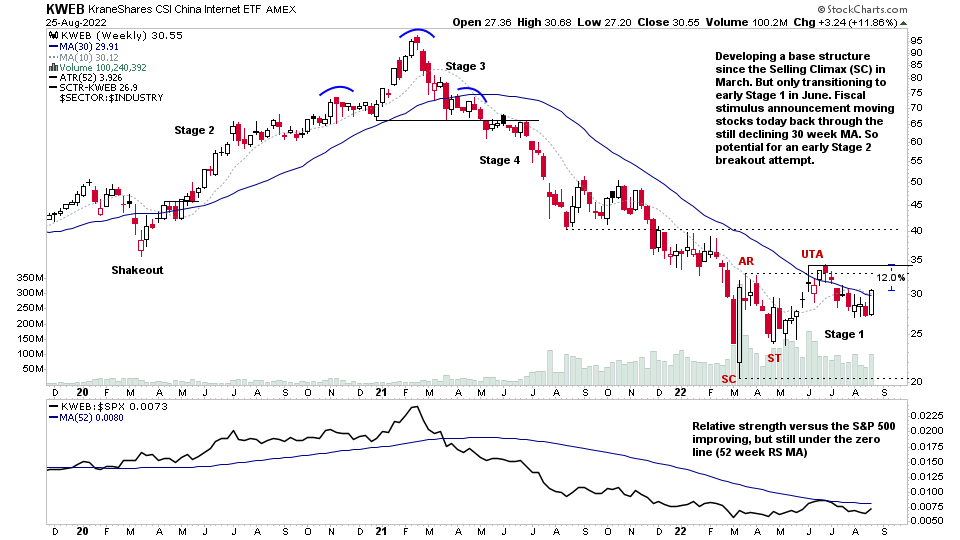
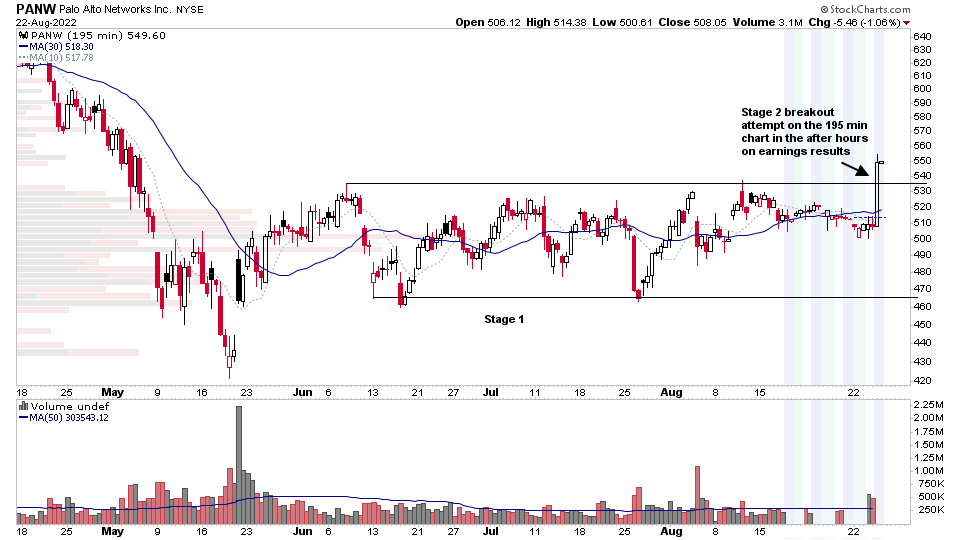
Chinese Stocks Proliferate in Stage 1 Bases and the US Stocks Watchlist – 25 August 2022
Chinese stocks have surged back into focus today with gap up moves in numerous stocks within developing weekly Stage 1 base structures in the group, that have been forming in some stocks for as much as 8 months+, after huge Stage 4 declines through 2021 across the group...
Read More
24 August, 2022
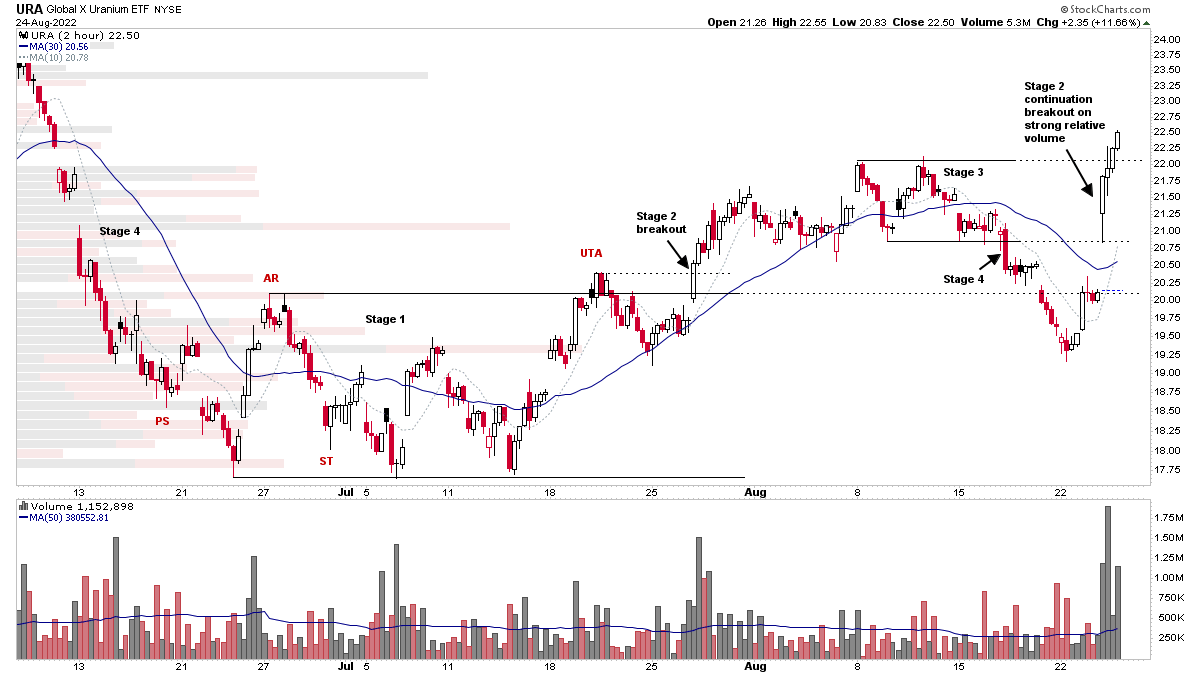
Stage Analysis Members Midweek Video – 24 August 2022 (1hr)
Todays Stage Analysis Members Video begins with a focus on the Uranium group, which formed a Sign of Strength bar in multiple stocks in the group today with strong relative volume, pushing the group towards the upper end of the recent base structure that's been developing as potential Stage 1. So there's a possibility that the group could attempt an early move Stage 2.
Read More
23 August, 2022
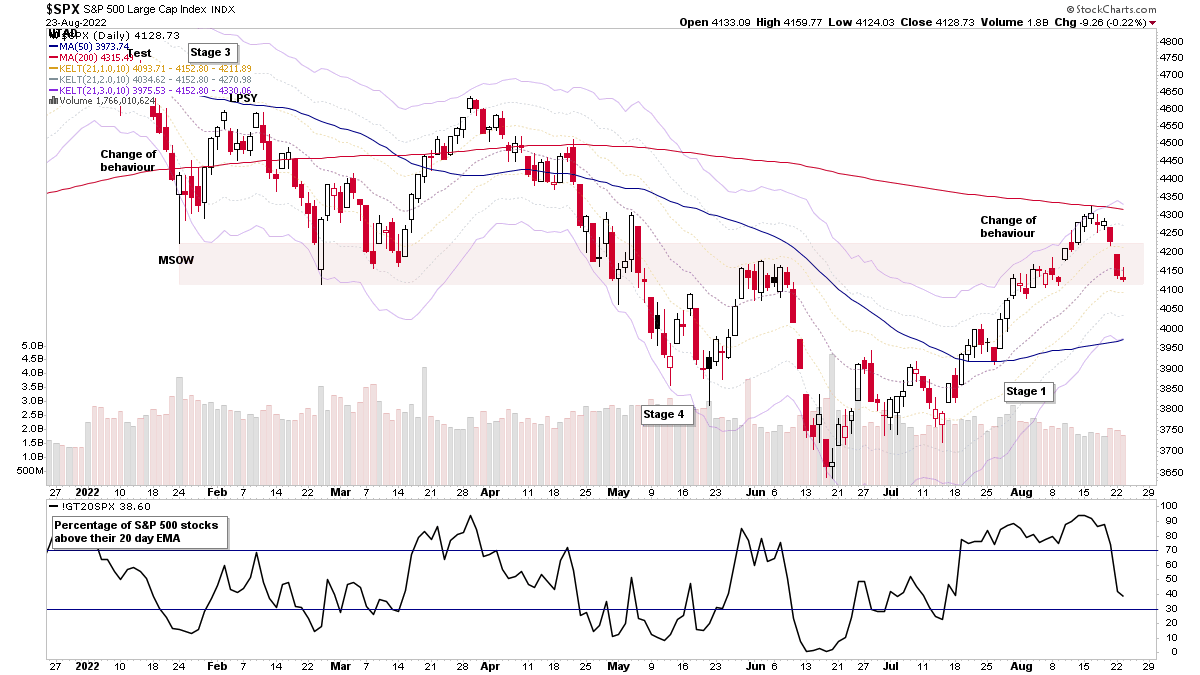
Stock Market Update and US Stocks Watchlist – 23 August 2022
The major indexes, i.e. the S&P 500, Nasdaq, Russell 2000 etc, all continued to pullback today with a weak failed attempt to regain the 21 day EMA and then poor close near the bottom of the daily candle. So all had a second daily close below the 21 day EMA and the short-term market breadth indicators, such as the S&P 500 percentage of stocks above their 20 day EMA (which can be seen in the top chart), continued lower also and closed at 38.60%.
Read More
23 August, 2022
US Stocks Watchlist – 22 August 2022
Renewable Energy Equipment was big feature in tonights watchlist, as multiple stocks in this leading group are pulling back towards short-term MAs, and so could be near to actionable areas if the market doesn't fall apart that is...
Read More
21 August, 2022
Stage Analysis Members Weekend Video – 21 August 2022 (1hr 34mins)
This weeks Stage Analysis Members video begins with a discussion of a more complex Stage 1 base structure that can develop when a stock has a very early Stage 2 breakout attempt from a small base that then quickly fails and broadens out into much larger Stage 1 base structure.
Read More
21 August, 2022
US Stocks Watchlist – 21 August 2022
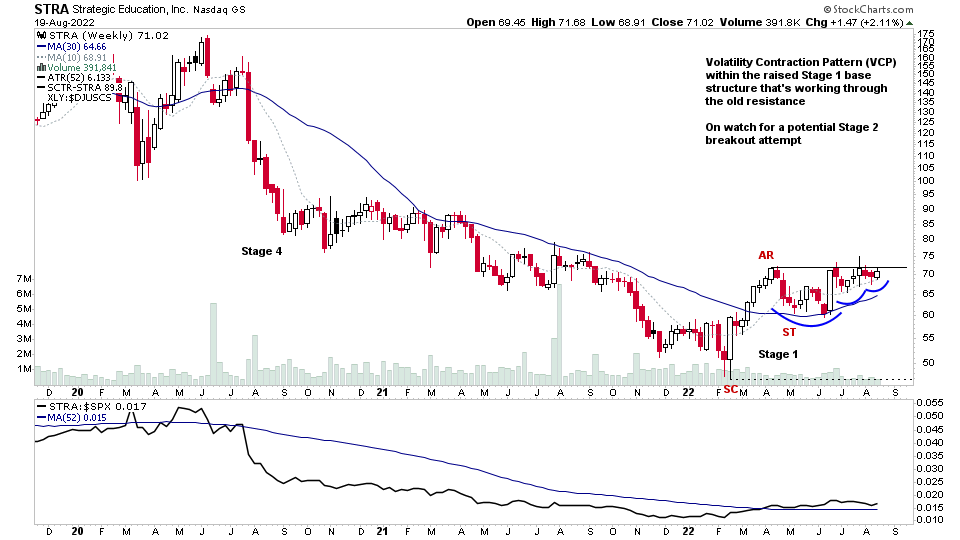
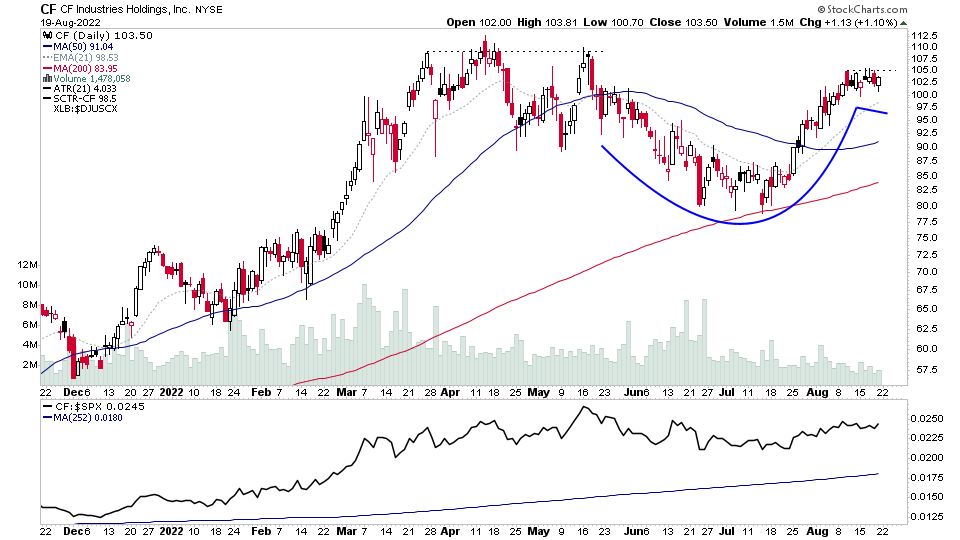
There were 24 stocks for the US stocks watchlist today – STRA, CF, TH,UNG + 20 more...
Read More
20 August, 2022
IBD Industry Groups Bell Curve – Bullish Percent
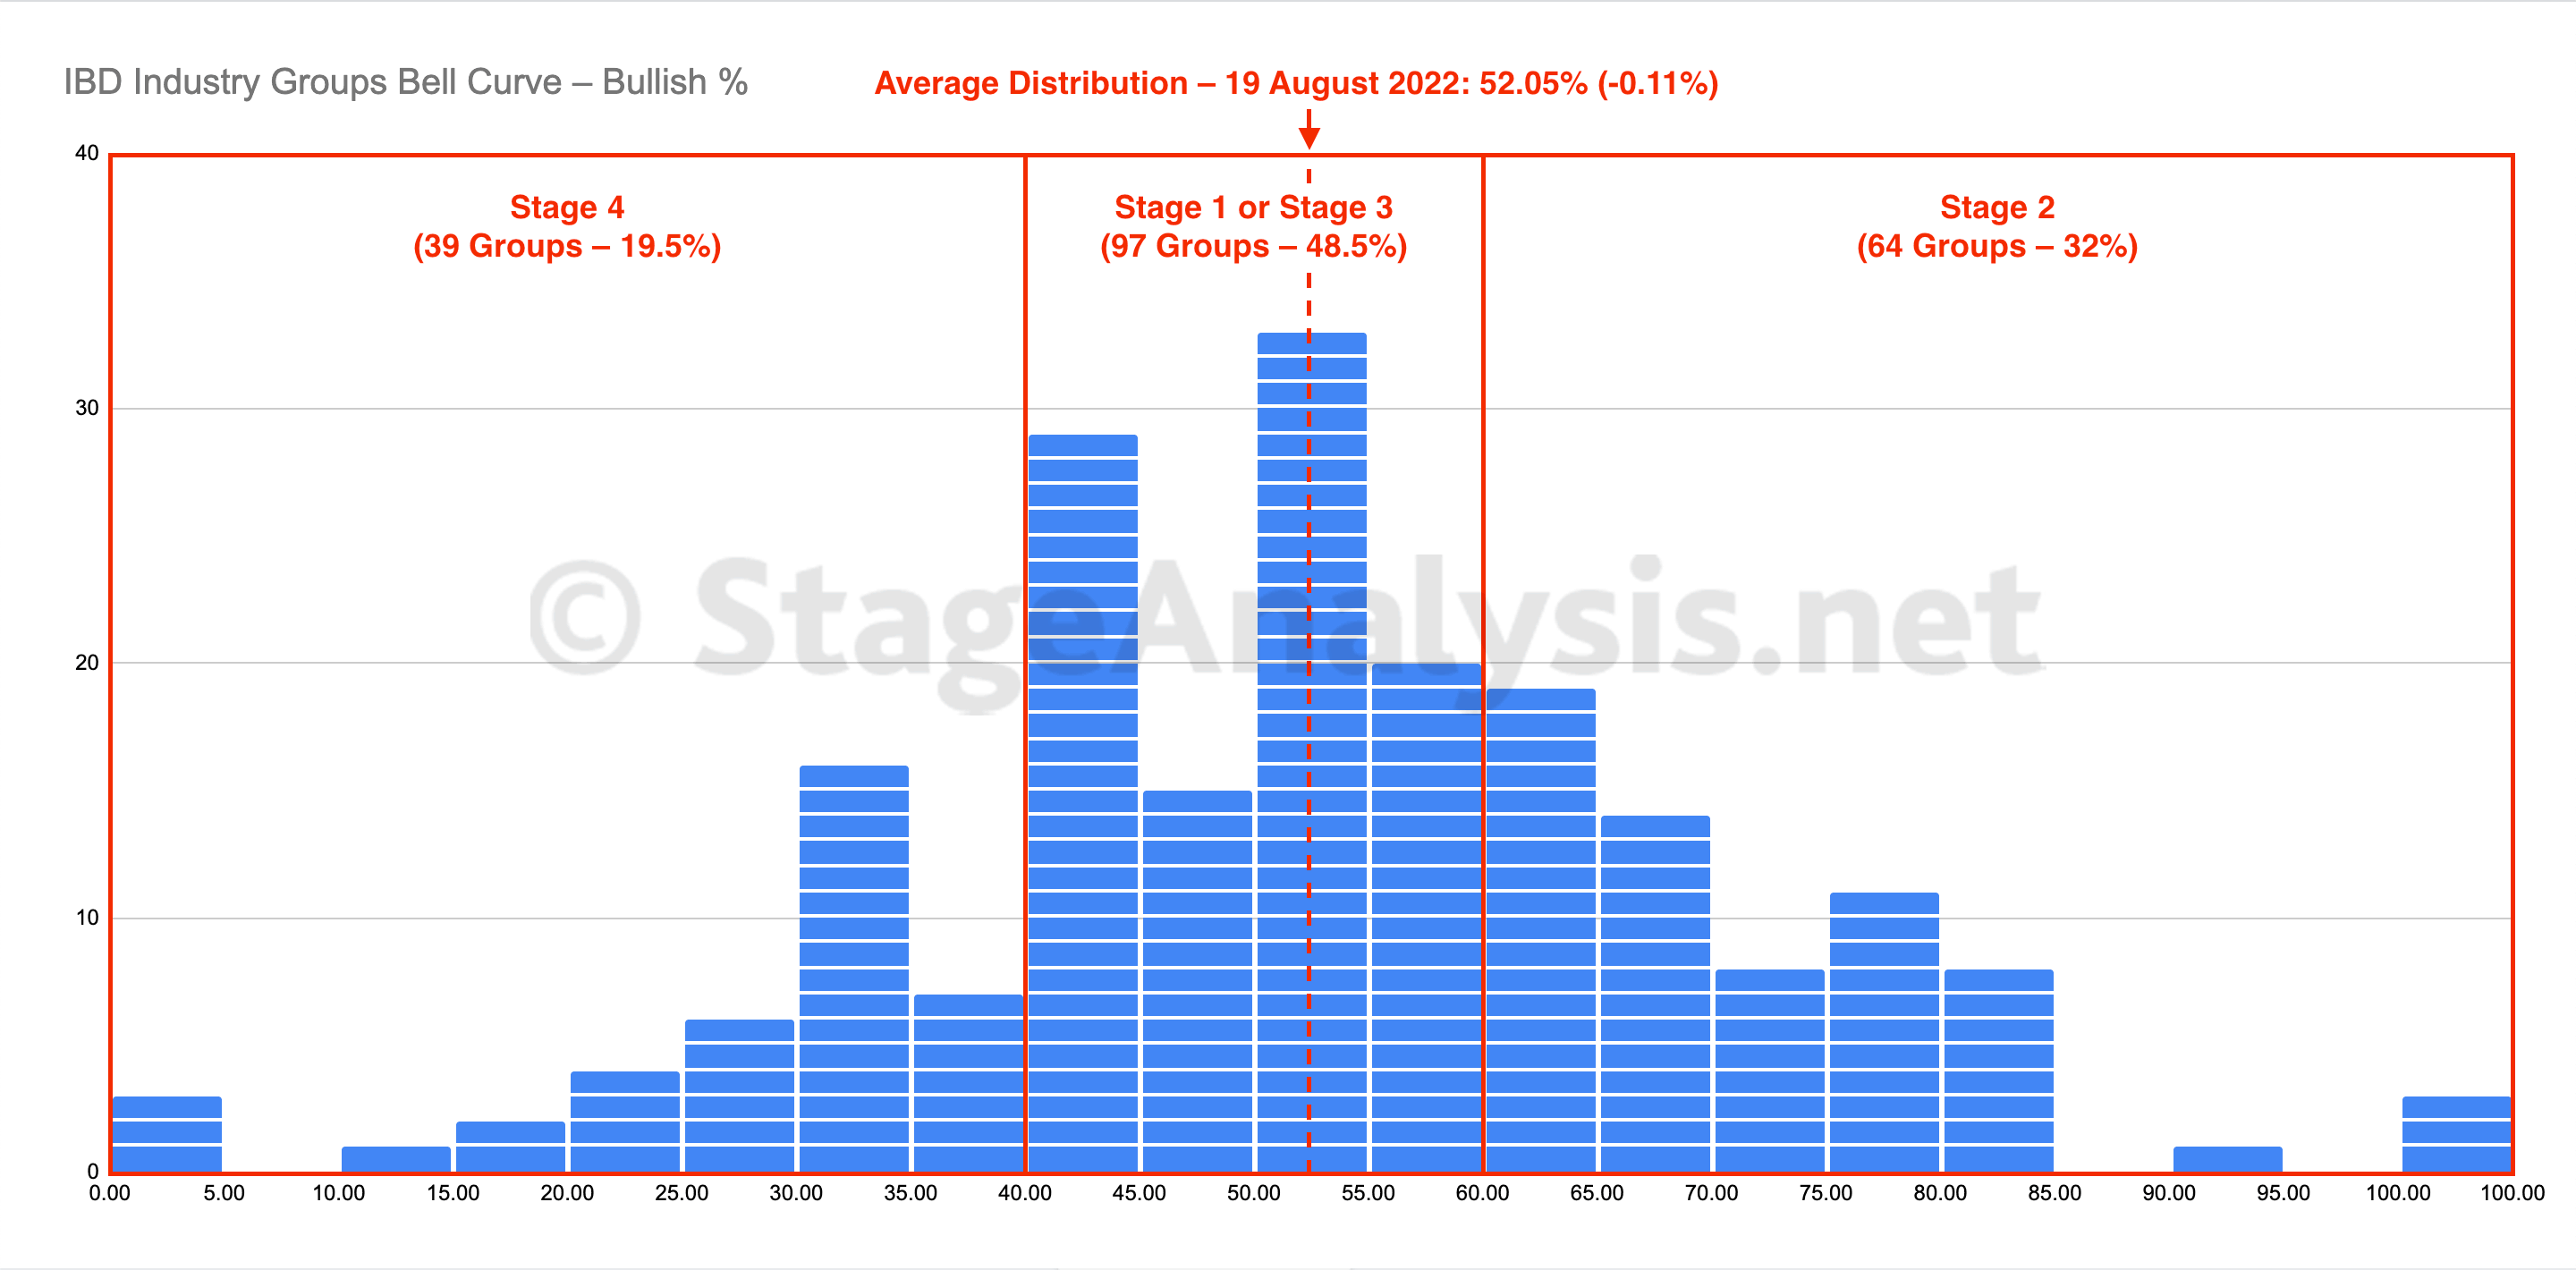
The IBD Industry Groups Bell Curve – Bullish Percent average distribution declining by -0.11% since the previous week, with 3 groups dropping out of the Stage 2 zone and one group dropping back into the Stage 4 zone. But the overall average remains slightly above the mid point of the bell curve, which is the Stage 1 zone when rising from the lower Stage 4 zone.
Read More
20 August, 2022
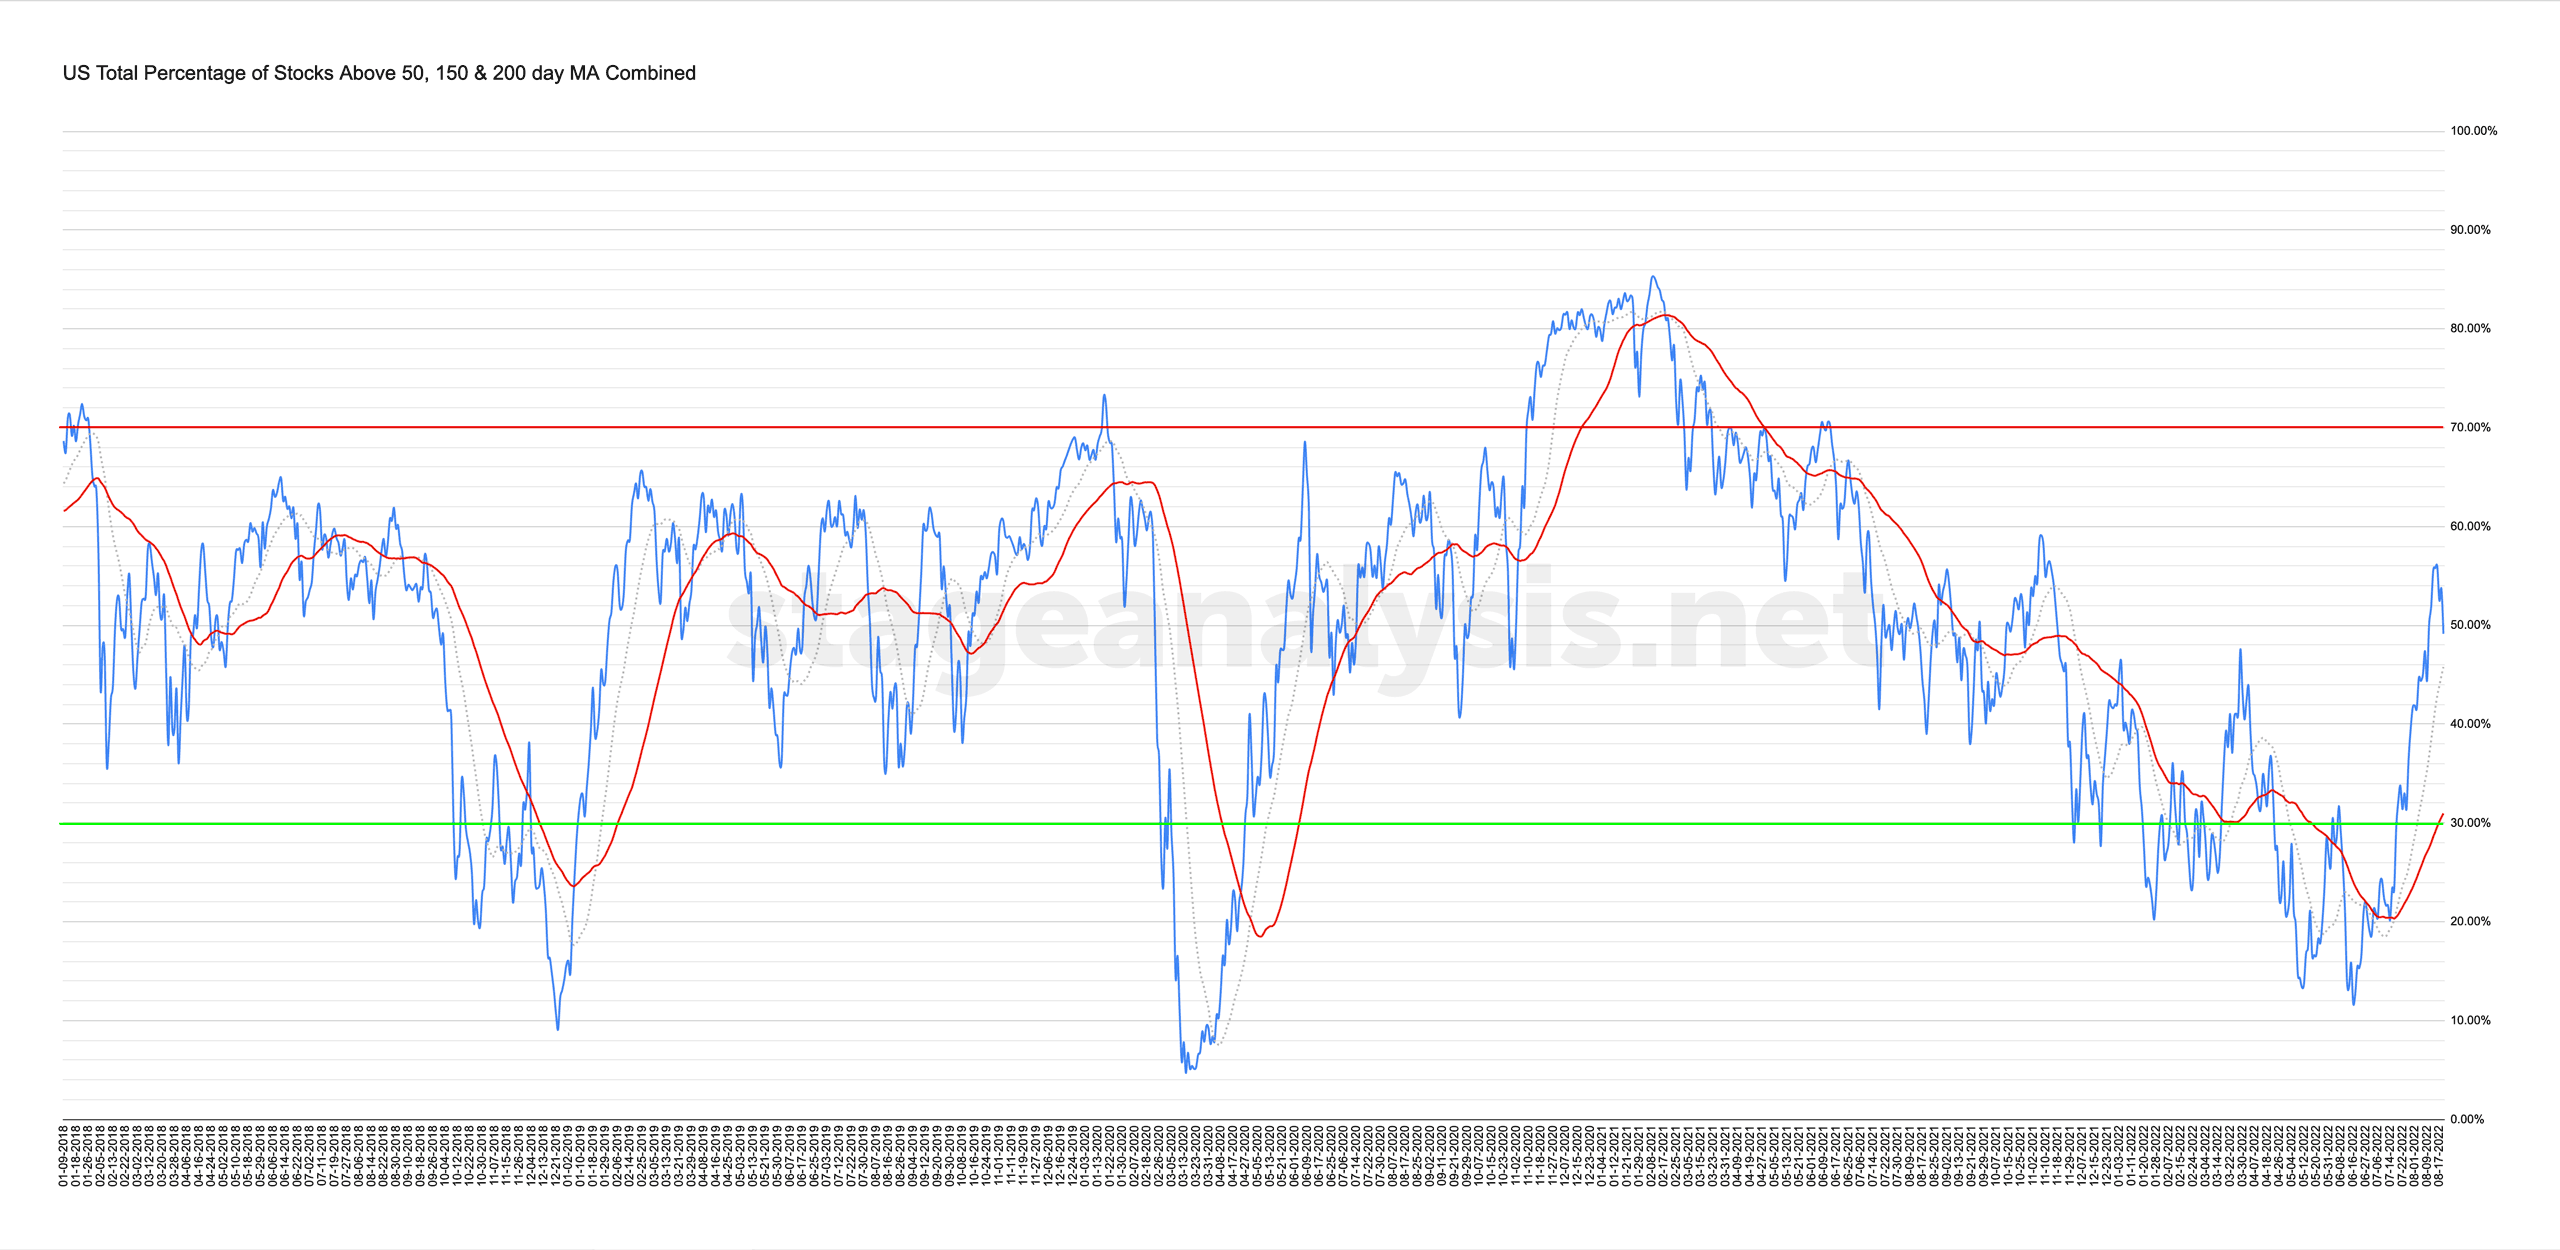
Market Breadth: Percentage of Stocks Above their 50 Day, 150 Day & 200 Day Moving Averages Combined
Custom Percentage of Stocks Above Their 50 Day, 150 Day & 200 Day Moving Averages Combined Market Breadth Charts for the Overall US Market, NYSE and Nasdaq for Market Timing and Strategy.
Read More
19 August, 2022
US Stocks Industry Groups Relative Strength Rankings
The purpose of the Relative Strength (RS) tables is to track the short, medium and long term RS changes of the individual groups to find the new leadership earlier than the crowd...
Read More

