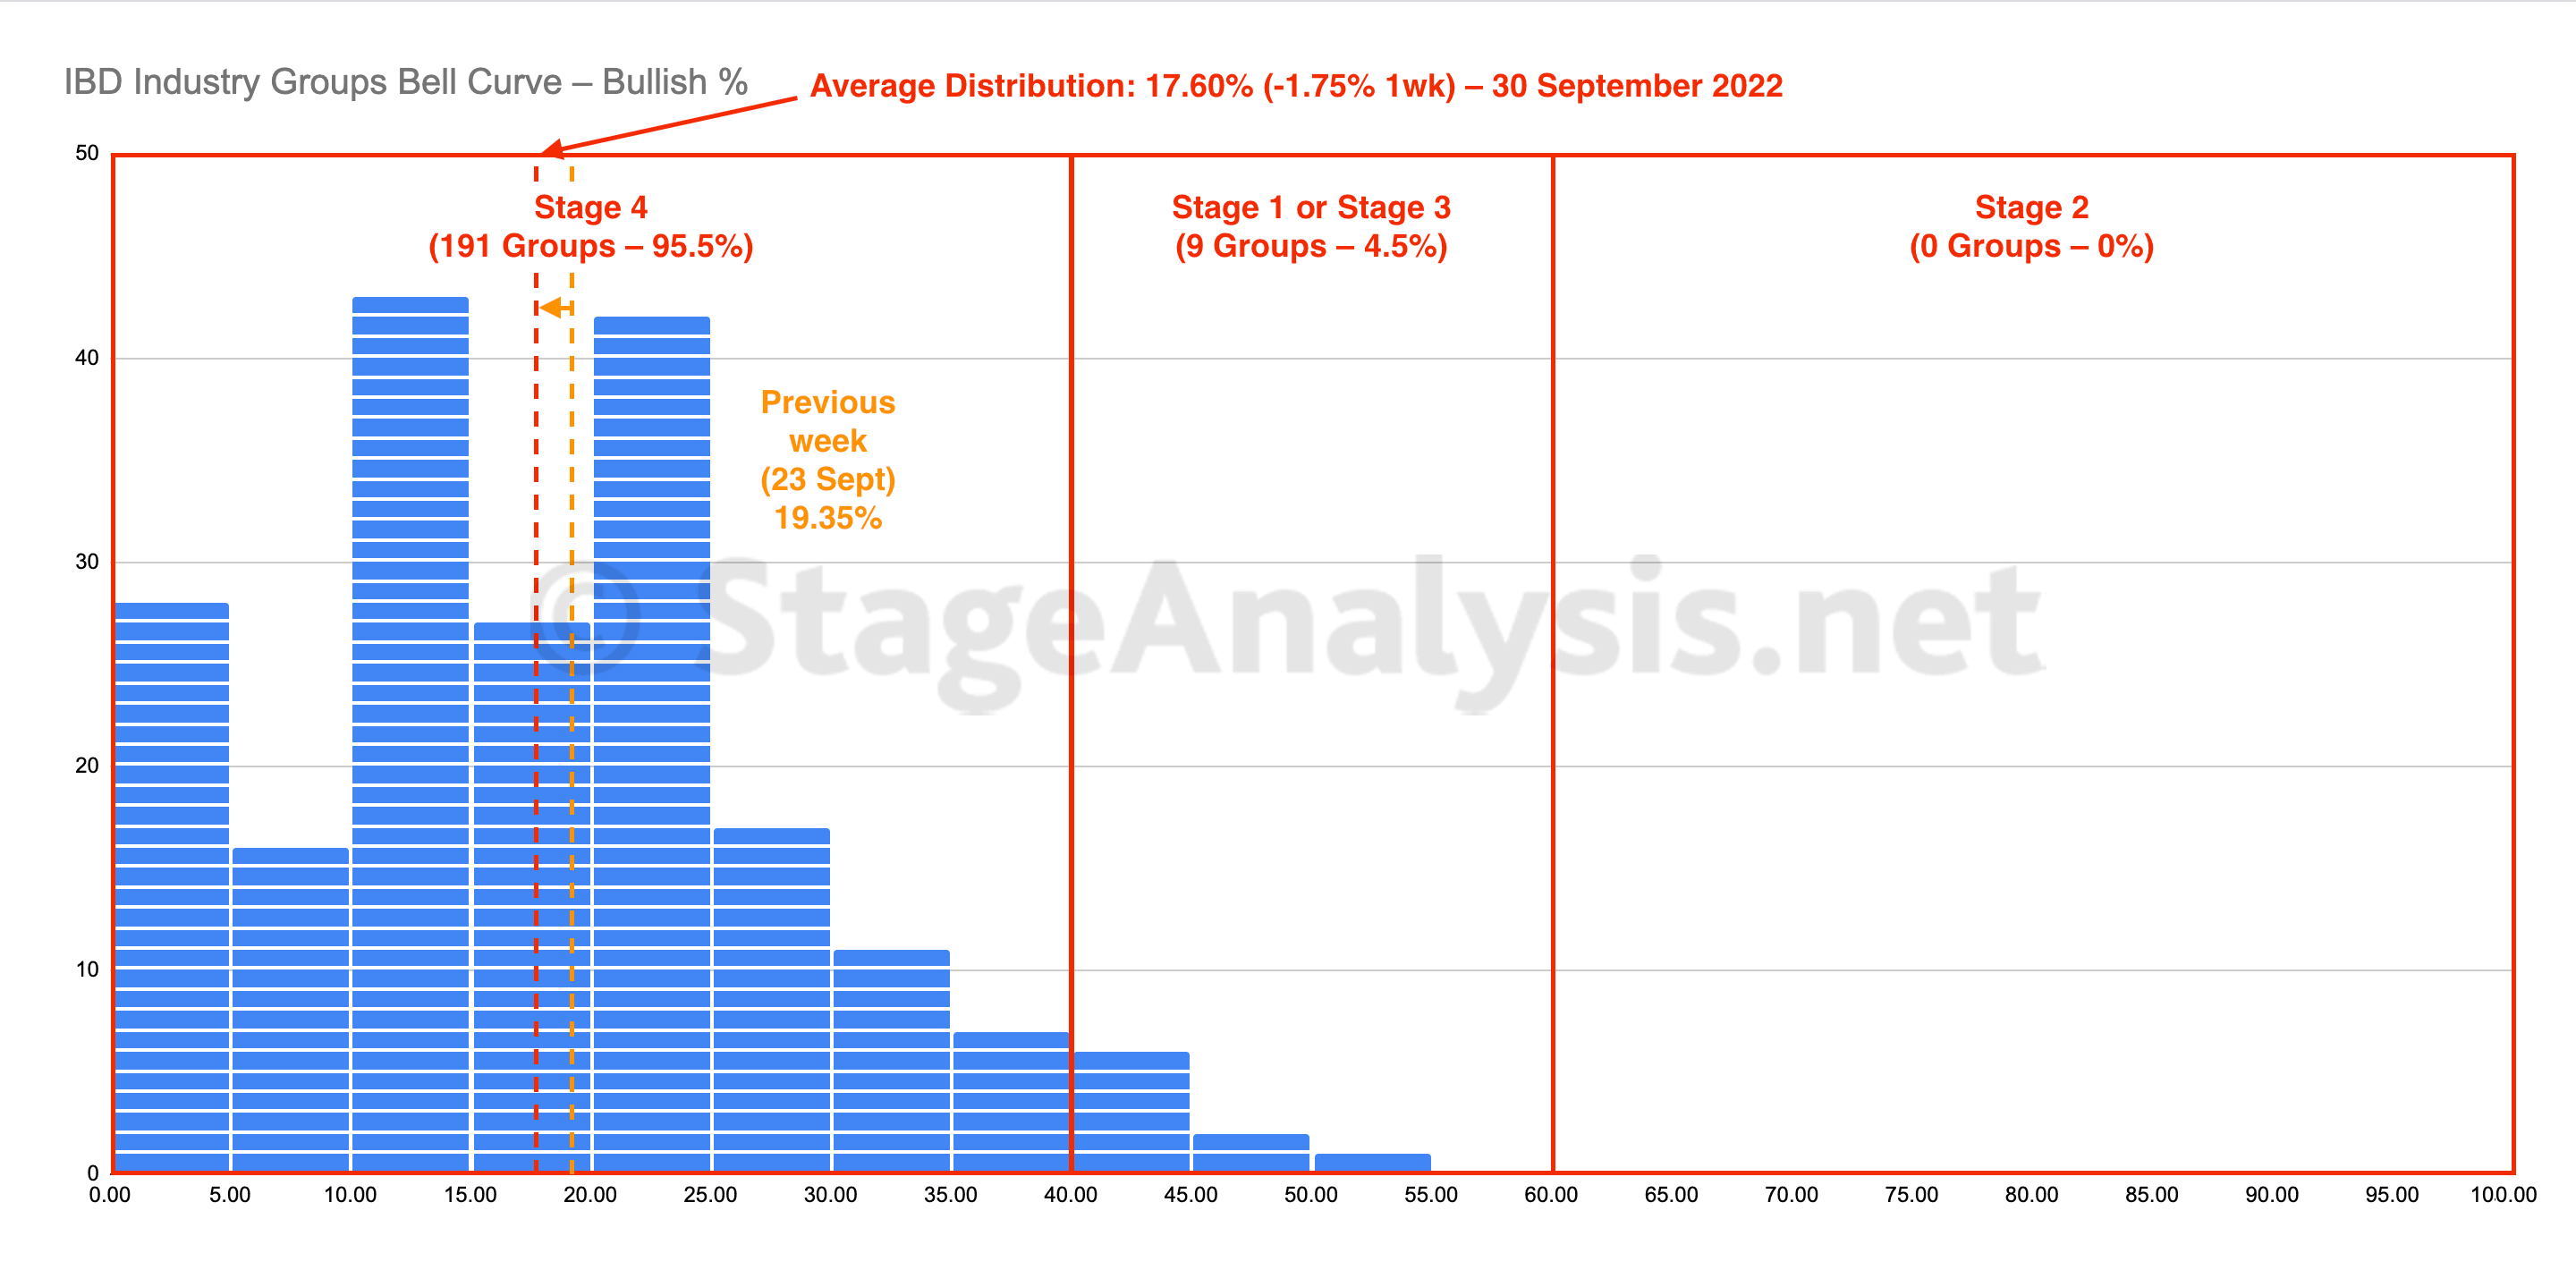
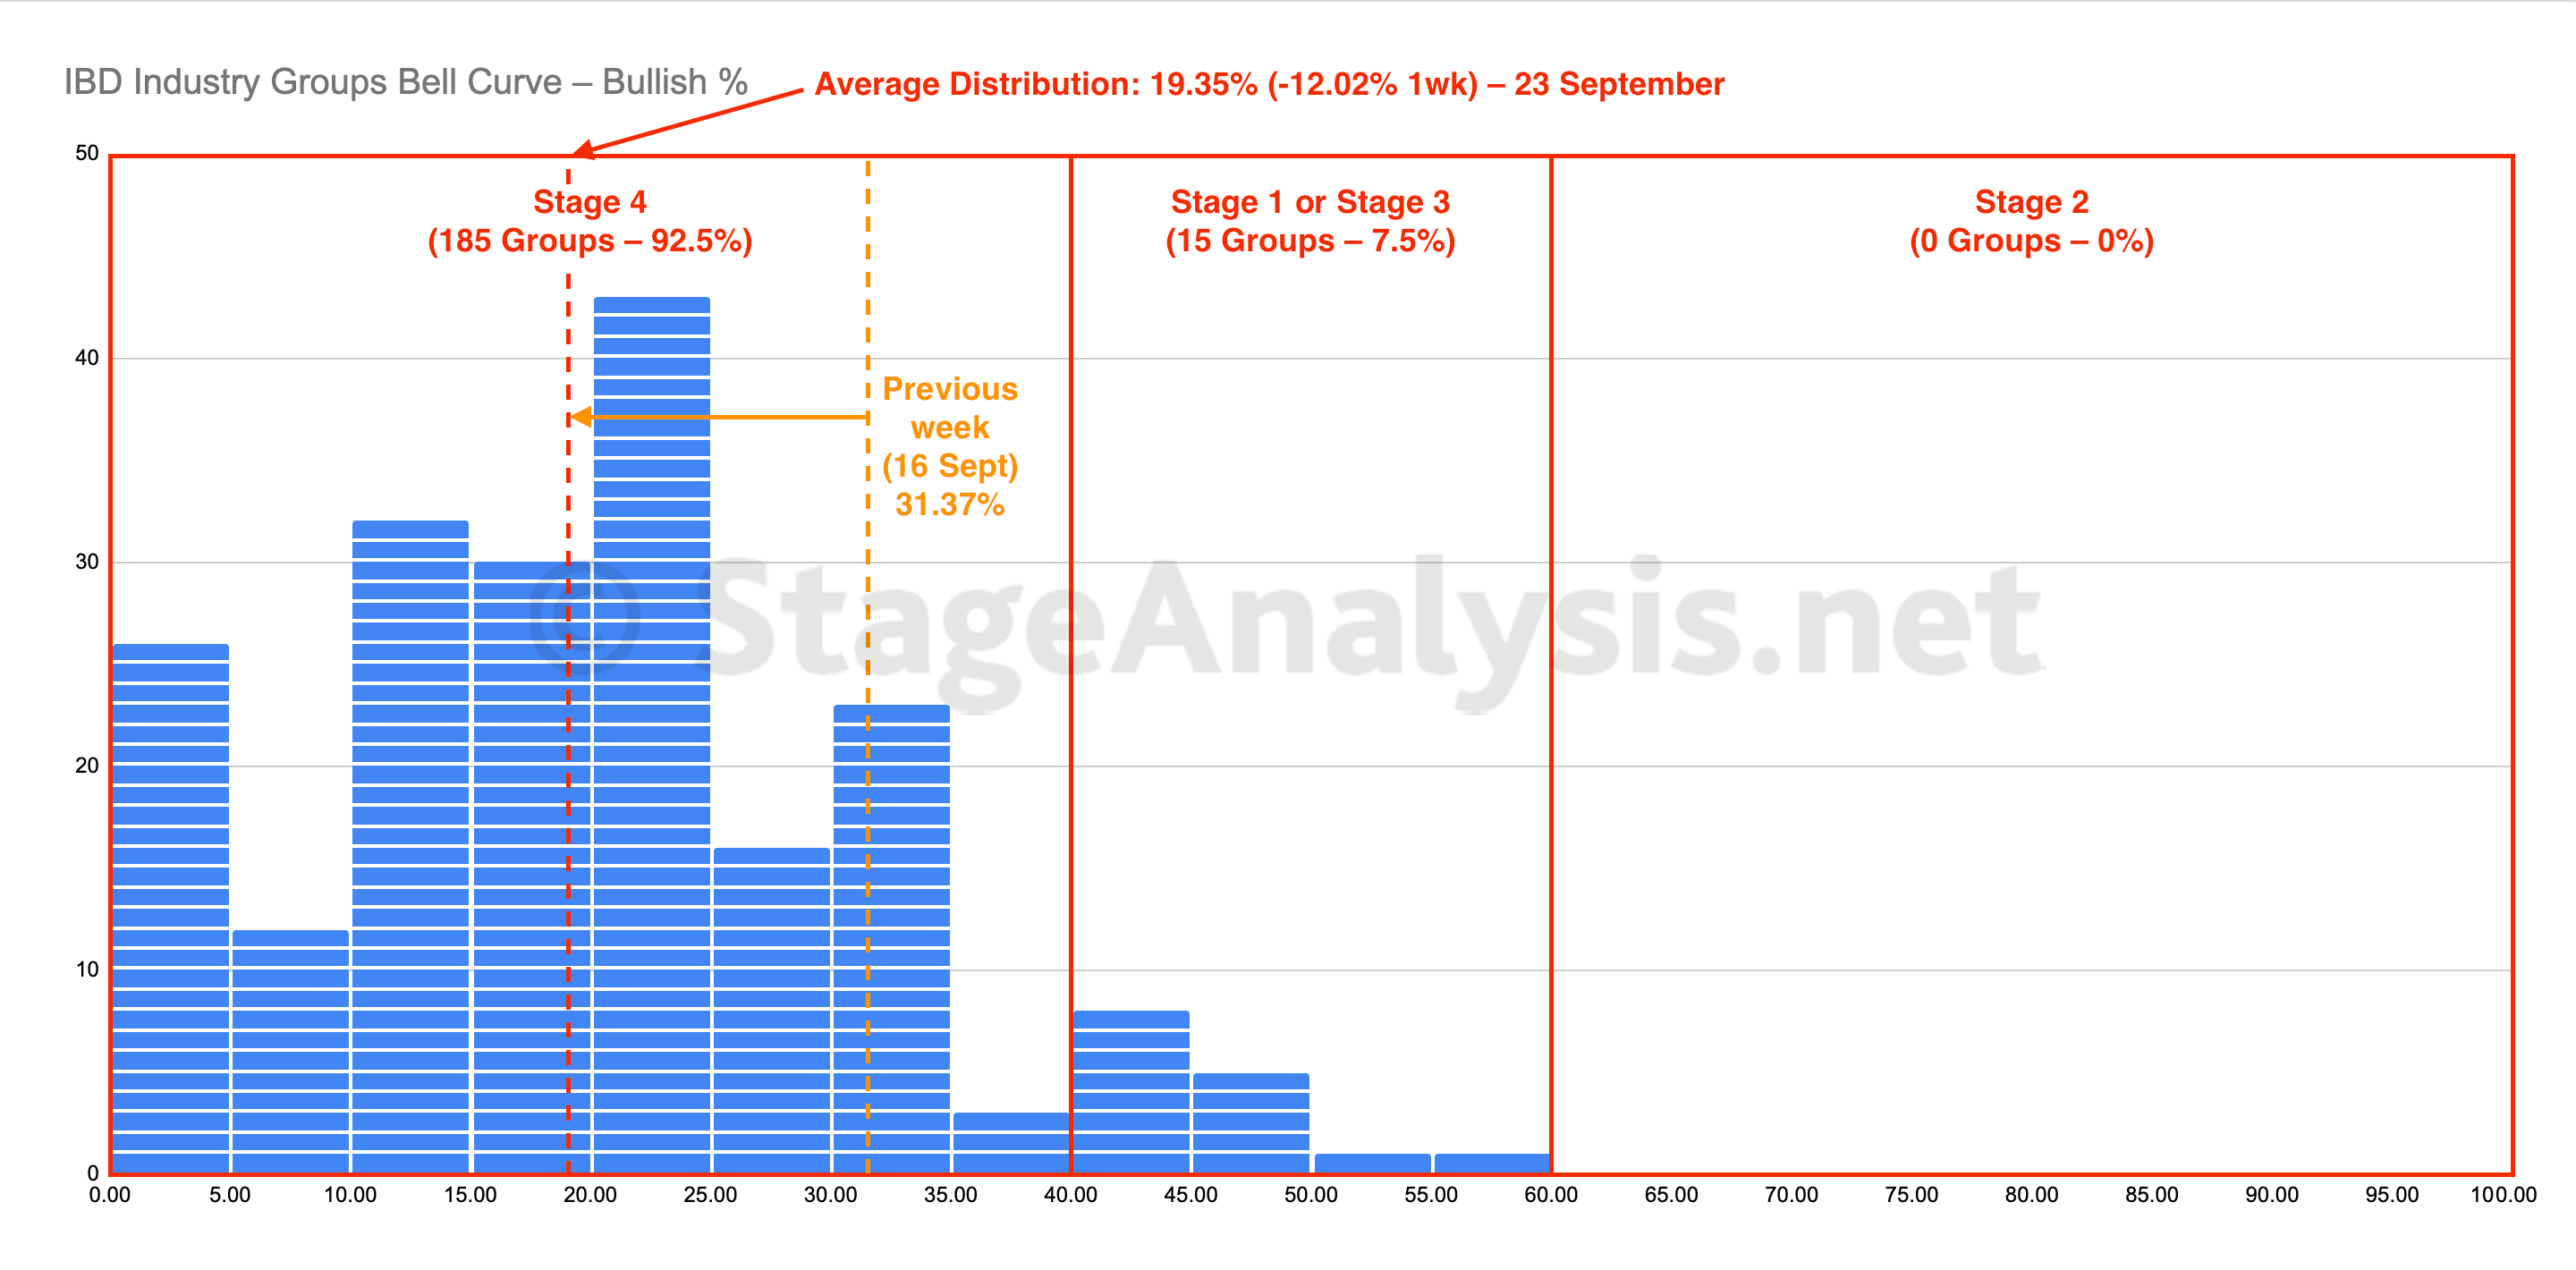
The IBD Industry Groups Bell Curve – Bullish Percent closed at a new low for 2022 with the average distribution at an extreme of 17.60%, which was a further decline of -1.75% on the previous week and has surpassed the 18.81% low set on June 17th...
Read More
Blog
02 October, 2022
IBD Industry Groups Bell Curve – Bullish Percent
02 October, 2022
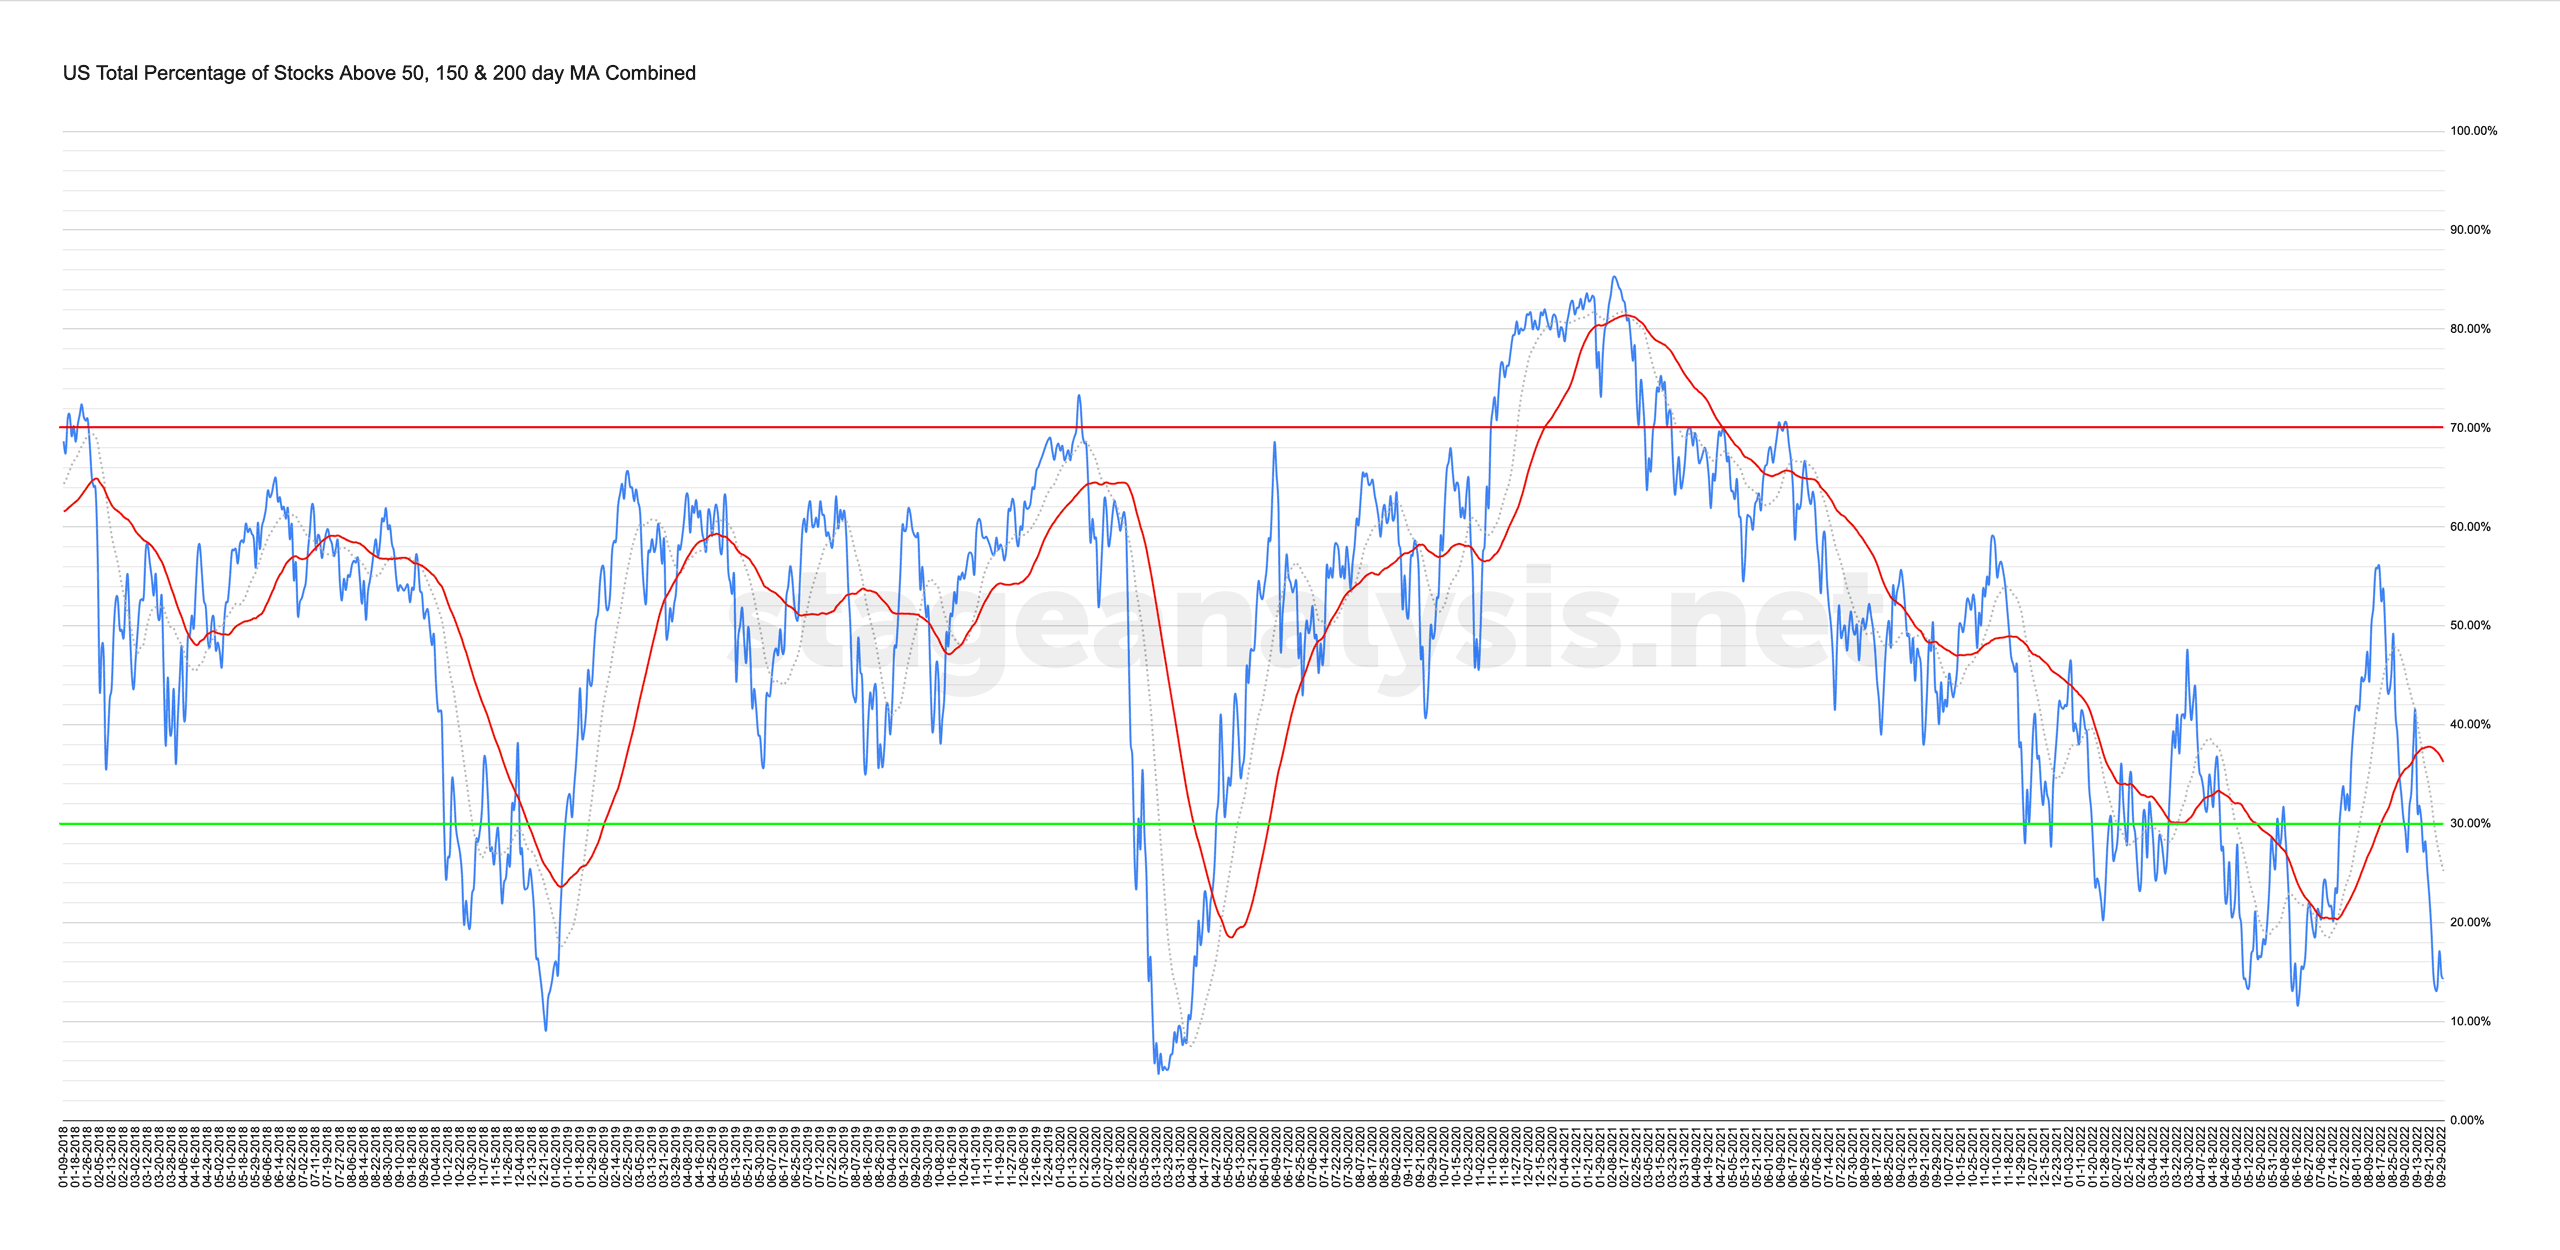
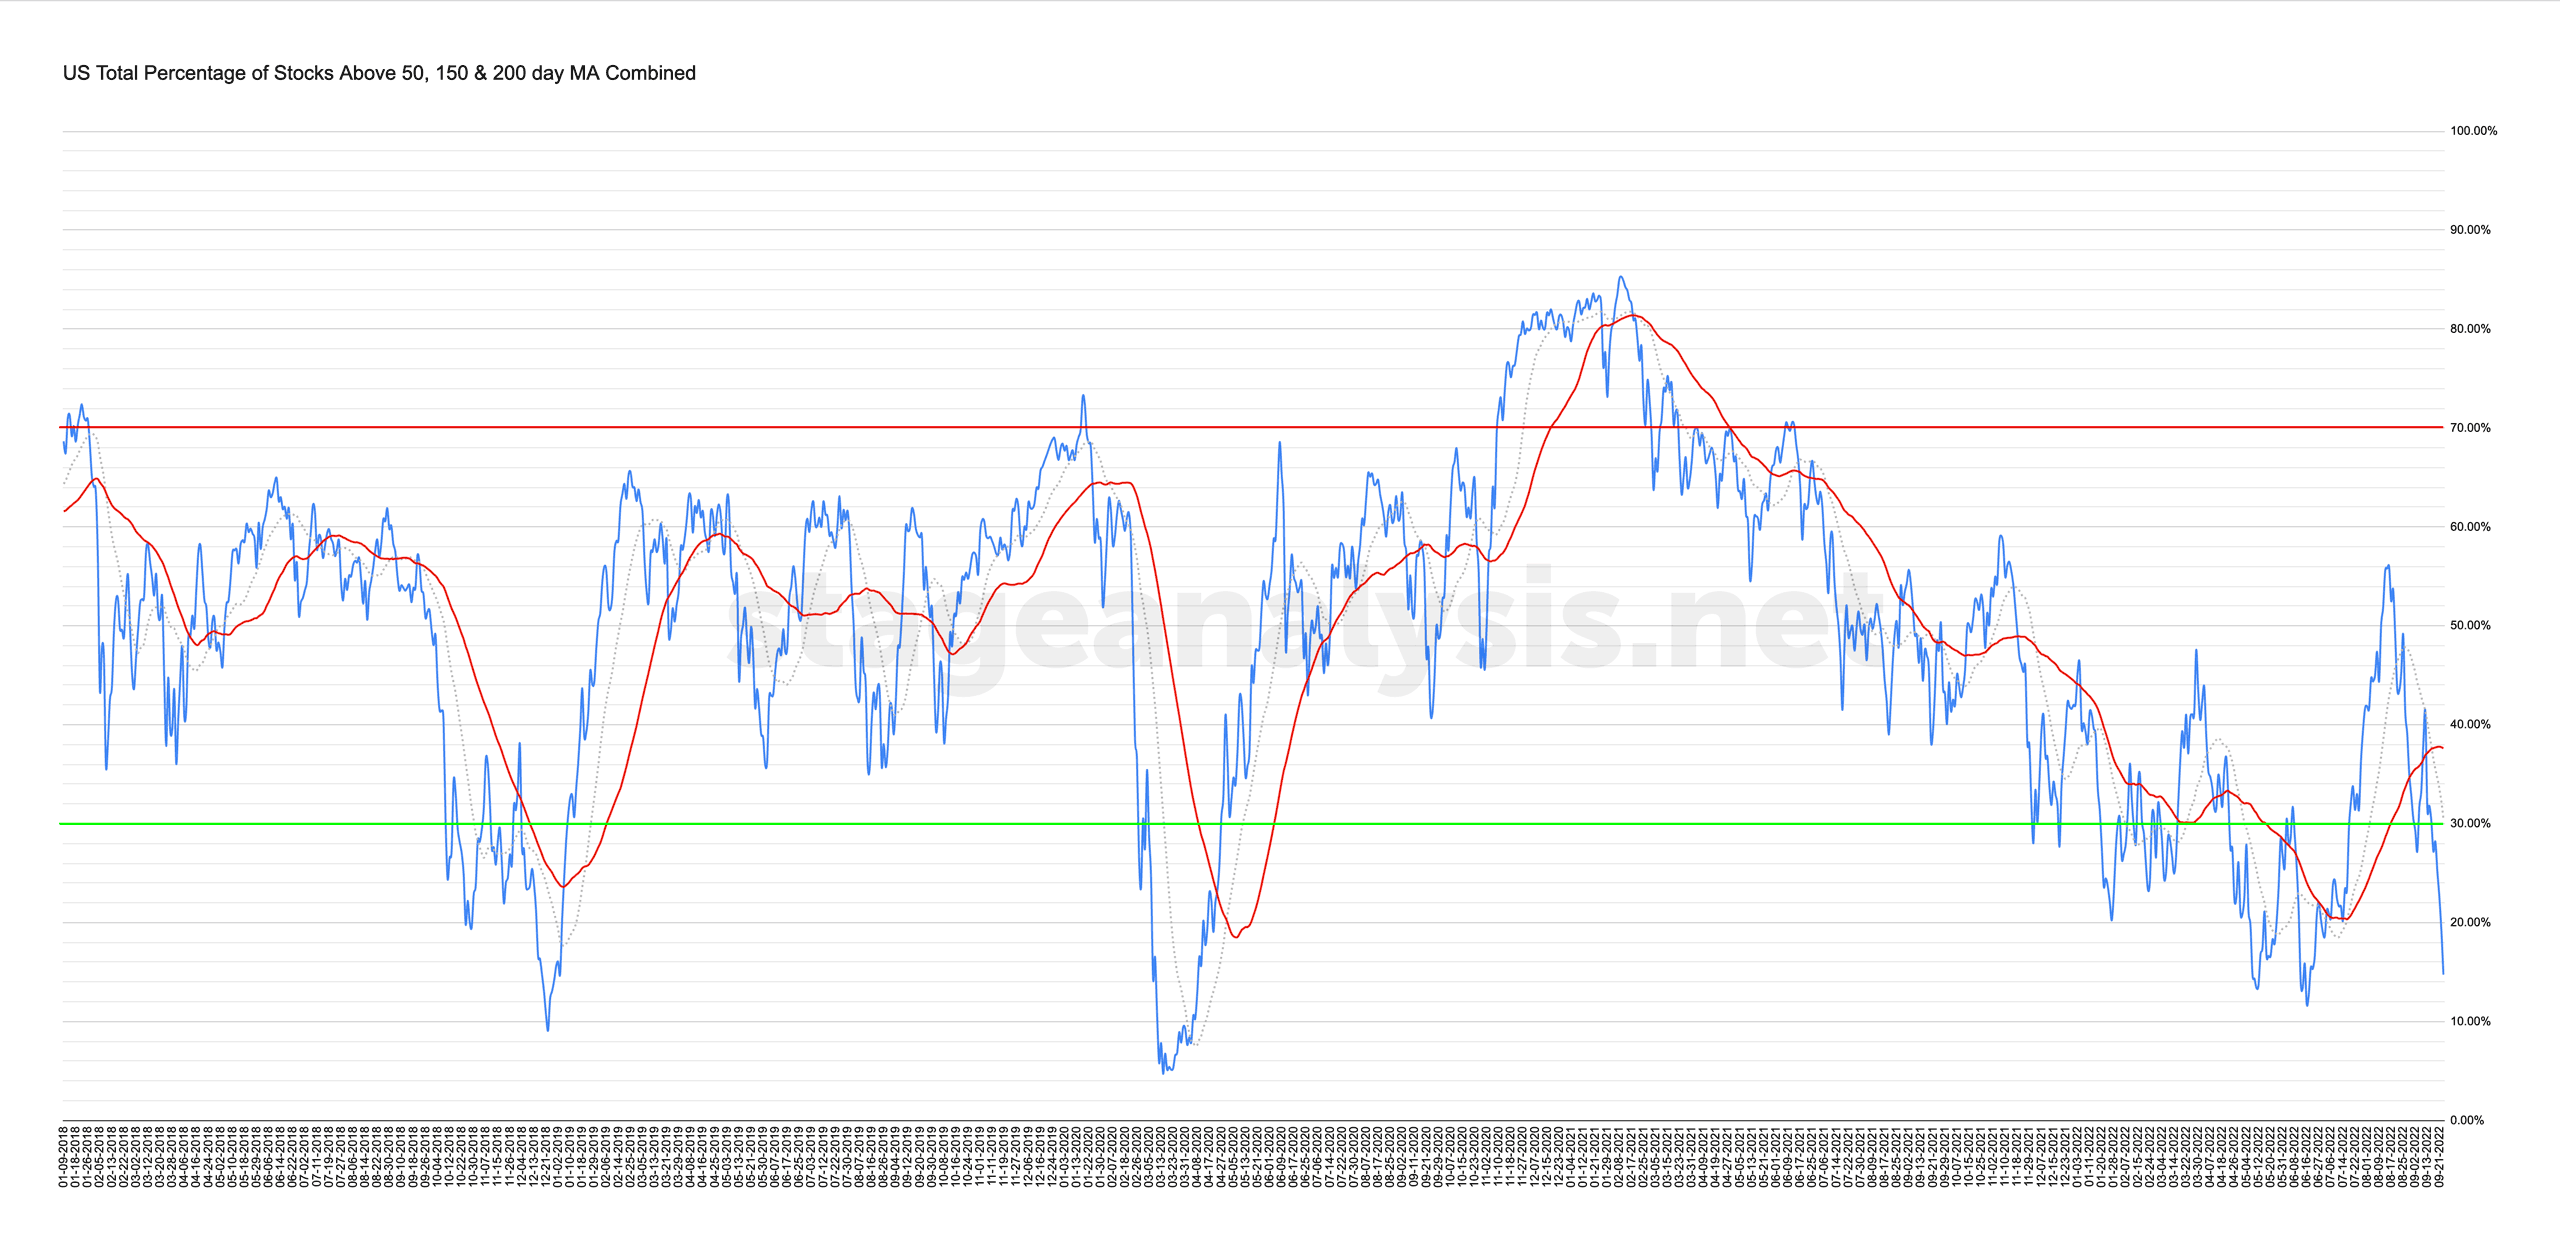
Market Breadth: Percentage of Stocks Above their 50 Day, 150 Day & 200 Day Moving Averages Combined
Custom Percentage of Stocks Above Their 50 Day, 150 Day & 200 Day Moving Averages Combined Market Breadth Charts for the Overall US Market, NYSE and Nasdaq for Market Timing and Strategy.
Read More
01 October, 2022
US Stocks Industry Groups Relative Strength Rankings
The purpose of the Relative Strength (RS) tables is to track the short, medium and long term RS changes of the individual groups to find the new leadership earlier than the crowd...
Read More
28 September, 2022
Stage Analysis Members Midweek Video – 28 September 2022 (59mins)
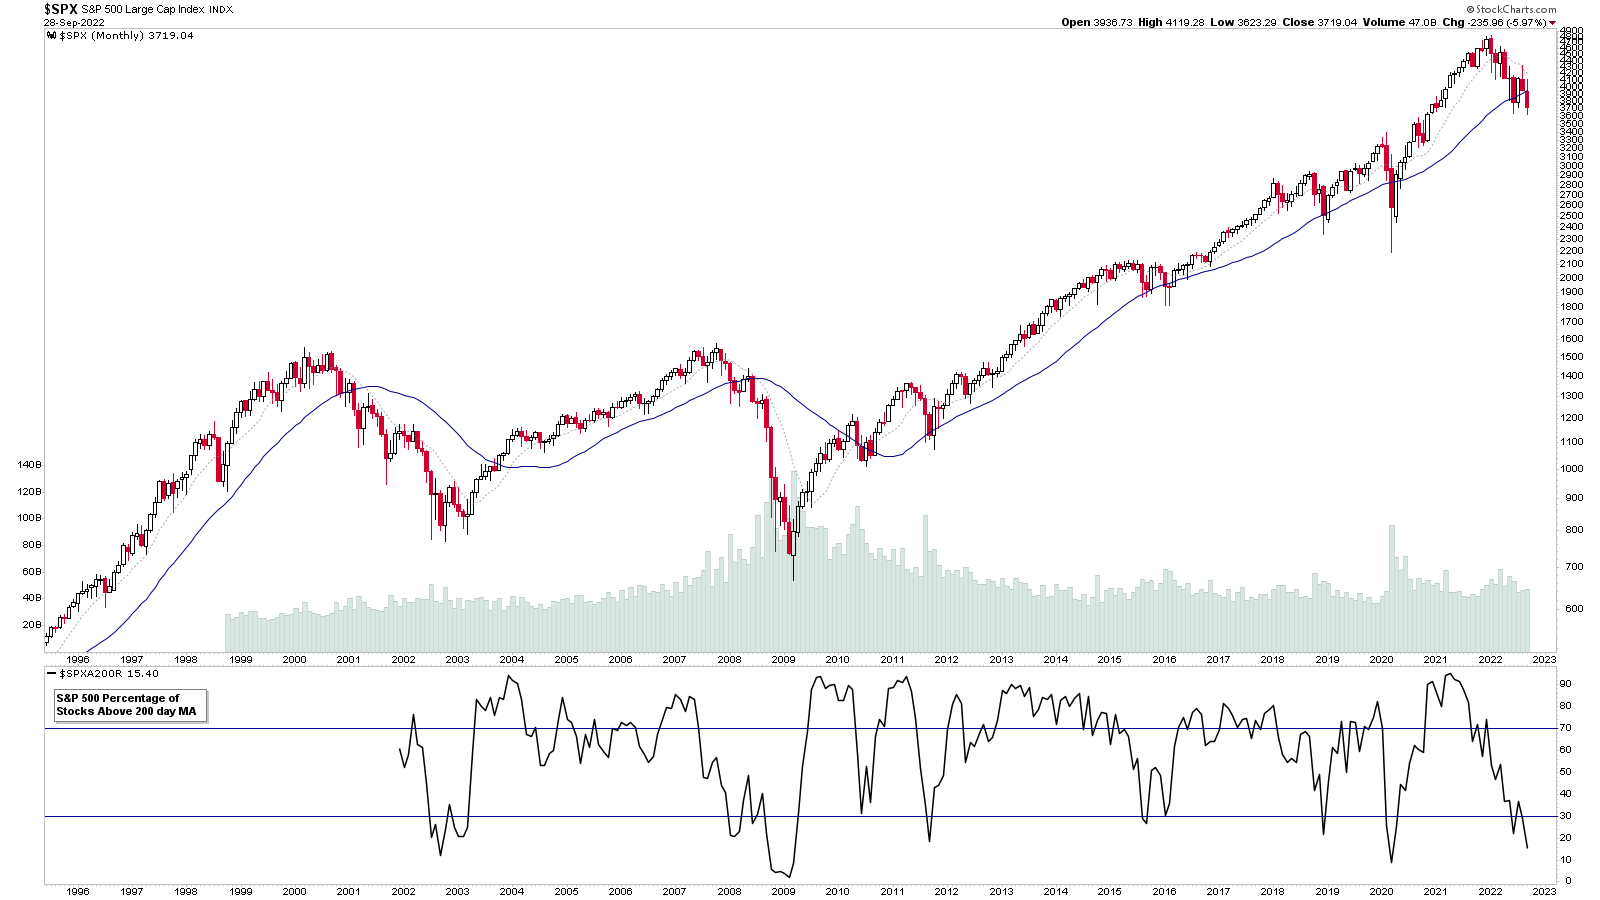
Midweek video reviewing the S&P 500 on multiple timeframes, including the 25 year monthly chart with breadth. Plus the VIX and Dollar Index and short-term market breadth. And finally going through some of the watchlist stocks and some additions from todays scans.
Read More
28 September, 2022
US Stocks Watchlist – 27 September 2022
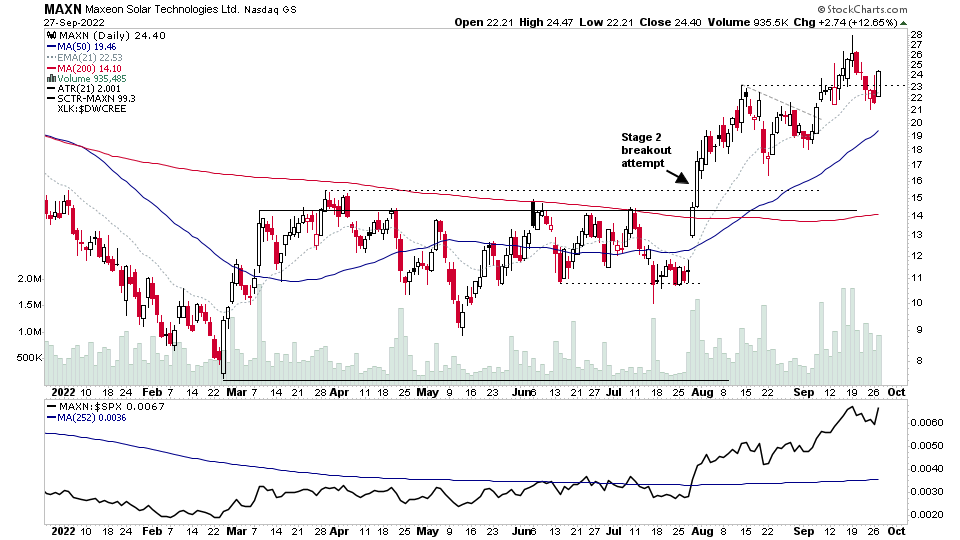
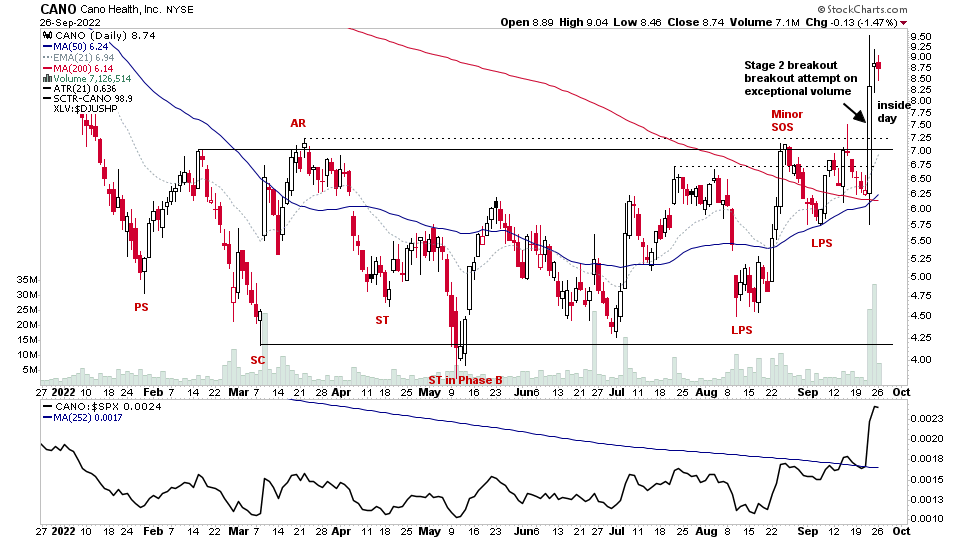
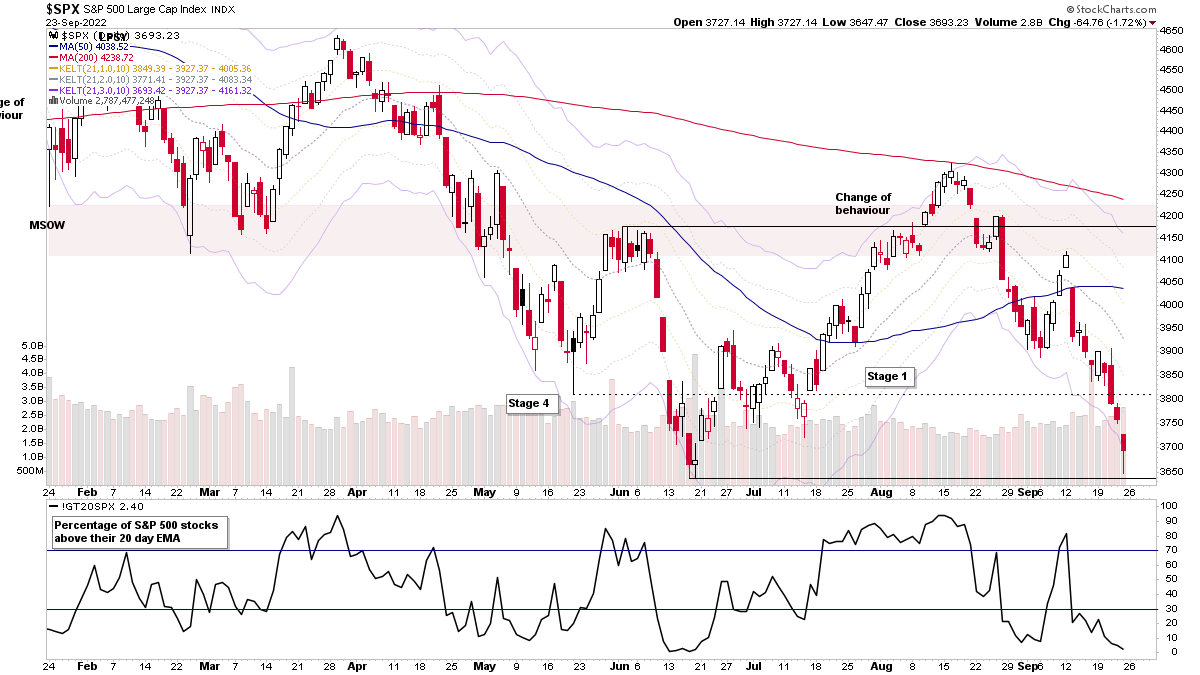
The market attempted to bounce today with a typical characteristic of bear markets of the higher open that then gets sold into. However, the market failed to close below the June low, and ended slightly off the bottom of the range, with many stocks in similar positions, with three days of consolidation around the lows of their bases...
Read More
26 September, 2022
US Stocks Watchlist – 26 September 2022
The daily scans remain muted with the current market environment, and with the market position where it is (see intraday S&P 500 chart above), there are numerous stocks testing the lower end of their recent ranges, and lots making Stage 4 continuation breakdown attempts...
Read More
25 September, 2022
Stage Analysis Members Weekend Video – 25 September 2022 (1hr 5mins)
The regular members weekend video discussing the market, industry groups, market breadth and individual stocks from the watchlist in more detail...
Read More
25 September, 2022
Springs or Continuation Breakdowns – US Stocks Watchlist – 25 September 2022
A different kind of watchlist this weekend, with the market testing the lows of the recent range that's formed over the last 4 months or so. There are lots stocks on the borderline between Stage 1 base structures and potentially continuing lower into Stage 4 once more...
Read More
24 September, 2022
IBD Industry Groups Bell Curve – Bullish Percent
The decline in the IBD Industry Groups Bell Curve – Bullish Percent average distribution continued this week, and finished the week at an extreme of 19.35%, which is decline of -12.02%, and the second lowest reading of the year. With a massive 185 (92.5%) of the IBD industry groups in the Stage 4 range, and only 15 (7.5%) groups in Stages 1 or 3, and zero (0%) groups in the Stage 2 range...
Read More
24 September, 2022
Market Breadth: Percentage of Stocks Above their 50 Day, 150 Day & 200 Day Moving Averages Combined
Custom Percentage of Stocks Above Their 50 Day, 150 Day & 200 Day Moving Averages Combined Market Breadth Charts for the Overall US Market, NYSE and Nasdaq for Market Timing and Strategy.
Read More

