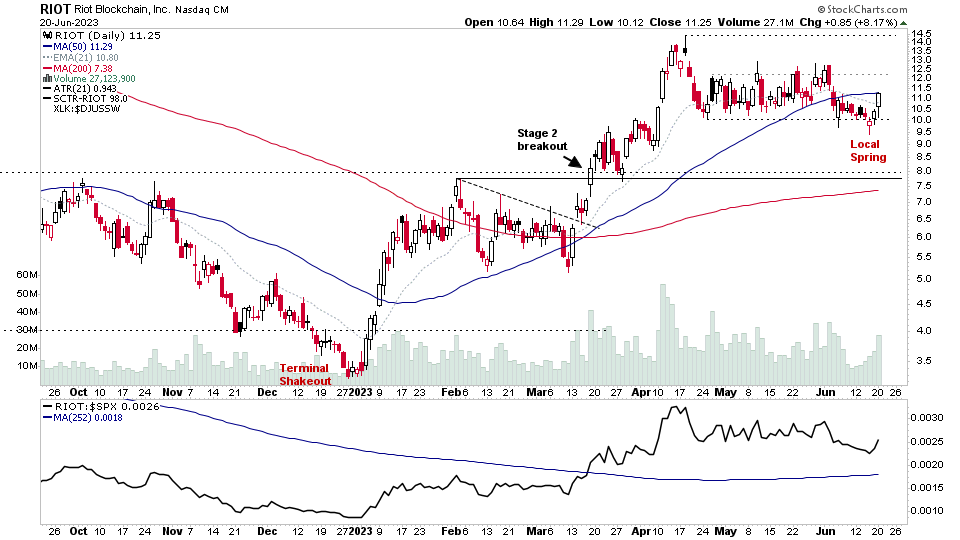
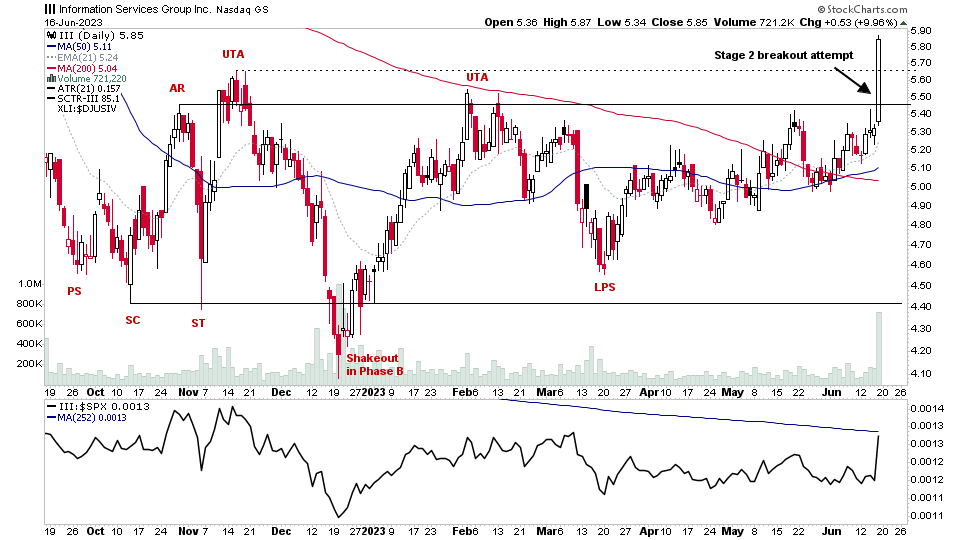
There were 34 stocks highlighted from the US stocks watchlist scans today...
Read More
Blog
20 June, 2023
US Stocks Watchlist – 20 June 2023
19 June, 2023
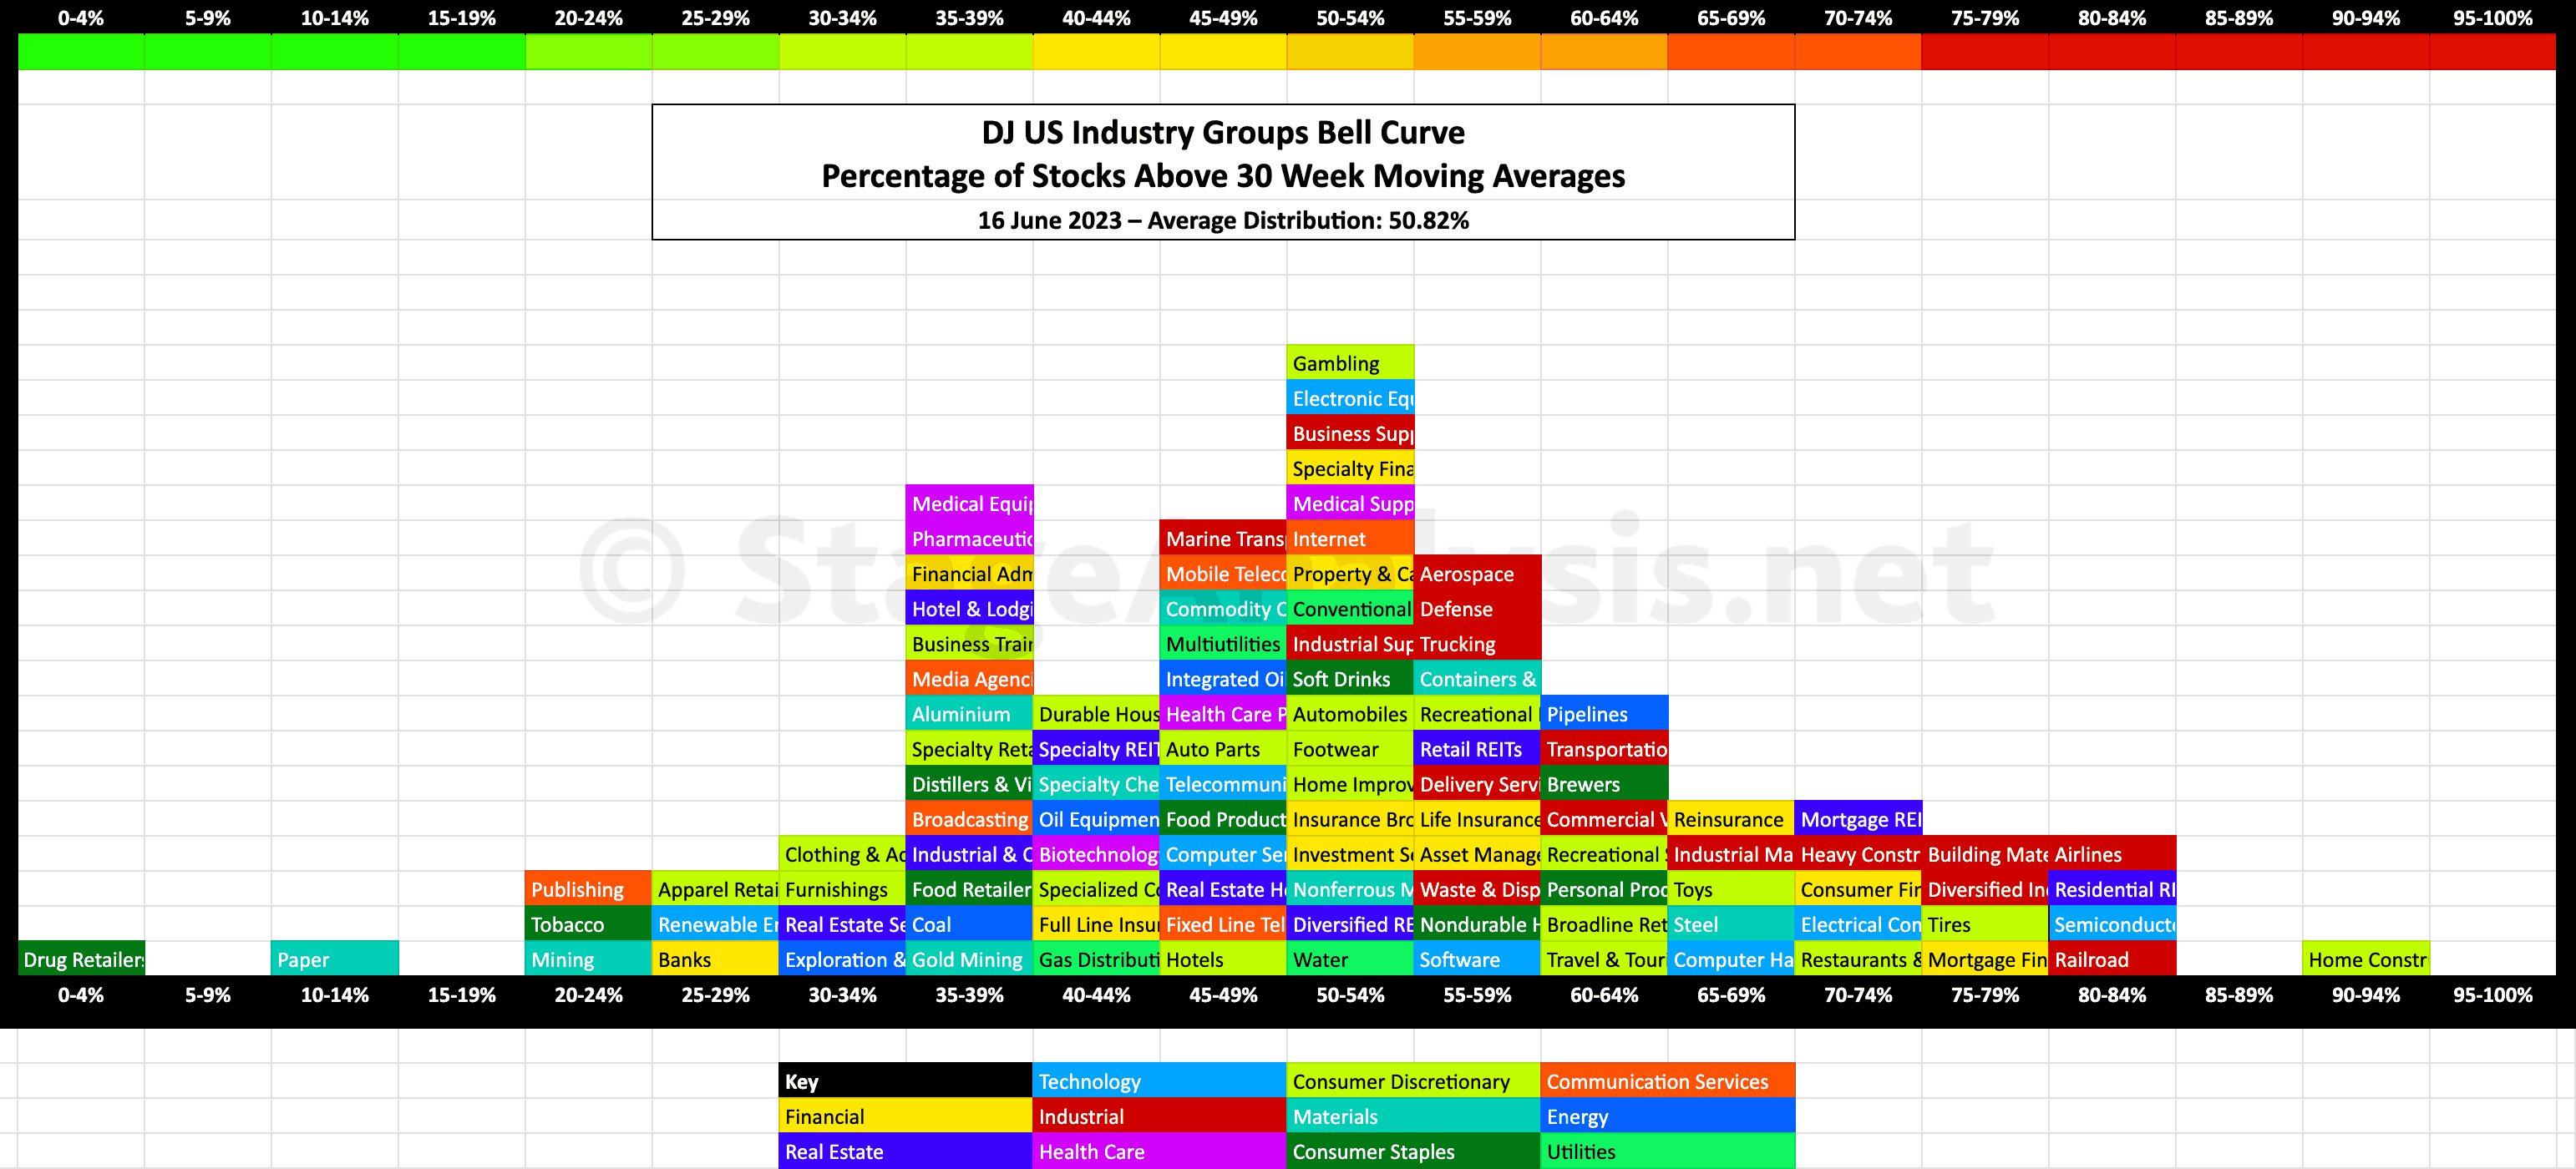
US Industry Groups Bell Curve – Exclusive to StageAnalysis.net
Exclusive graphic of the 104 Dow Jones Industry Groups showing the Percentage of Stocks Above 30 week MA in each group visualised as a Bell Curve chart...
Read More
18 June, 2023
Stage Analysis Members Video – 18 June 2023 (1hr 29mins)
This weeks Stage Analysis weekend video features the regular members content of the the Major US Indexes Update, Futures SATA Charts, Industry Groups RS Rankings, IBD Industry Group Bell Curve, Market Breadth Update to help to determine the weight of evidence, Stage 2 breakout attempts on volume and finally the US Watchlist Stocks from the recent posts with detailed live markups on multiple timeframes.
Read More
18 June, 2023
US Stocks Watchlist – 18 June 2023
There were 20 stocks highlighted from the US stocks watchlist scans today...
Read More
17 June, 2023
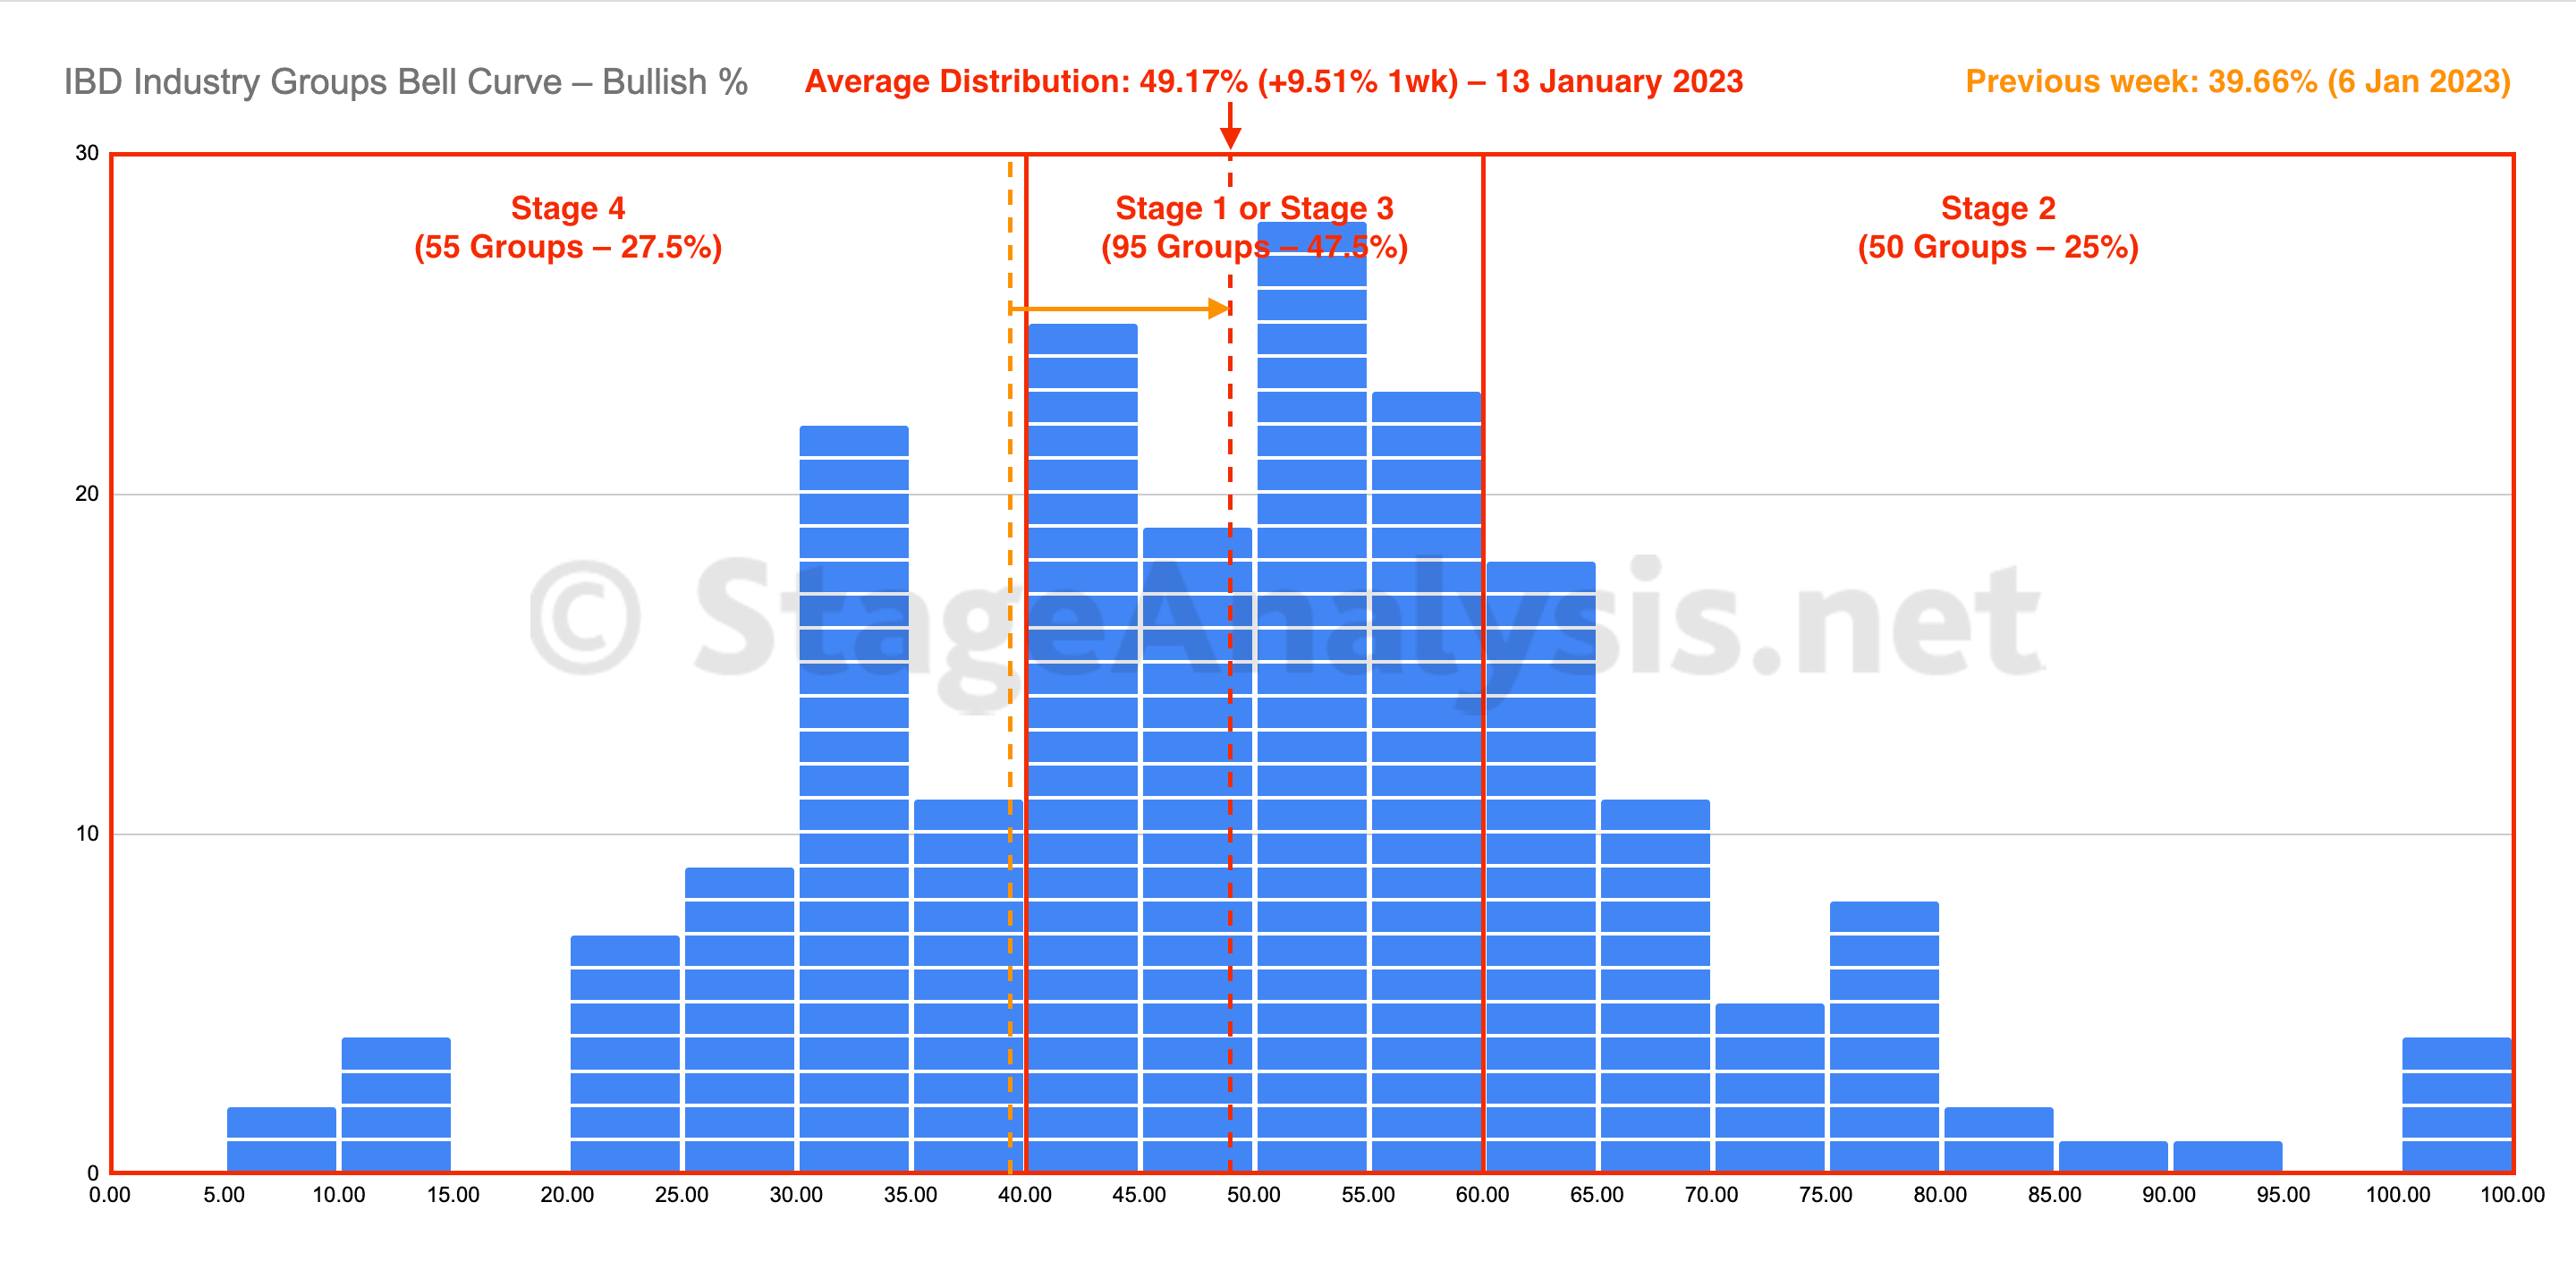
IBD Industry Groups Bell Curve – Bullish Percent
The IBD Industry Groups Bell Curve – Bullish Percent shows the few hundred industry groups plotted as a histogram chart and represents the percentage of stocks in each group that are on a point & figure (P&F) buy signal. This information provides a snapshot of the overall market health in a unique way, and is particularly useful for both market timing strategies and as a tool in aiding with the Stage Analysis methods "Forest to the Trees" approach, where we look for developing group themes...
Read More
17 June, 2023
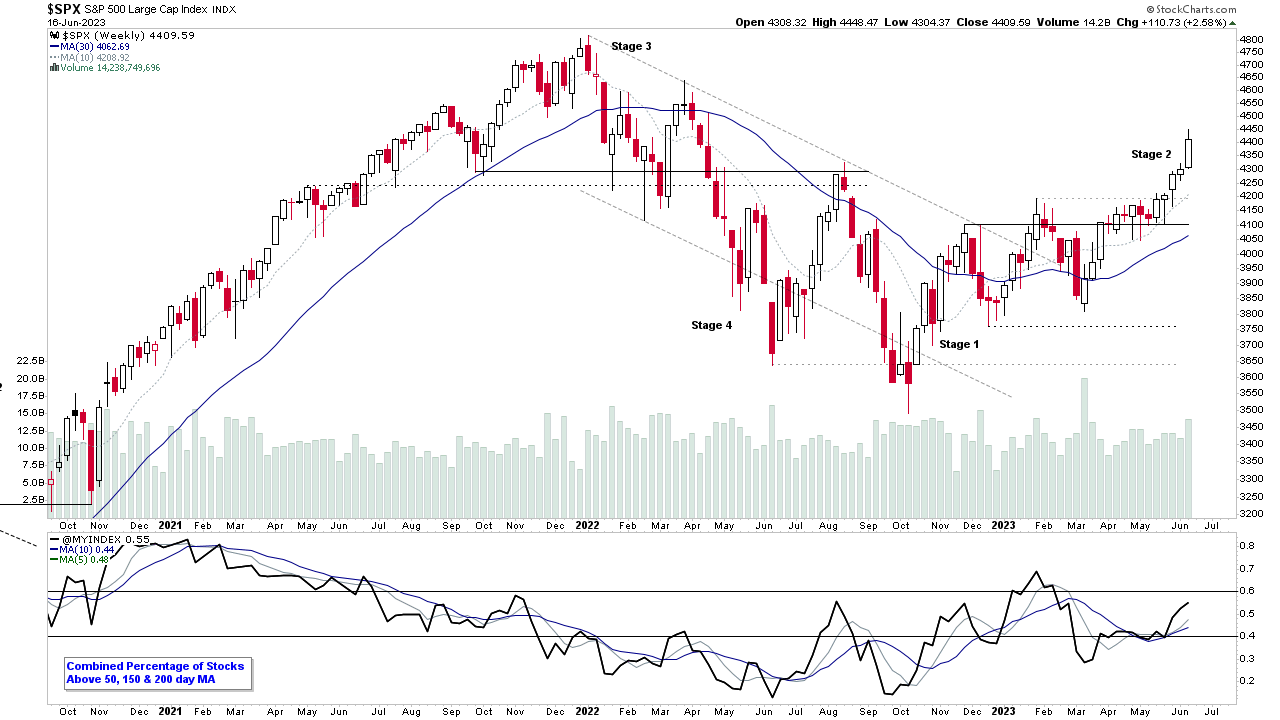
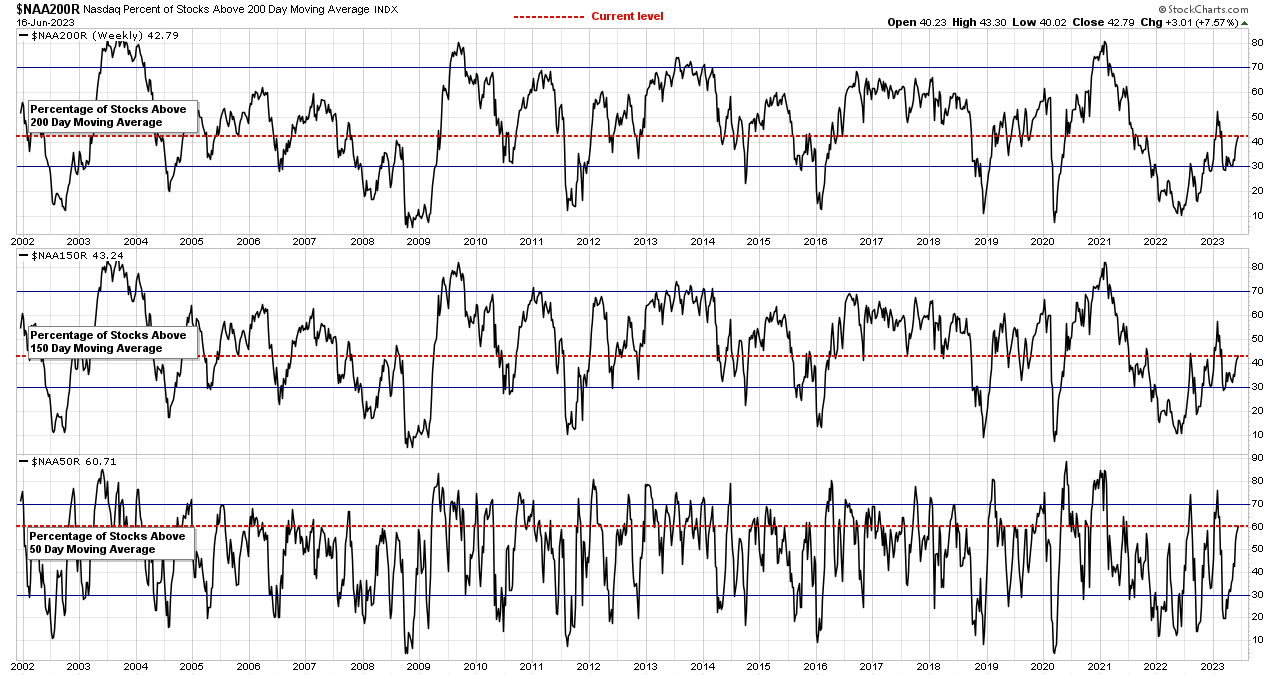
Market Breadth: Percentage of Stocks Above their 50 Day, 150 Day & 200 Day Moving Averages Combined
Custom Percentage of Stocks Above Their 50 Day, 150 Day & 200 Day Moving Averages Combined Market Breadth Charts for the Overall US Market, NYSE and Nasdaq for Market Timing and Strategy.
Read More
16 June, 2023
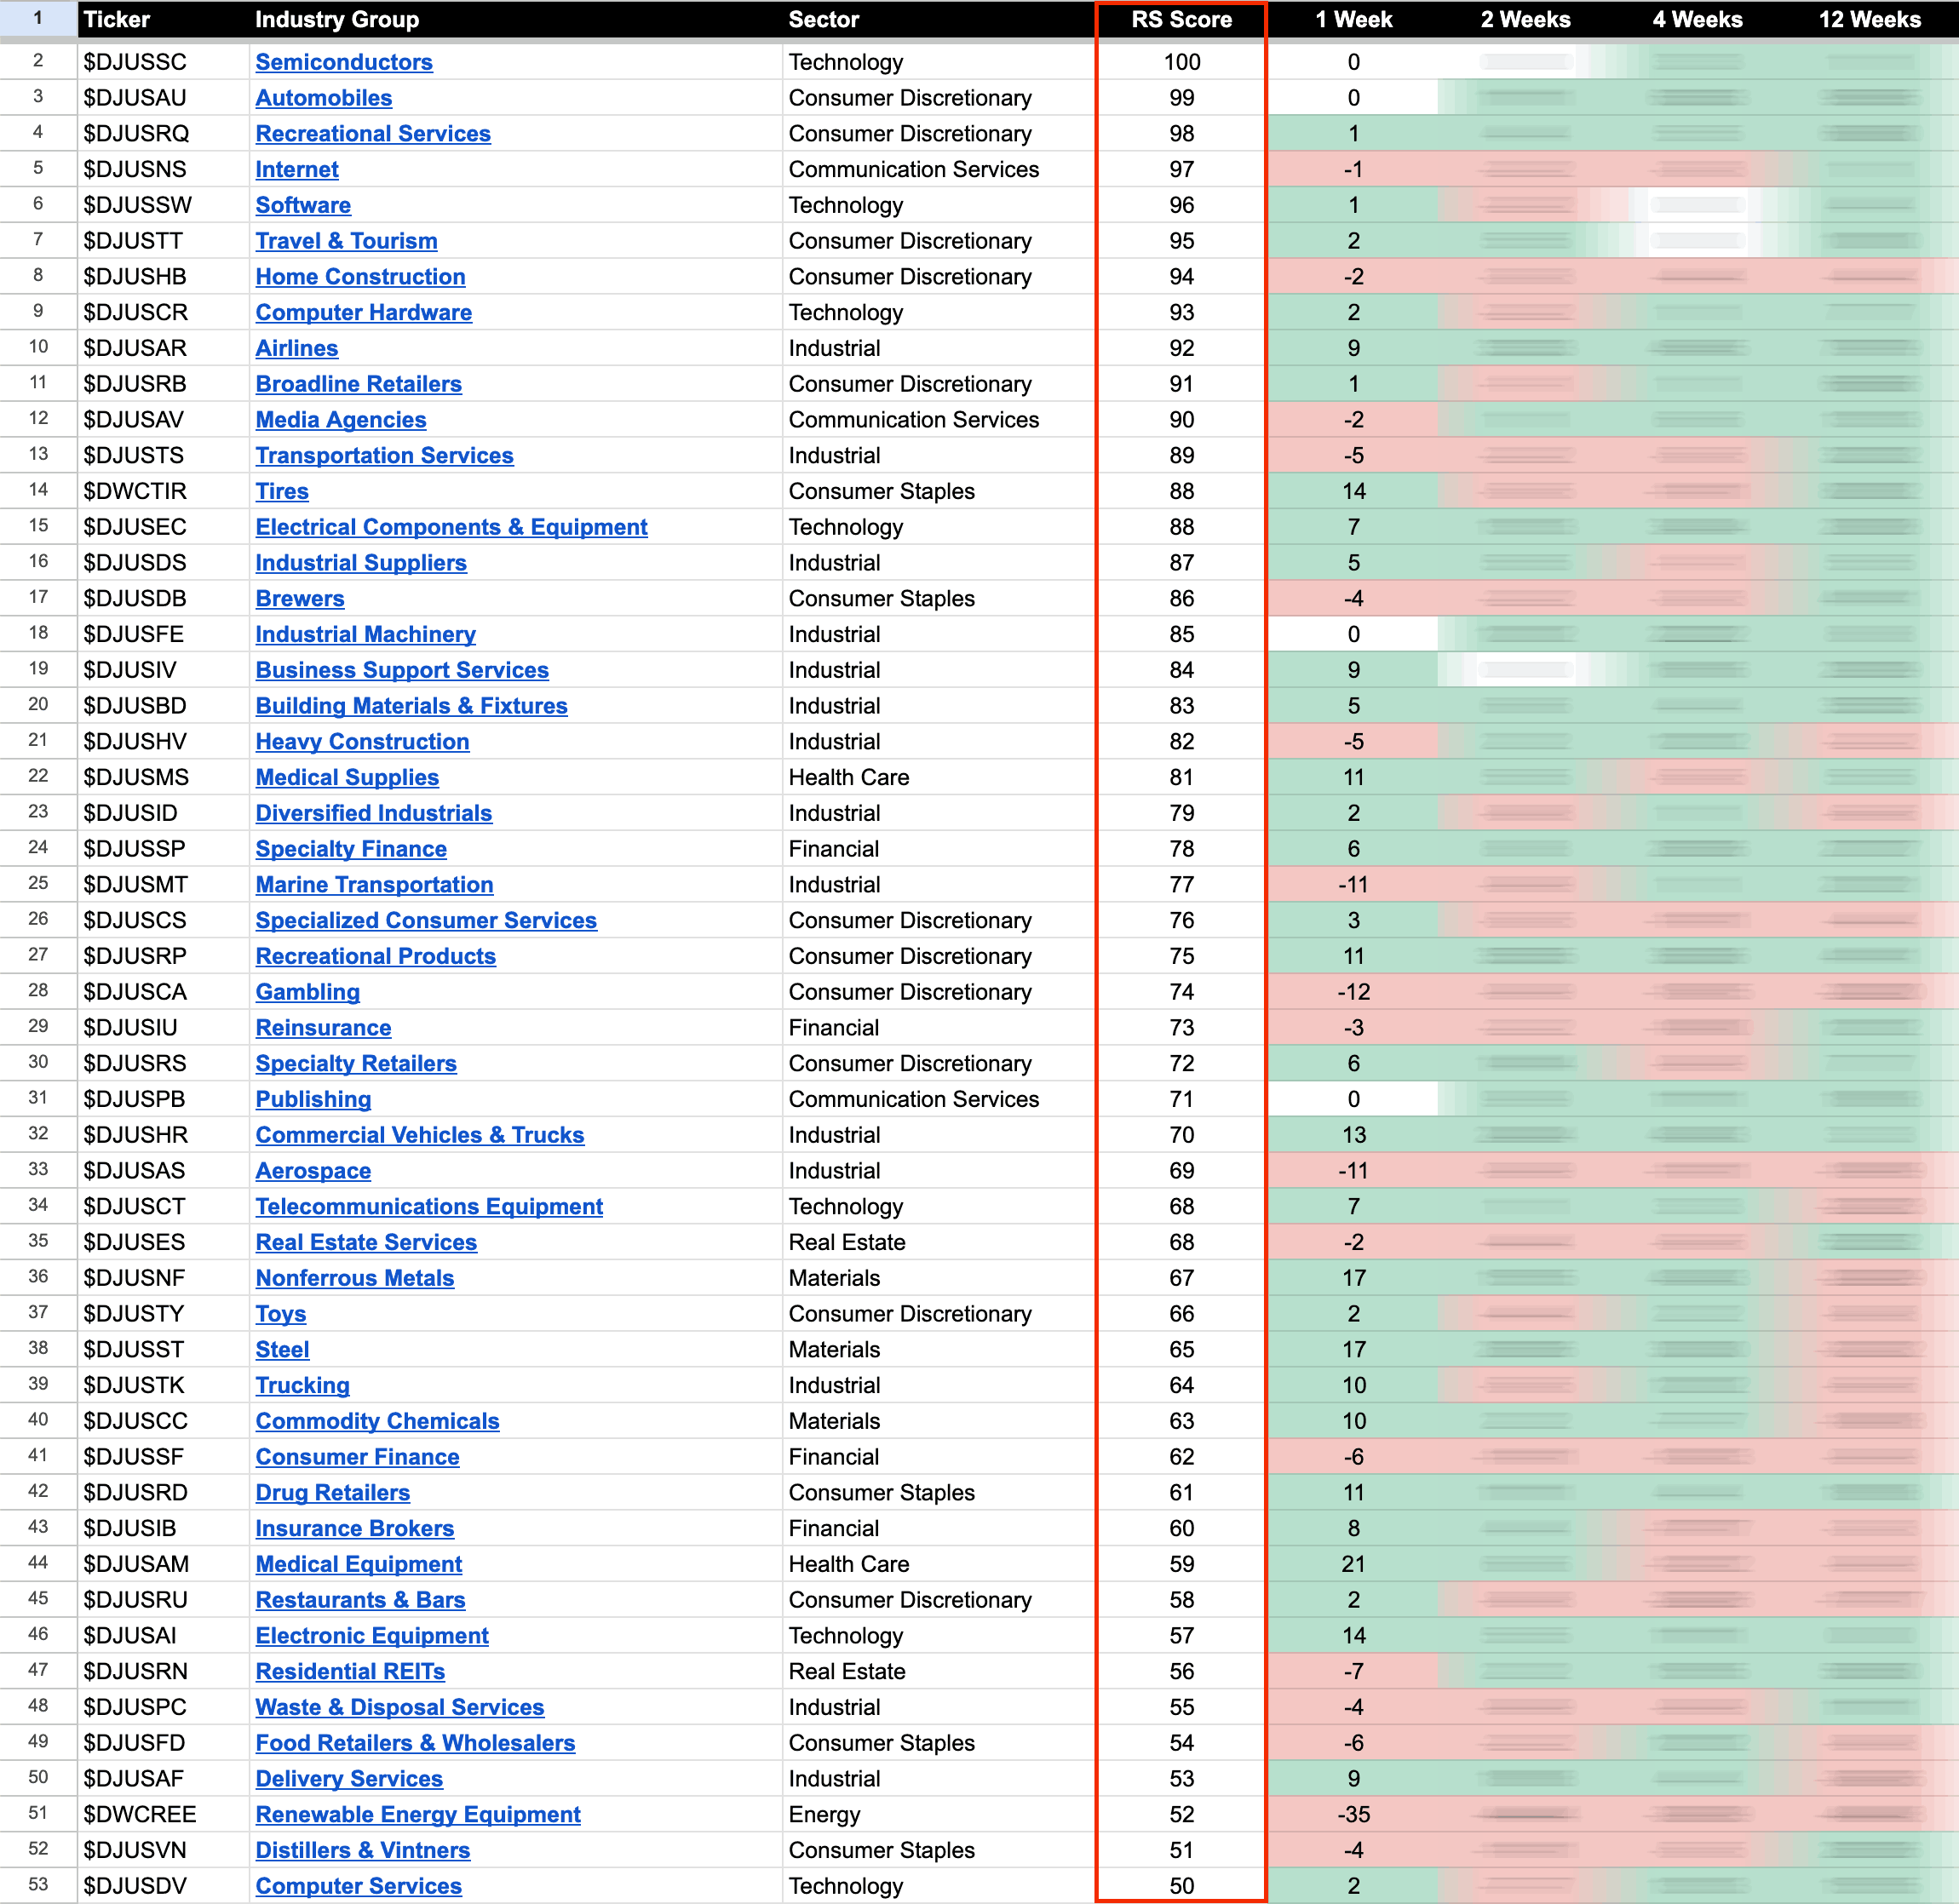
US Stocks Industry Groups Relative Strength Rankings
The purpose of the Relative Strength (RS) tables is to track the short, medium and long term RS changes of the individual groups to find the new leadership earlier than the crowd...
Read More
15 June, 2023
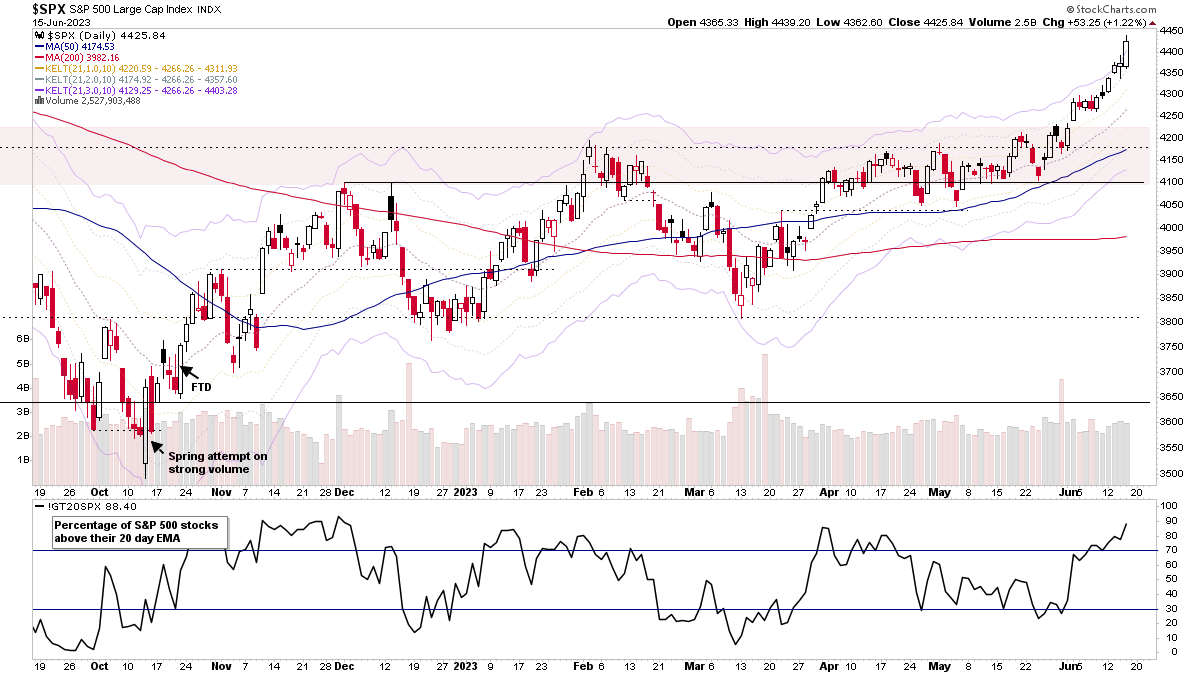
S&P 500 52 Week Highs & the US Stocks Watchlist – 15 June 2023
A bigger watchlist again as the amount of groups making new 52 week highs continues to expand, as the market rally broadens into the NYSE stocks. So there continues to be more stocks from Industrials, Materials, Consumer Discretionary etc...
Read More
14 June, 2023
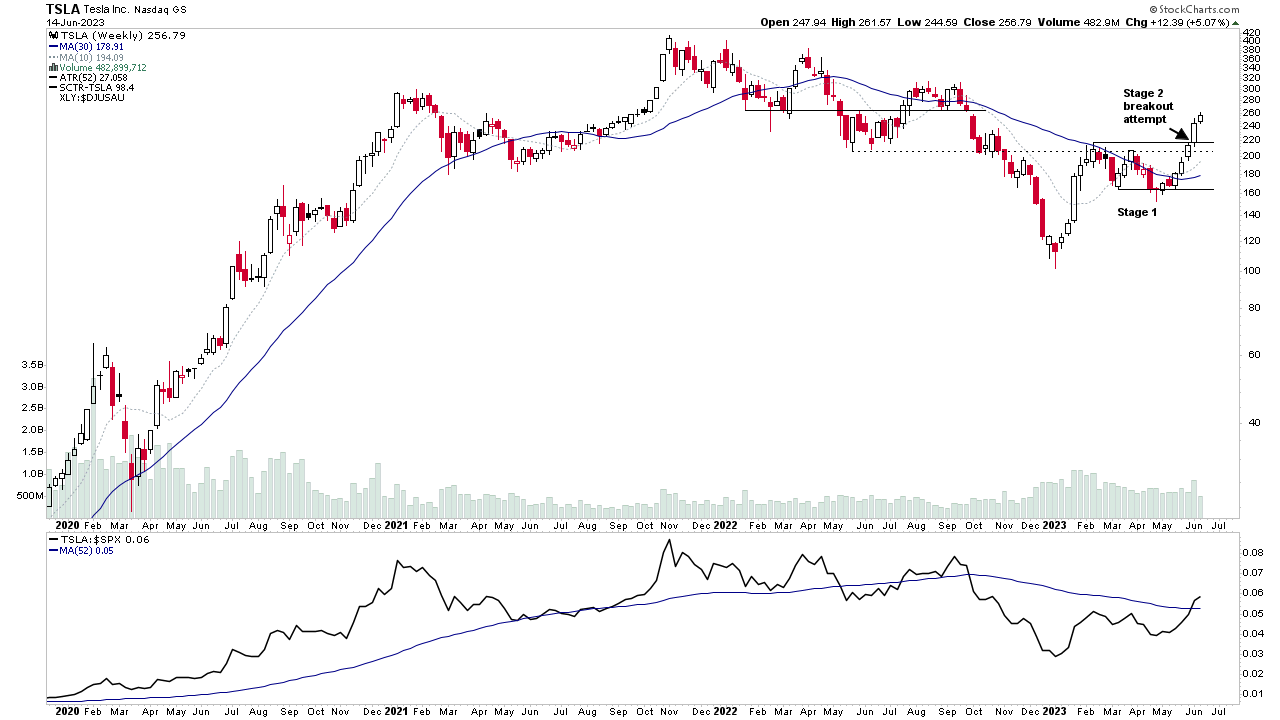
Group Focus Video: Automobiles Moving into Stage 2 – 14 June 2023 (1hr)
This weeks members midweek video is a special group focus on the Automobiles Group, which has moving strongly up the relative strength rankings over the last 3 months, and is currently in 2nd place overall, with multiple stocks in the group starting to breakout into early Stage 2...
Read More
13 June, 2023
NYSE Breadth Expansion and the US Stocks Watchlist – 13 June 2023
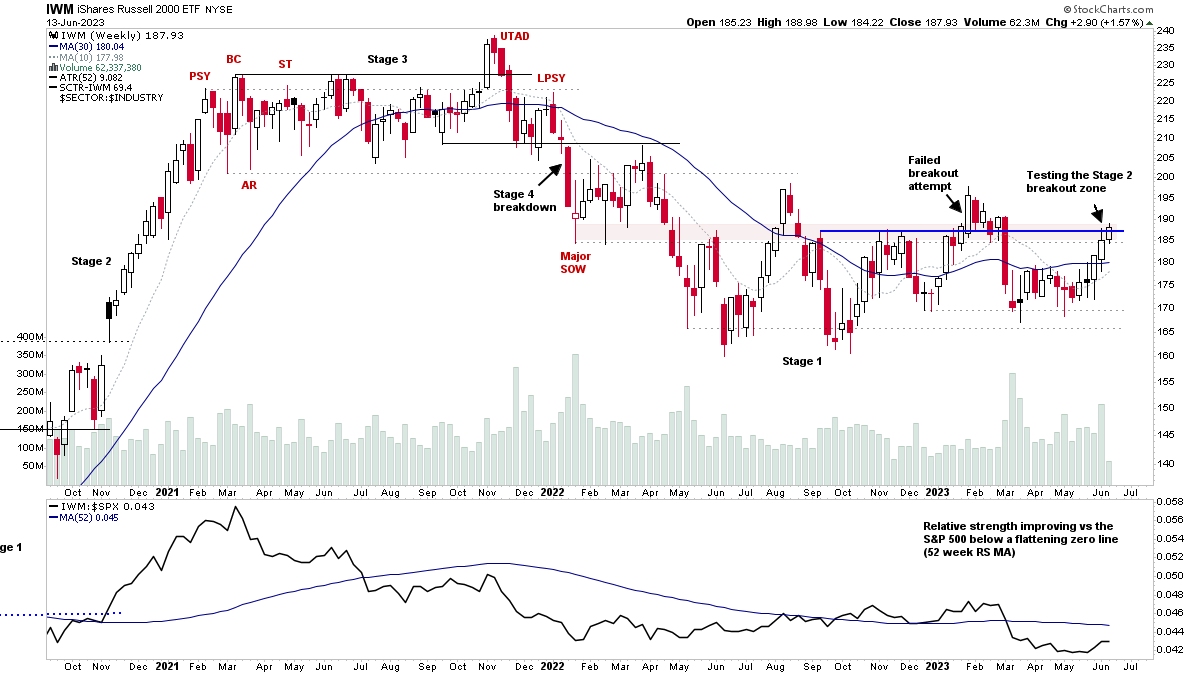
The Russell 2000 Small Caps is once again testing resistance, and attempting to breakout into Stage 2. But as yet hasn't been able to push through and overcome the resistance from the March significant bar, from when the banking crisis erupted, and so remains in late Stage 1 currently.
Read More

