The Stage Analysis Technical Attributes (SATA) score is our proprietary indicator that helps to identify the four stages from Stan Weinstein's Stage Analysis method, using a scoring system from 0 to 10 that rates ten of the key technical characteristics that we look for when analysing the weekly charts.
Read More

Blog
13 November, 2023
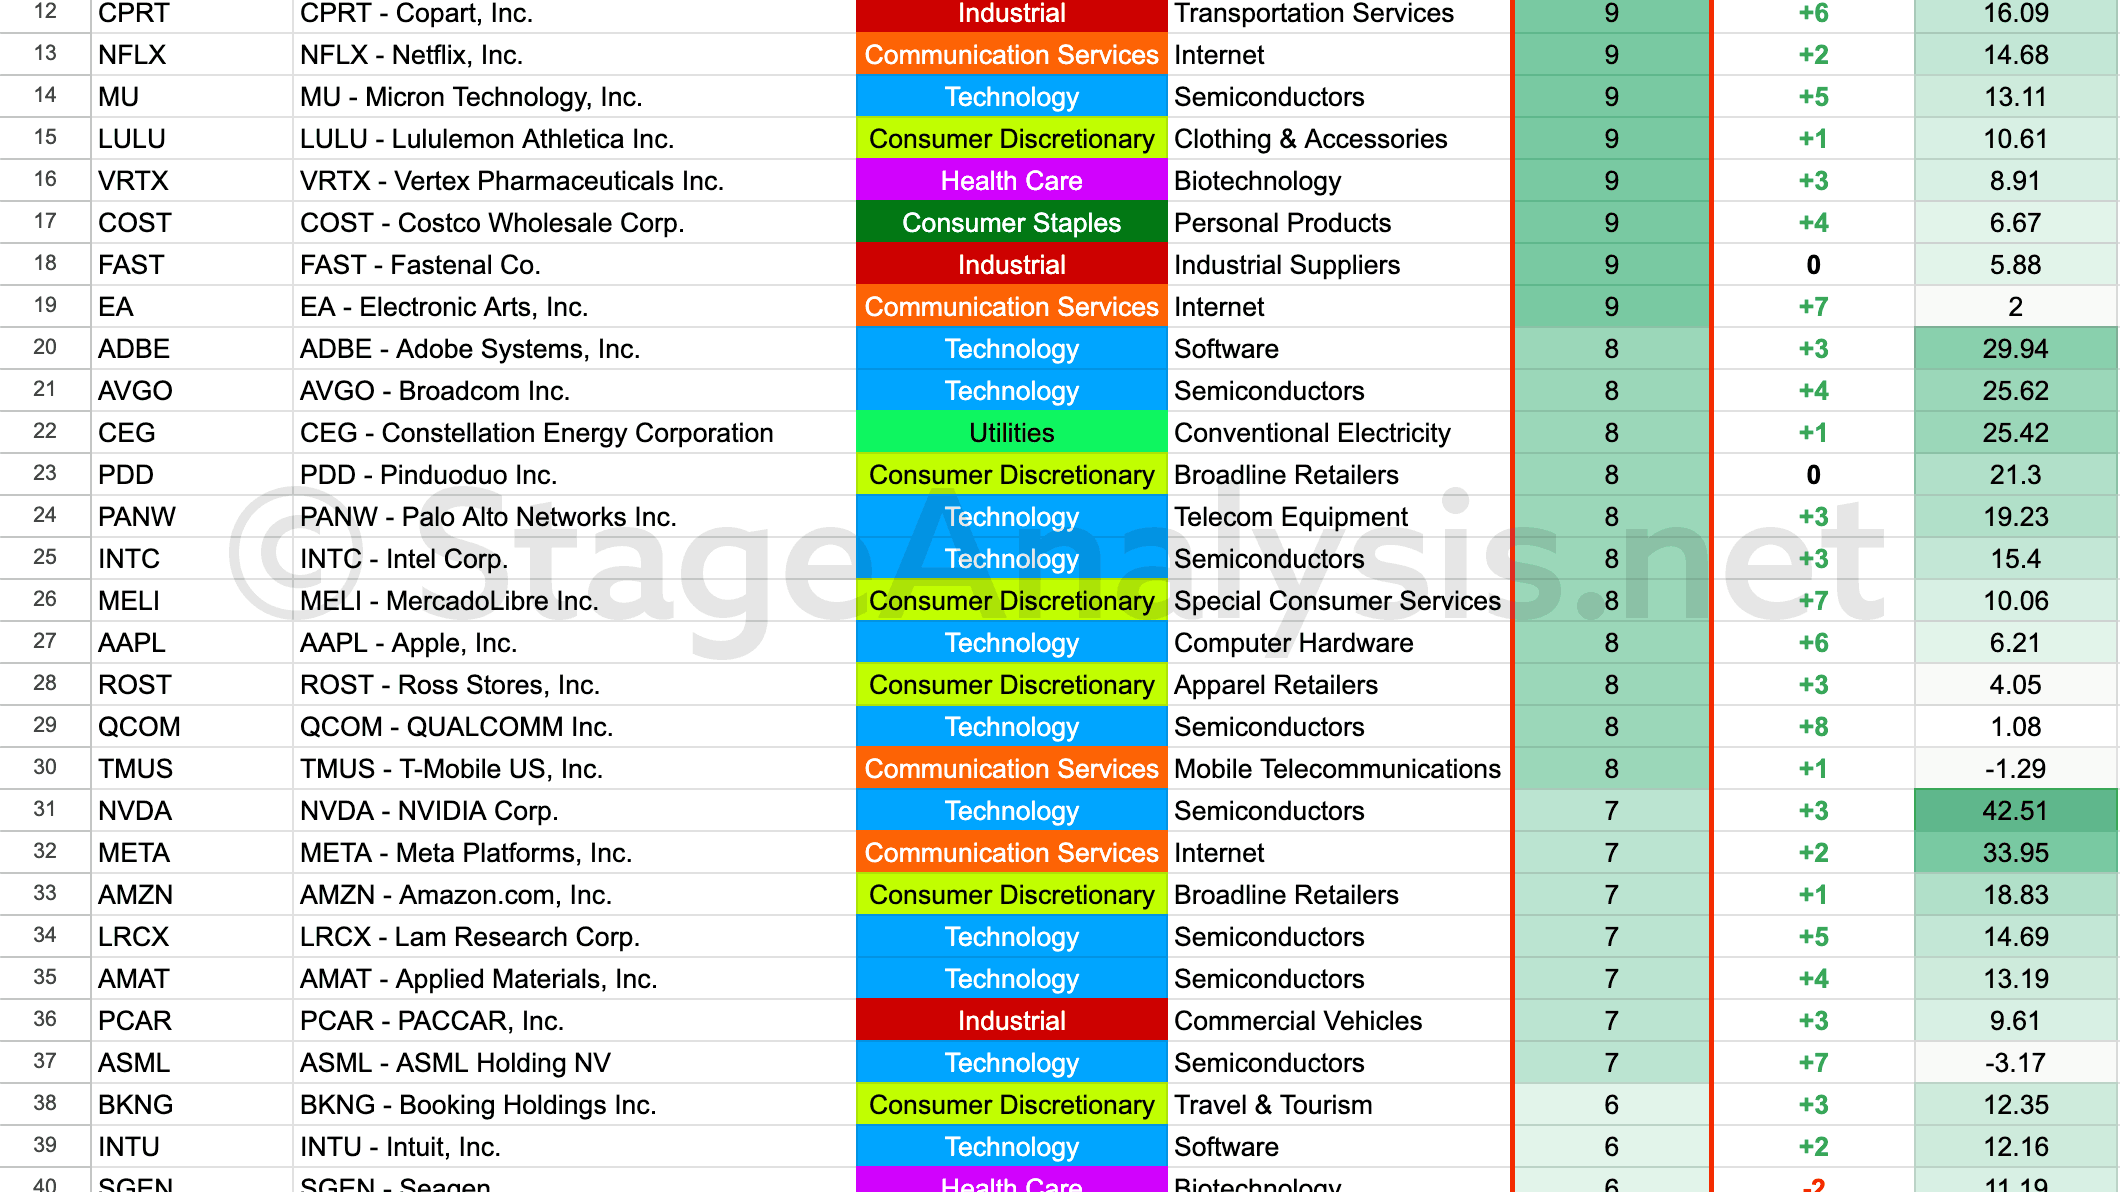
Stage Analysis Technical Attributes Scores – Nasdaq 100
12 November, 2023
Stage Analysis Members Video – 12 November 2023 (1hr 11mins)
Stage Analysis members weekend video covering the Major US Indexes, Futures Charts, Industry Groups Relative Strength (RS) Rankings, IBD Industry Group Bell Curve – Bullish Percent, Significant Weekly Bars, Crypto Coins update and the US watchlist stocks in detail on multiple timeframes.
Read More
12 November, 2023
US Stocks Watchlist – 12 November 2023
There were 25 stocks highlighted from the US stocks watchlist scans today...
Read More
12 November, 2023
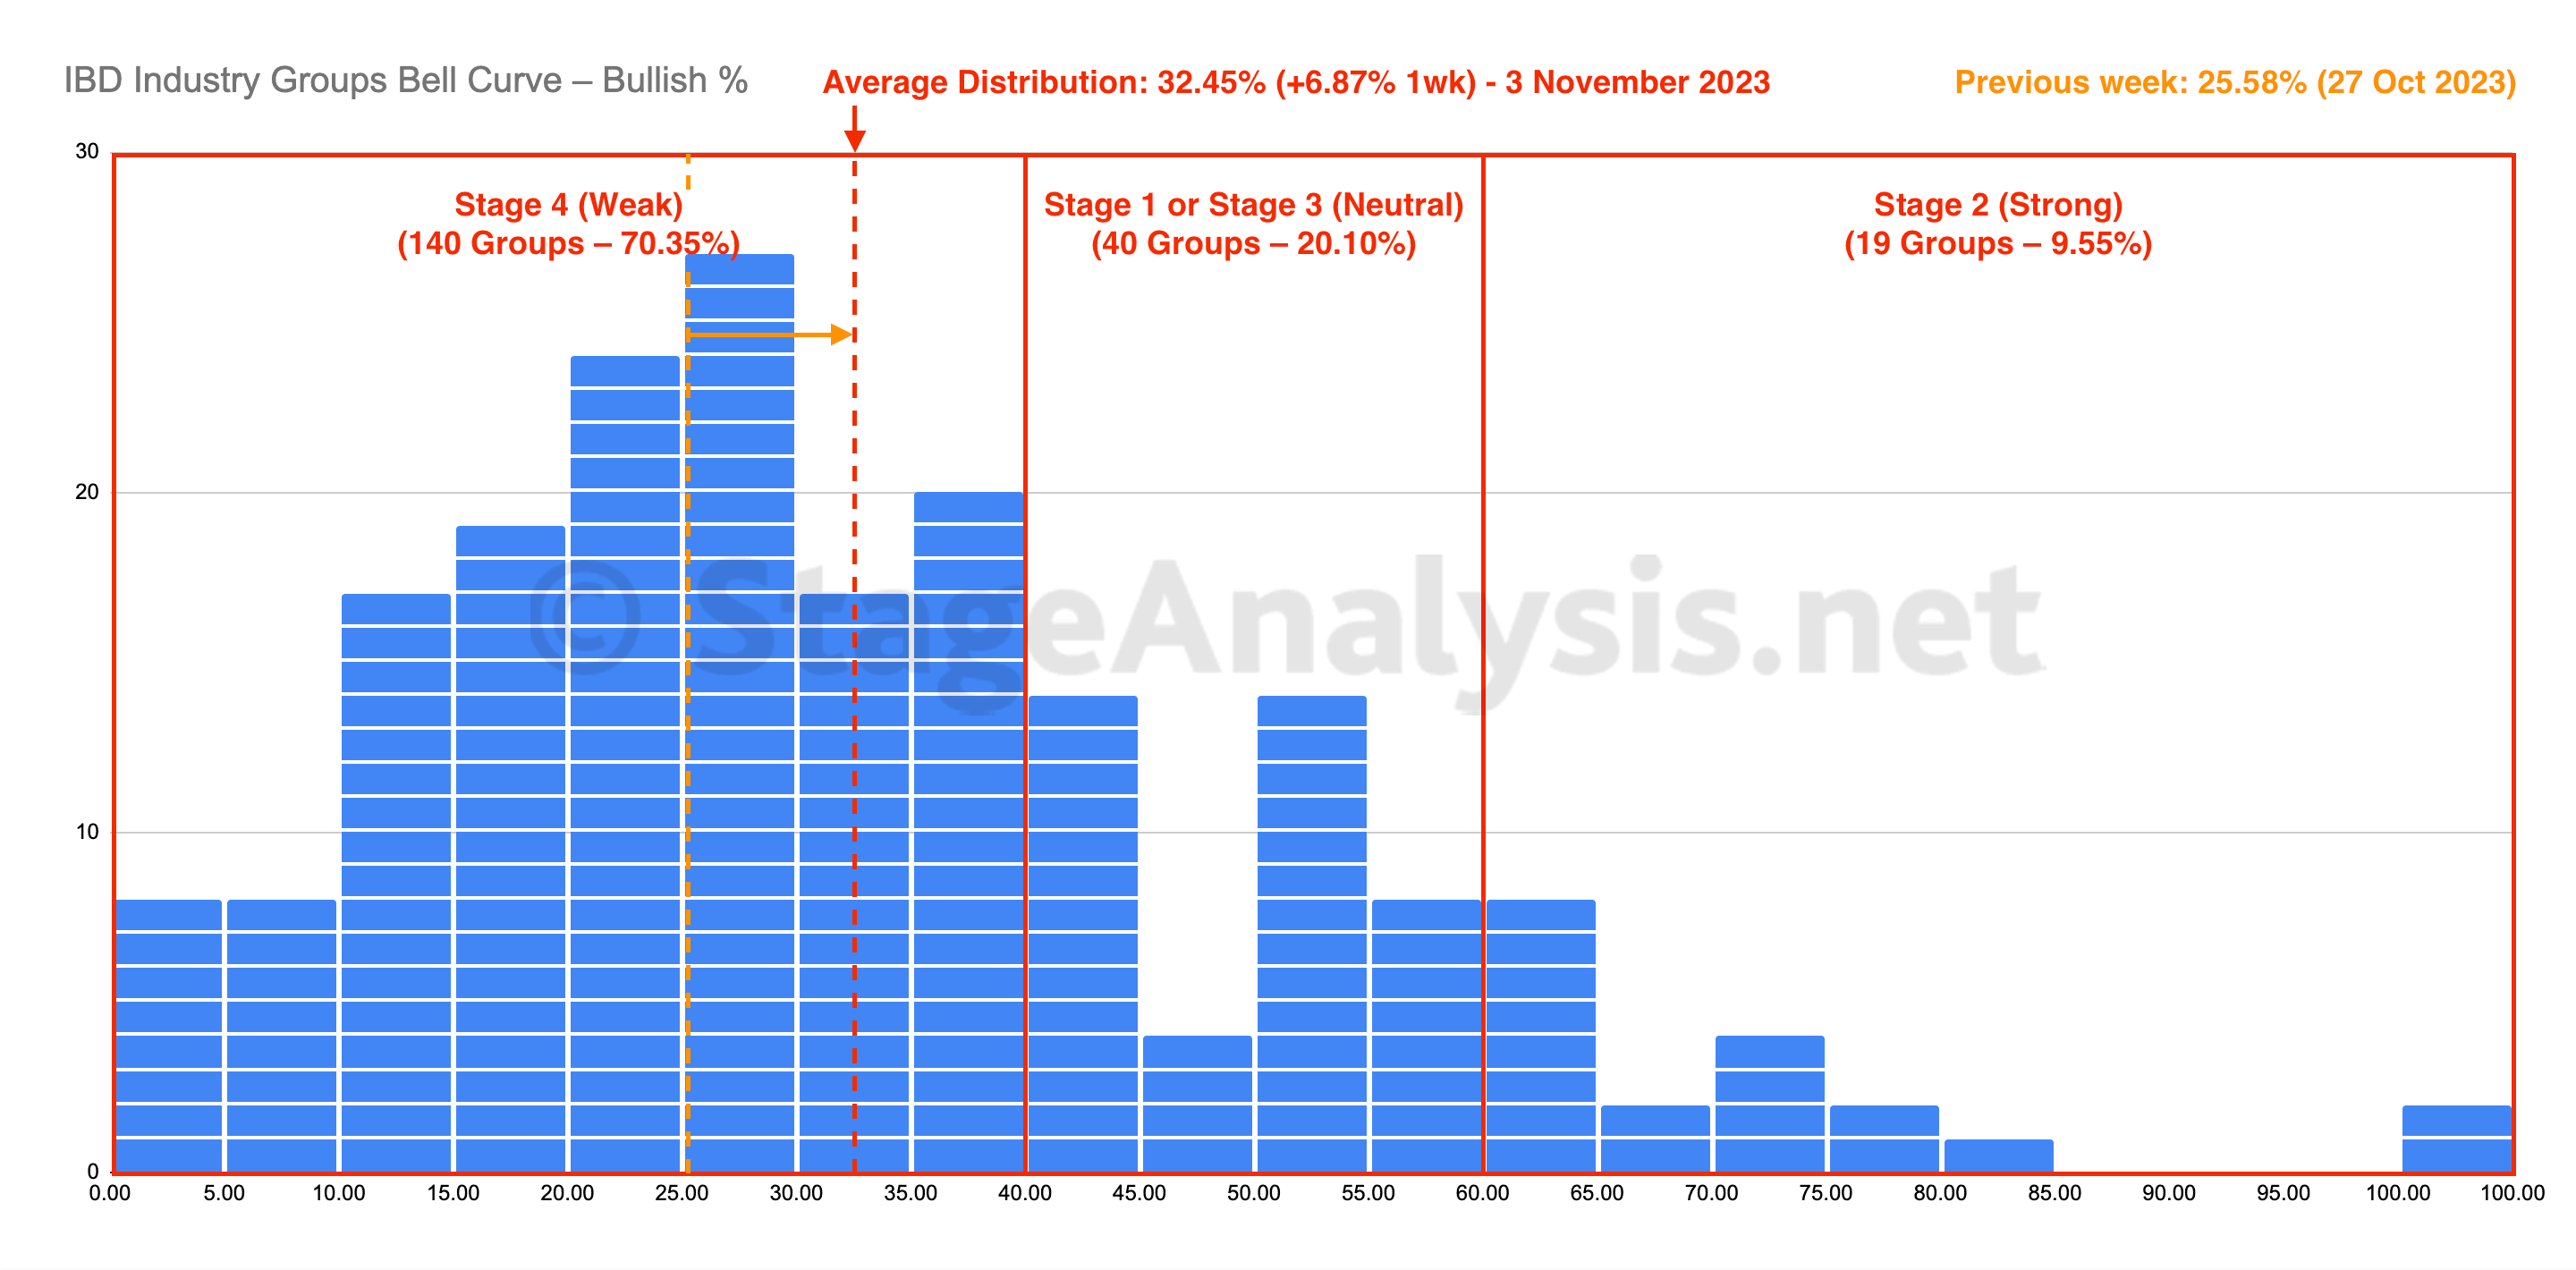
IBD Industry Groups Bell Curve – Bullish Percent
The IBD Industry Groups Bell Curve – Bullish Percent shows the few hundred industry groups plotted as a histogram chart and represents the percentage of stocks in each group that are on a point & figure (P&F) buy signal...
Read More
11 November, 2023
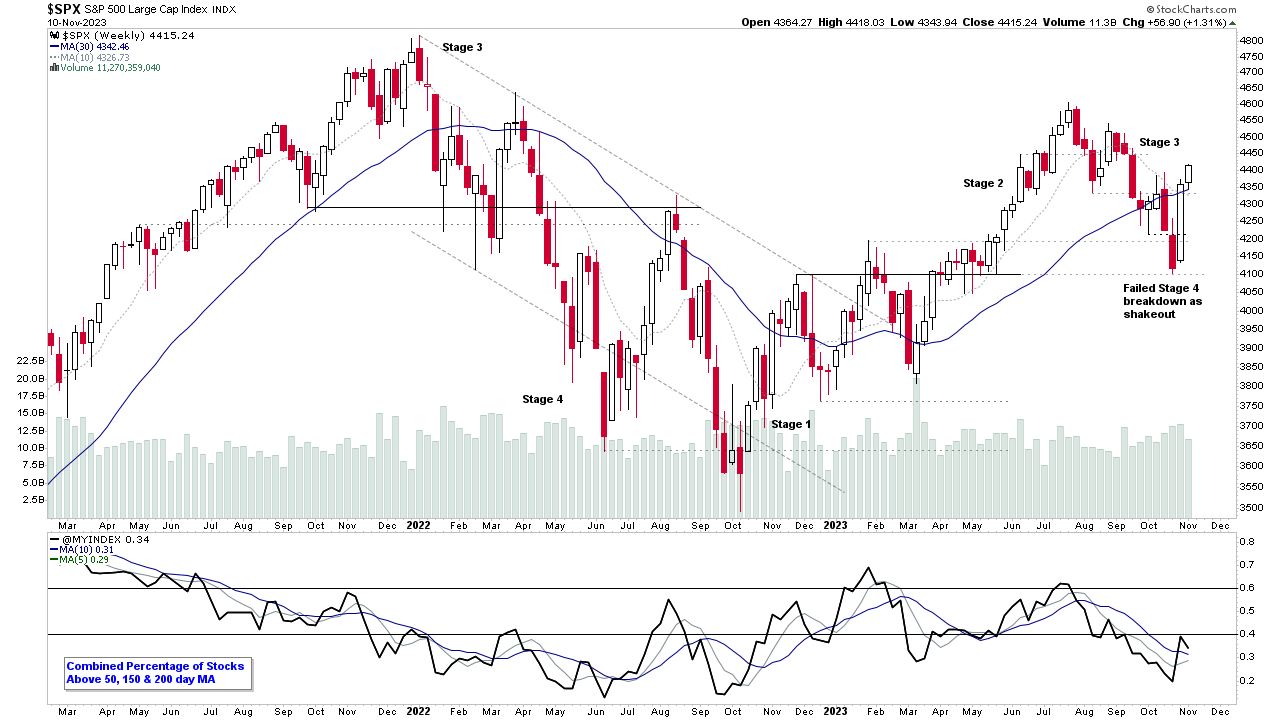
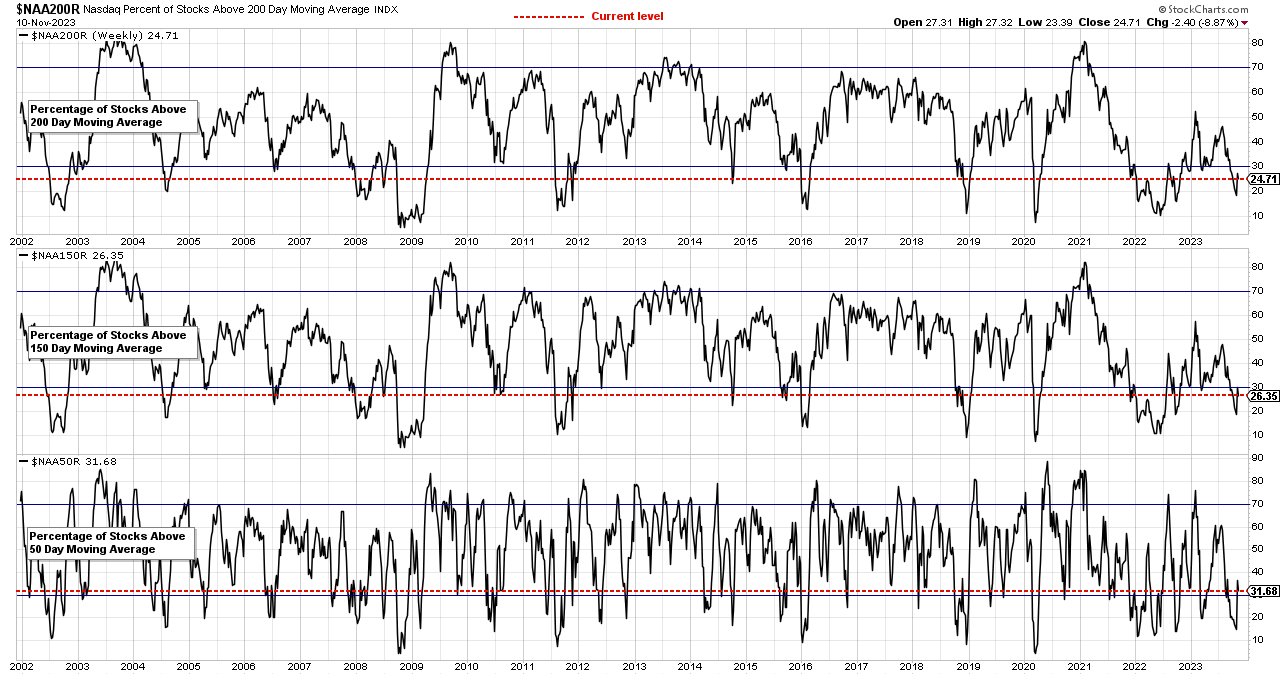
Market Breadth: Percentage of Stocks Above their 50 Day, 150 Day & 200 Day Moving Averages Combined
Custom Percentage of Stocks Above Their 50 Day, 150 Day & 200 Day Moving Averages Combined Market Breadth Charts for the Overall US Market, NYSE and Nasdaq for Market Timing and Strategy.
Read More
10 November, 2023
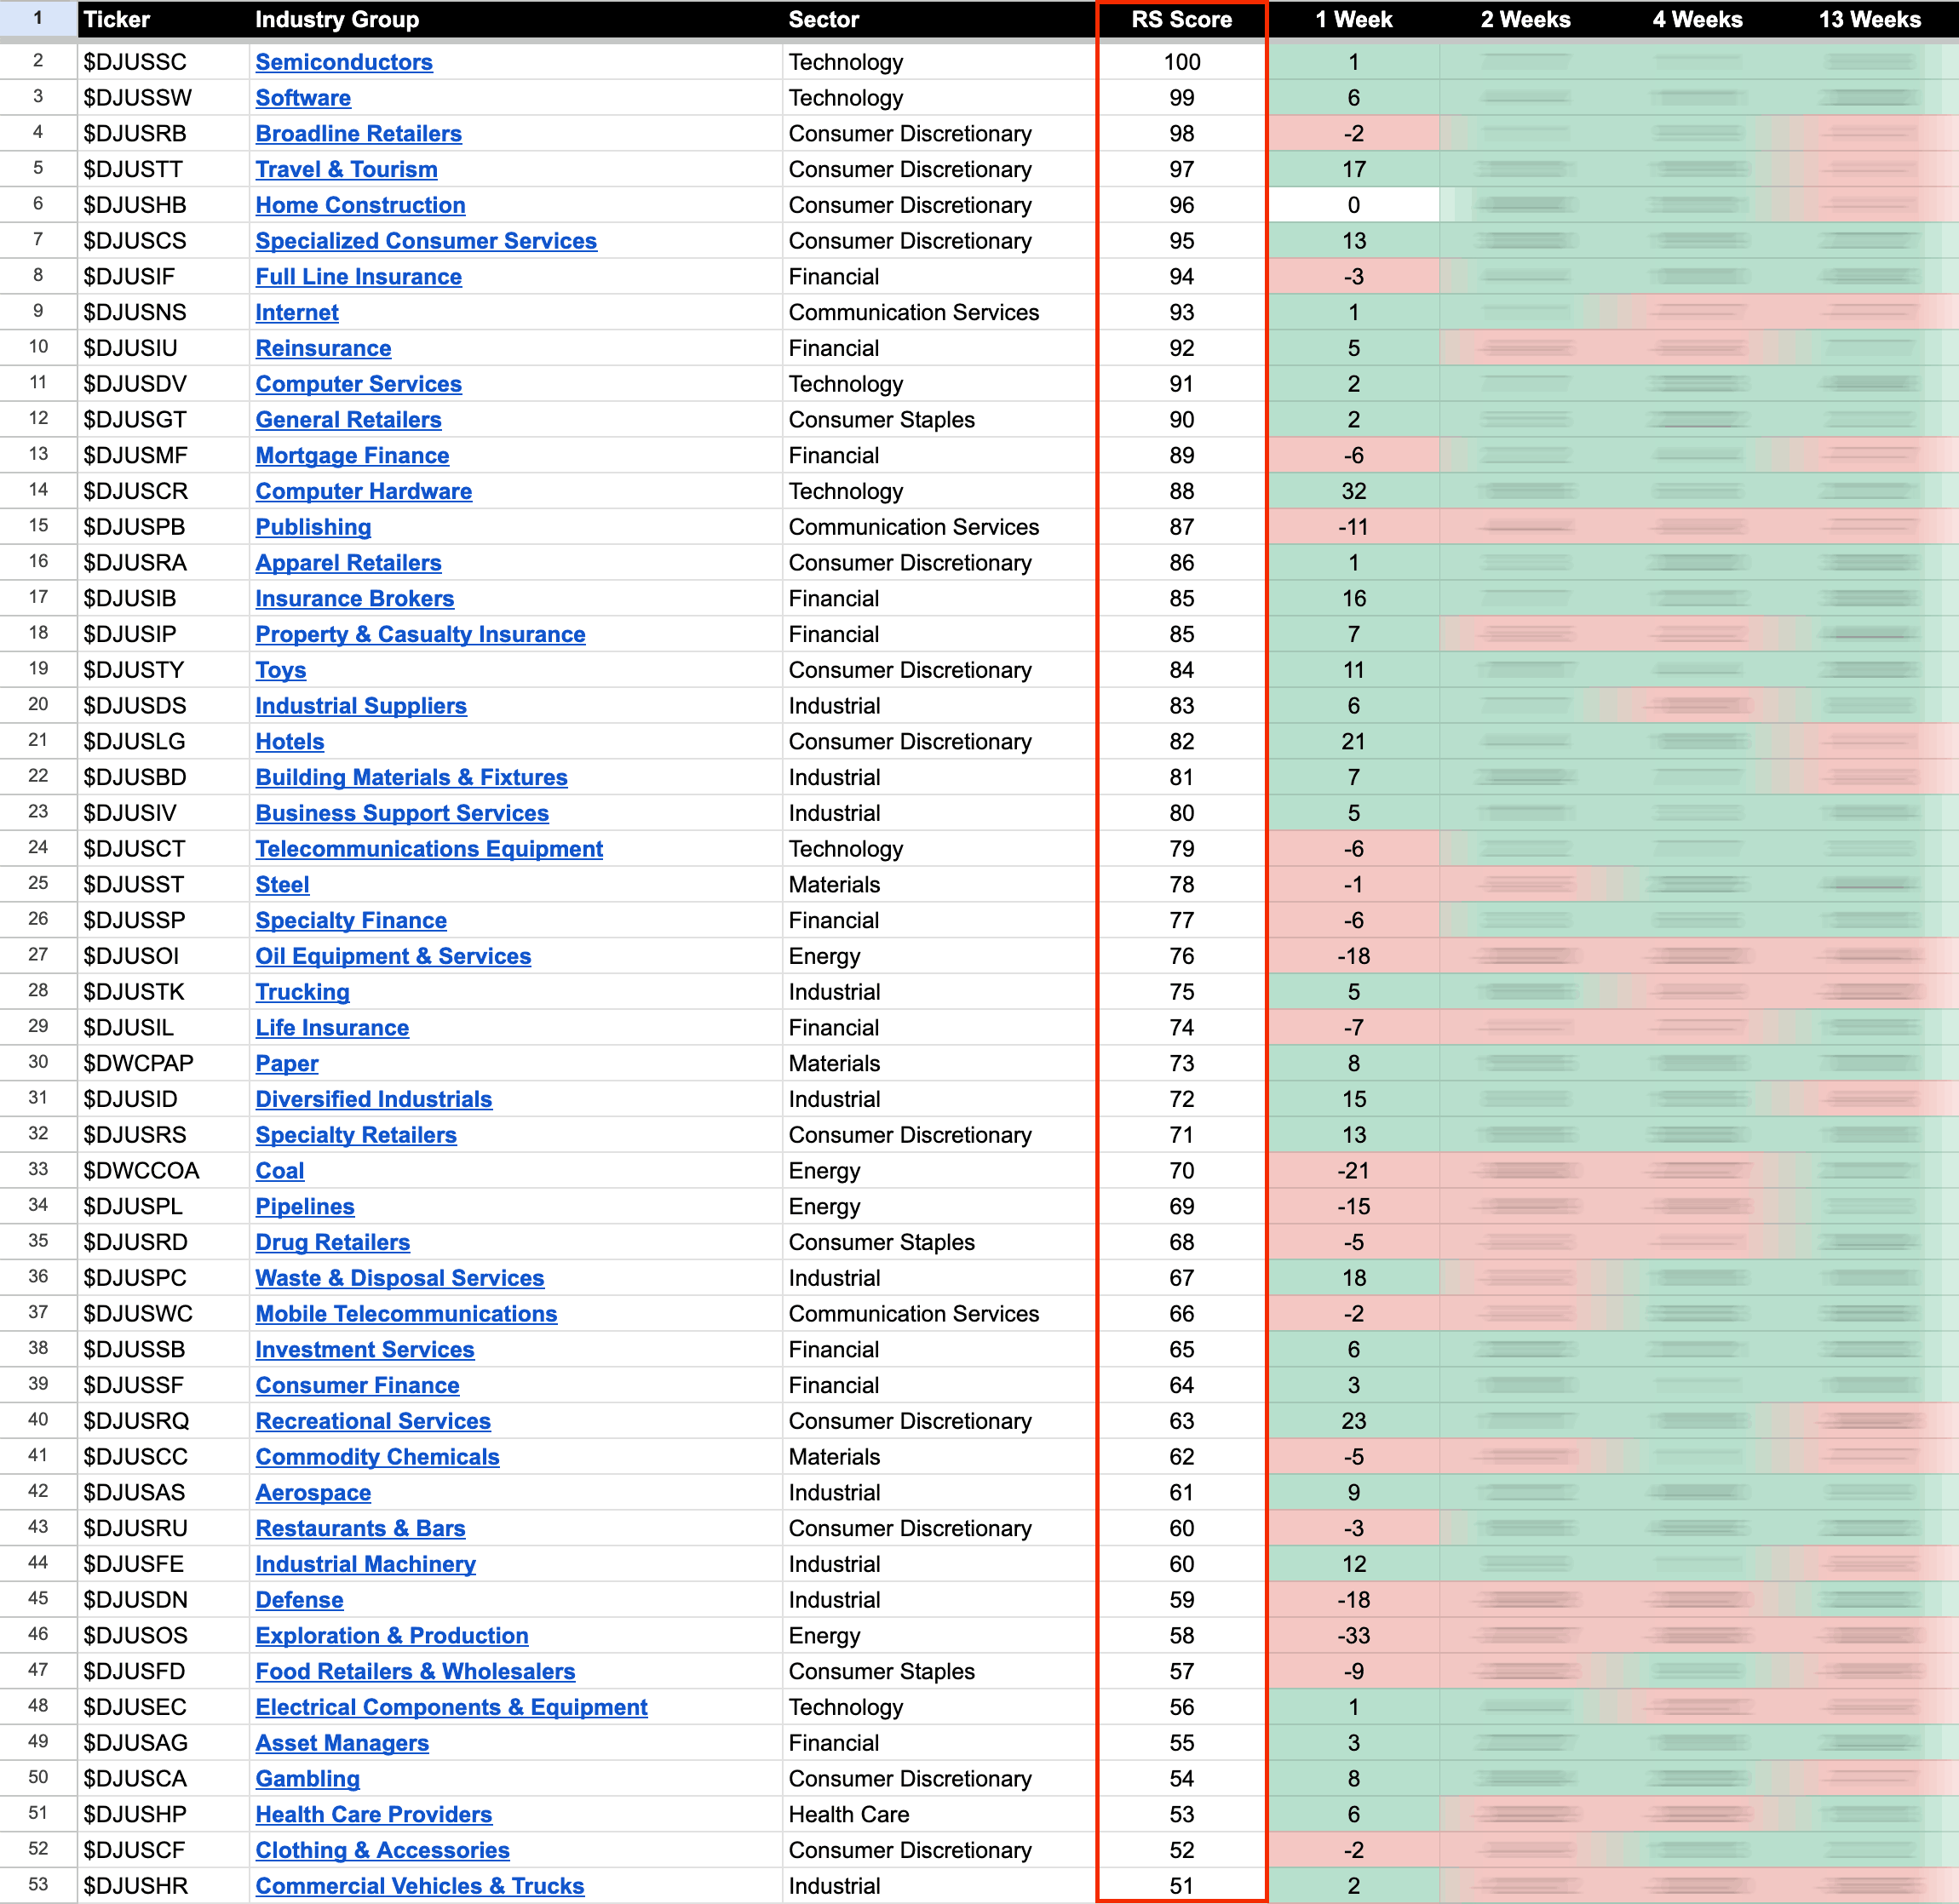
US Stocks Industry Groups Relative Strength Rankings
The purpose of the Relative Strength (RS) tables is to track the short, medium and long term RS changes of the individual groups to find the new leadership earlier than the crowd...
Read More
10 November, 2023
US Stocks Watchlist – 9 November 2023
There were 19 stocks highlighted from the US stocks watchlist scans today...
Read More
08 November, 2023
Stage Analysis Members Video – 8 November 2023 (56mins)
The Stage Analysis midweek video discussing of the major US stock market indexes, short-term market breadth measures, Bitcoin and Ethereum updated analysis, and the recent watchlist stocks on multiple timeframes.
Read More
07 November, 2023
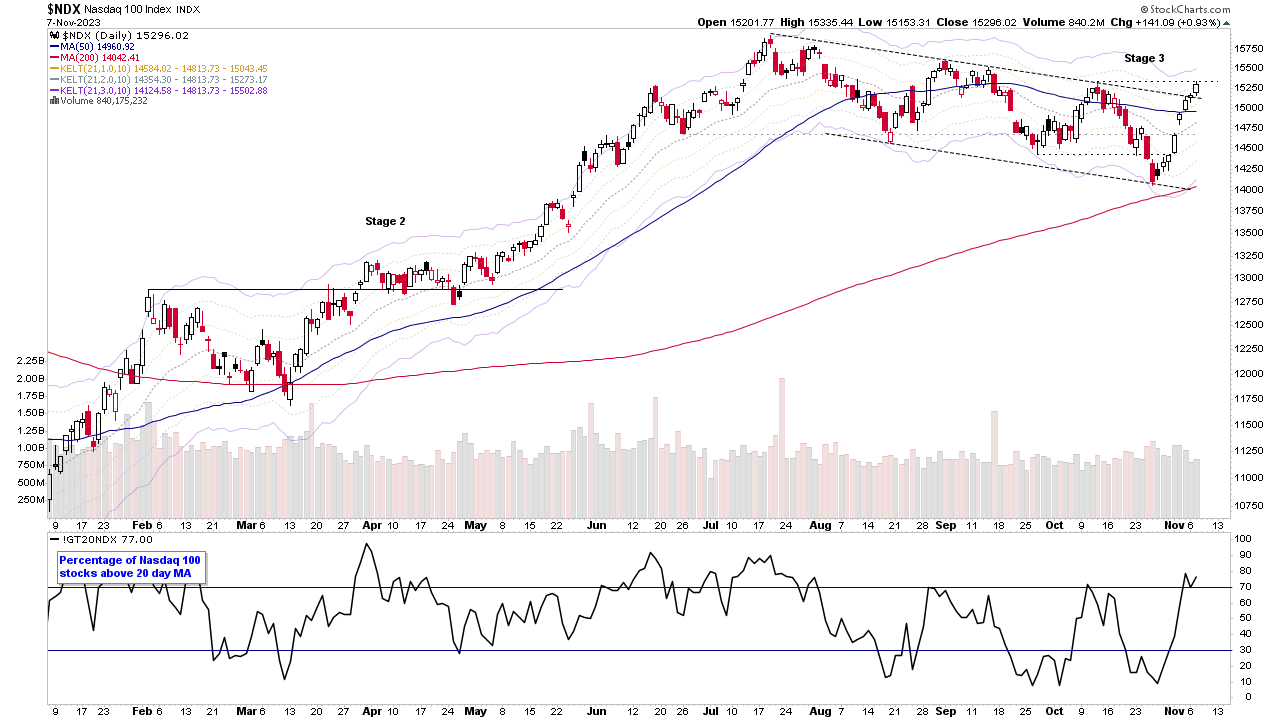
US Stocks Watchlist – 7 November 2023
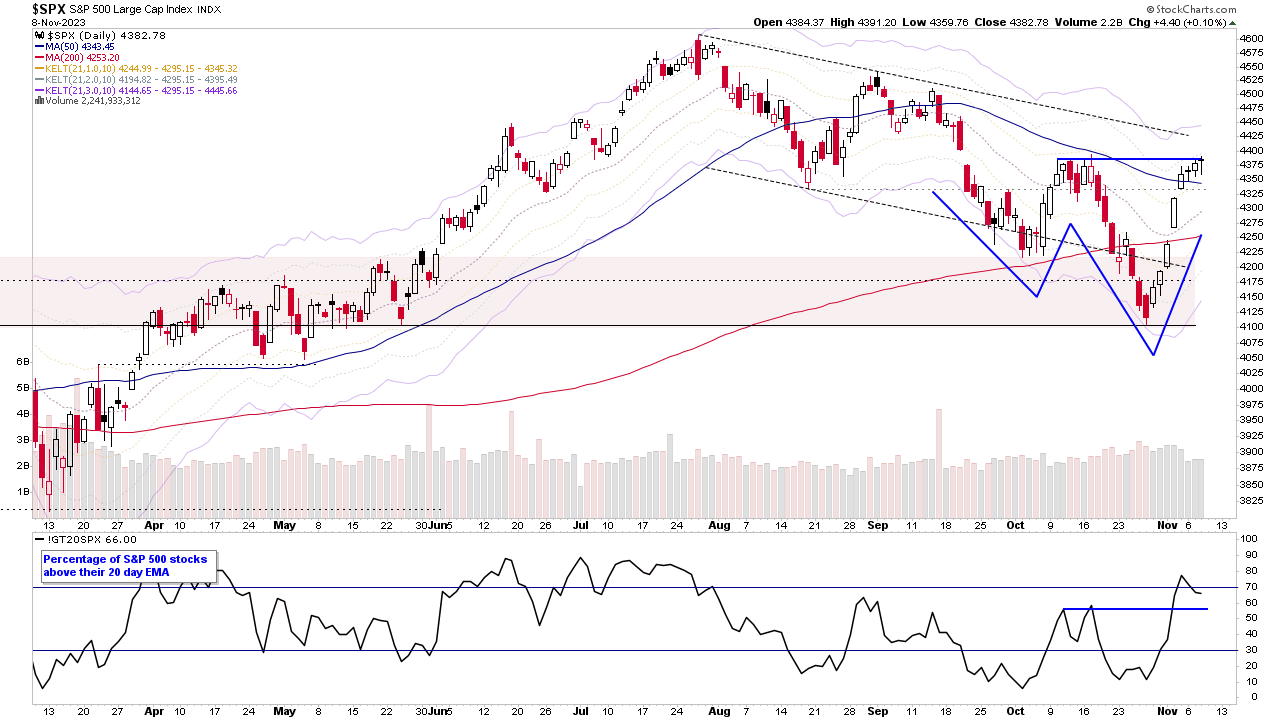
Consumer Discretionary and Technology stocks led today, boosting the Nasdaq 100, which has more than half of its stocks in those two sectors, and it's now pushing up to test the October pivot high, with 77% of its stocks currently above their 20 day EMA, and 54% above their 50 day MA, and 60% above their 200 day MA. So, although the Nasdaq 100 is technically in Stage 3 (i.e. within a distributional range), it is showing a positive short-term change of behaviour...
Read More
06 November, 2023
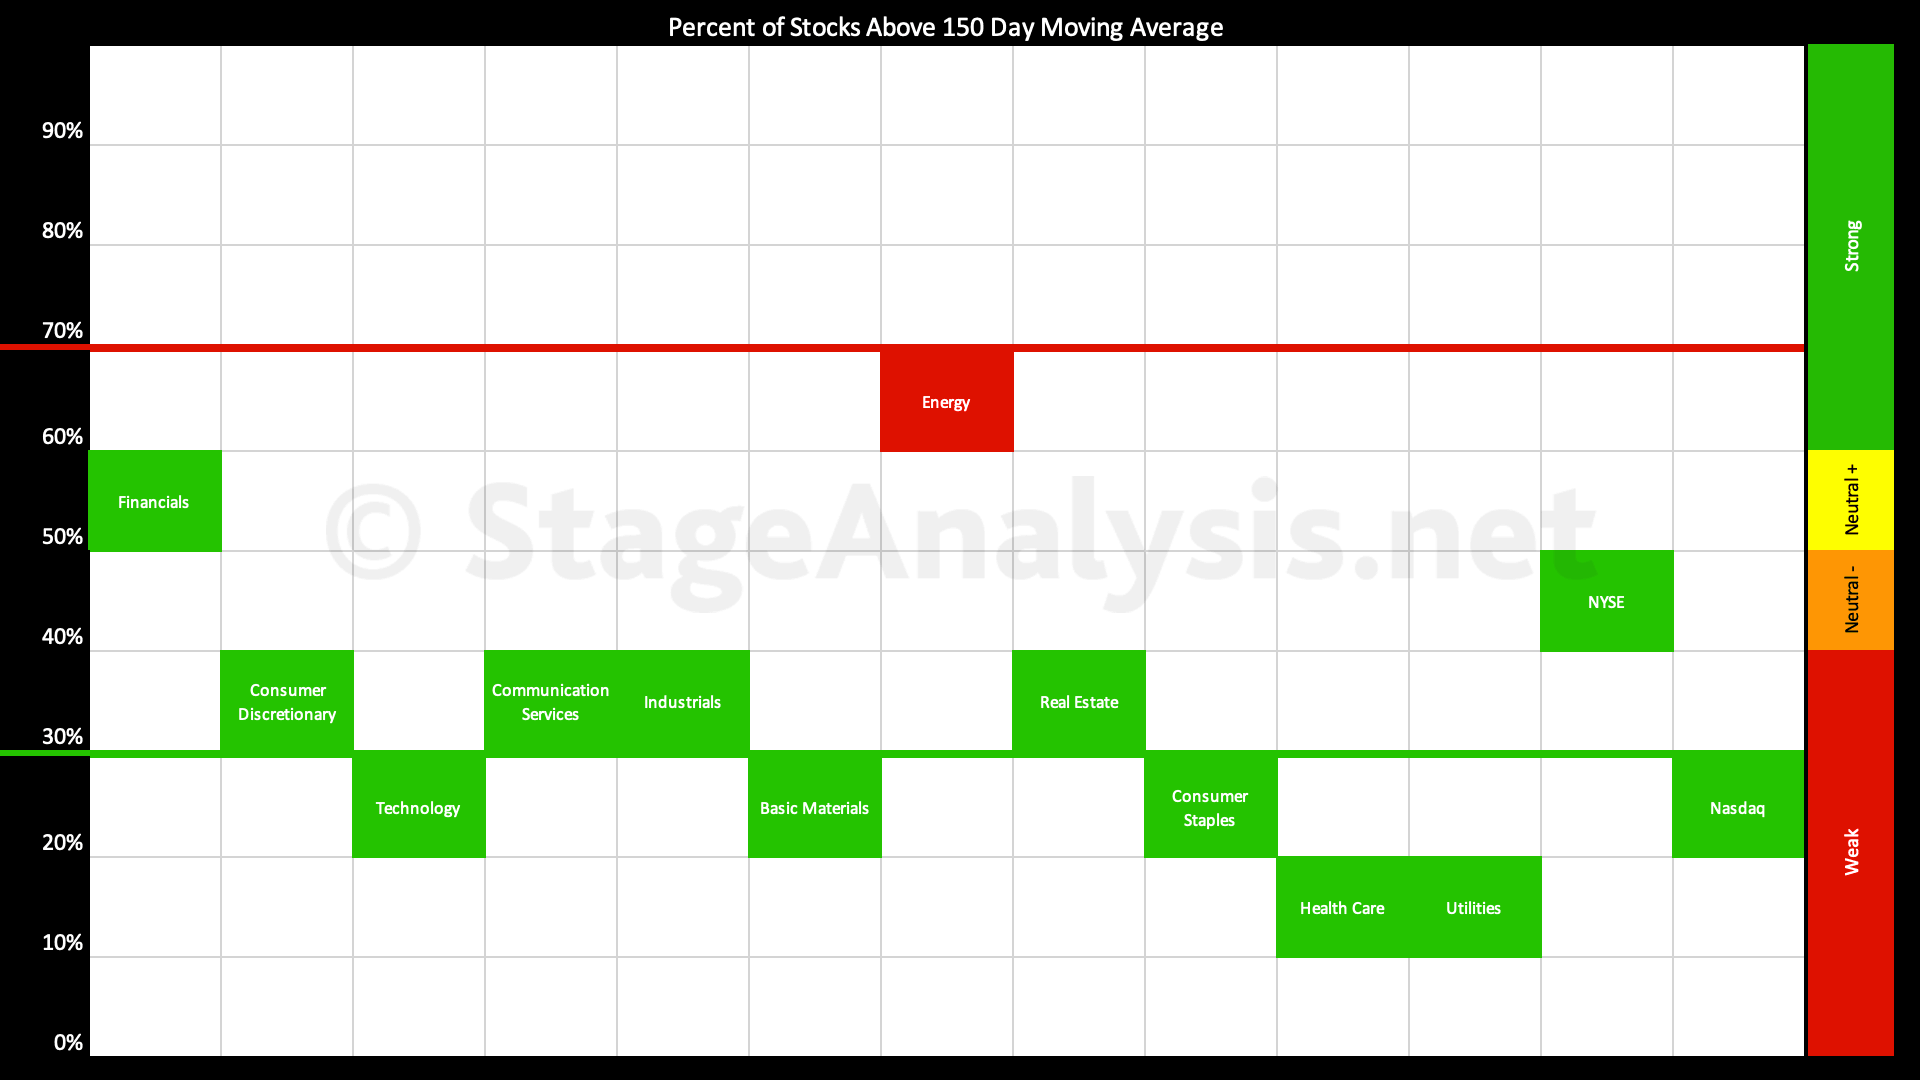
Sector Breadth: Percentage of US Stocks Above Their 150 day (30 Week) Moving Averages
The percentage of US stocks above their 150 day moving averages in the 11 major sectors increased by +10.13% since the previous post on the 23rd October 2023, with a strong rebound from the lower zone up through the key 30% level. Which is a positive change for this contrarian breadth indicator...
Read More