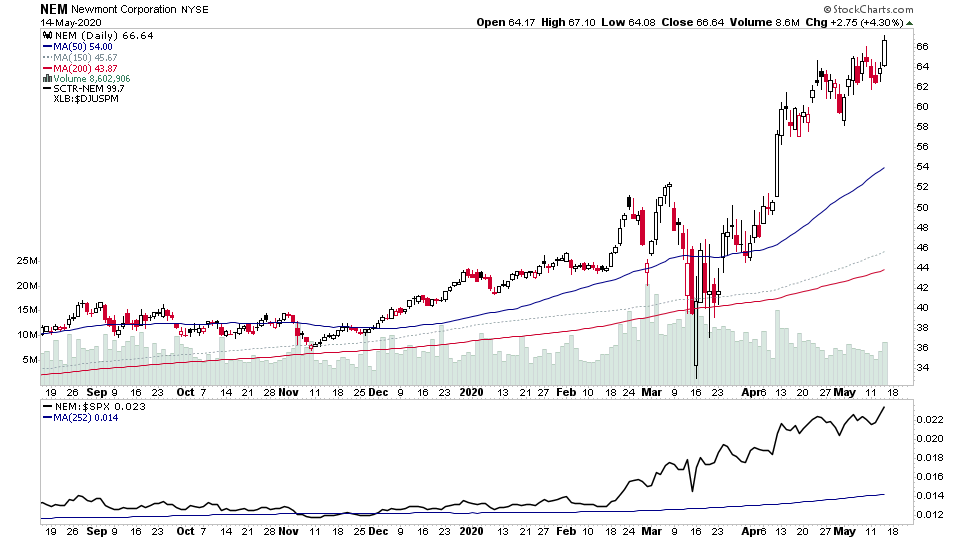
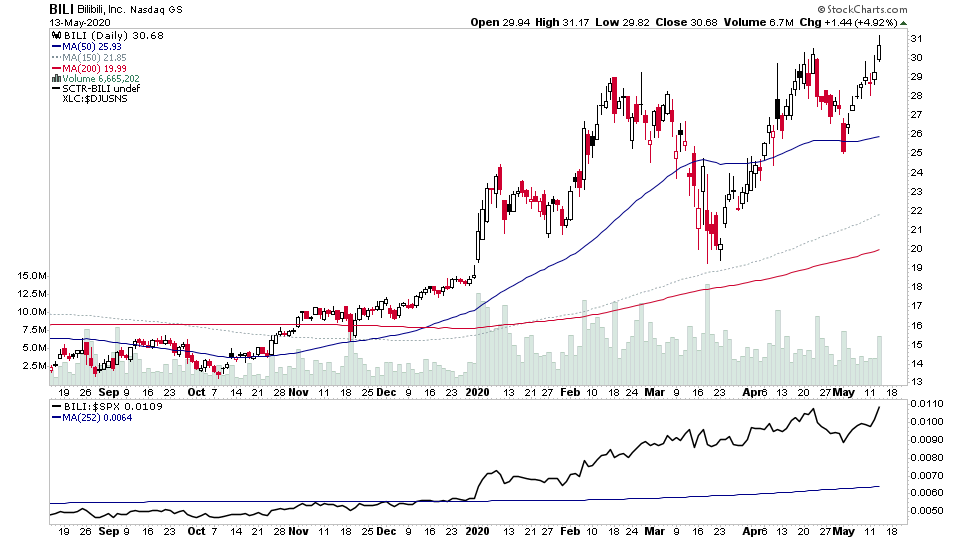
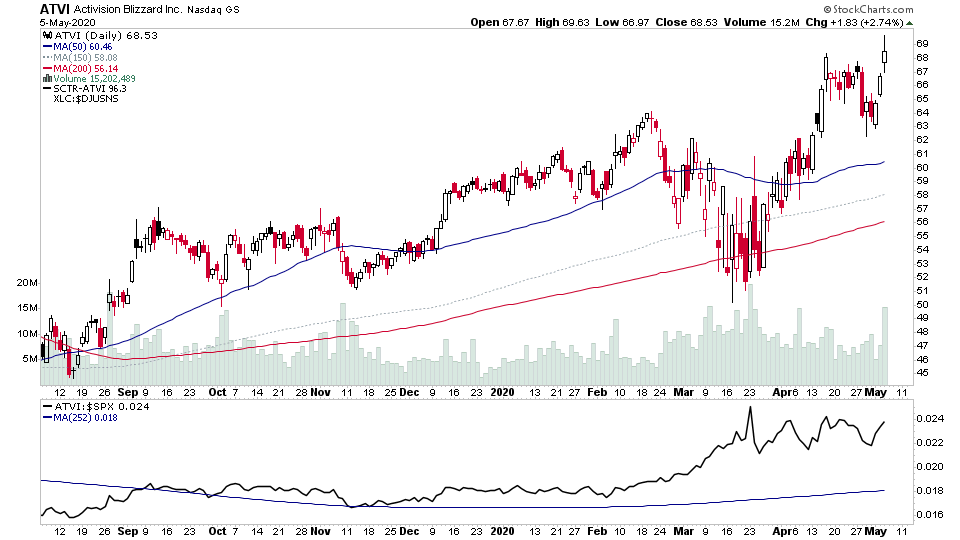
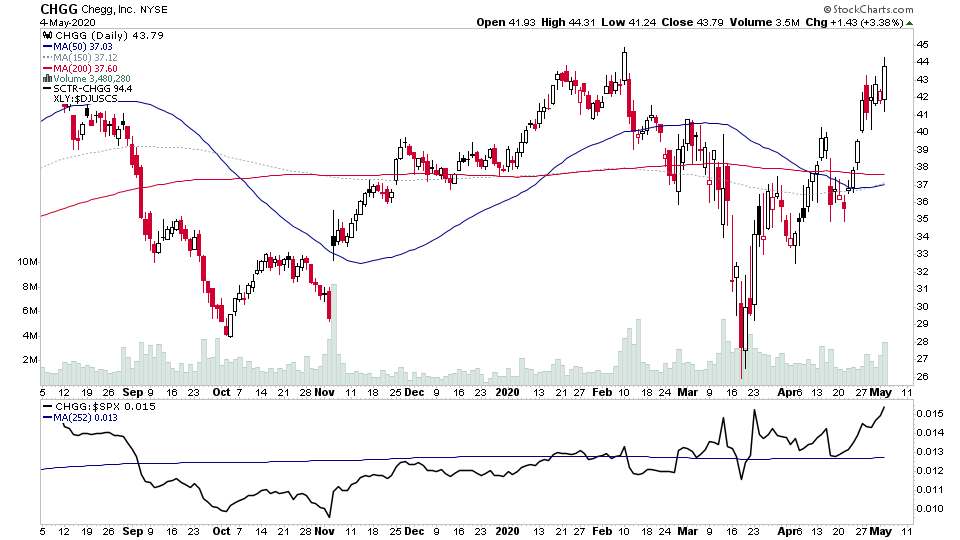
Tonights scans were littered with gold mining stocks after spot golds breakout from its tight consolidation earlier today, and few big names made it back into the list too, as they continue to consolidate near their highs.
Read More
Blog
14 May, 2020
US Breakout Stocks Watchlist - 14 May 2020
13 May, 2020
US Breakout Stocks Watchlist - 13 May 2020
The market breadth indicators showed some negative action under the surface today, with some very strong moves like the S&P 500 Bullish Percent Index dropping -30.59% in a day, and similar moves in the NYSE Bullish Percent Index which changed both of them to Bear Confirmed status. The Nasdaq Bullish Percent Index also fell today, but by around half as much at -13.34%, which changed it's status to Bull Correction.
Read More
12 May, 2020
US Breakout Stocks Watchlist - 12 May 2020
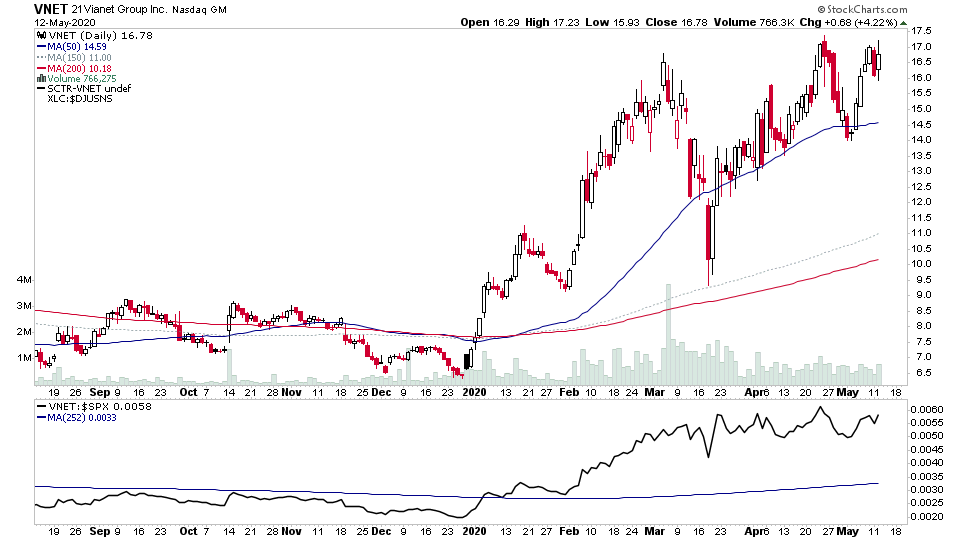
The watchlist scans took a turn today, with lots of failed moves. So caution is warranted here imo. Here's todays additions to the watchlist from Tuesdays scans - ATOM, DRRX, ISR, MRSN, RPAY, SSRM, UNFI, VNET
Read More
11 May, 2020
US Breakout Stocks Watchlist - 11 May 2020
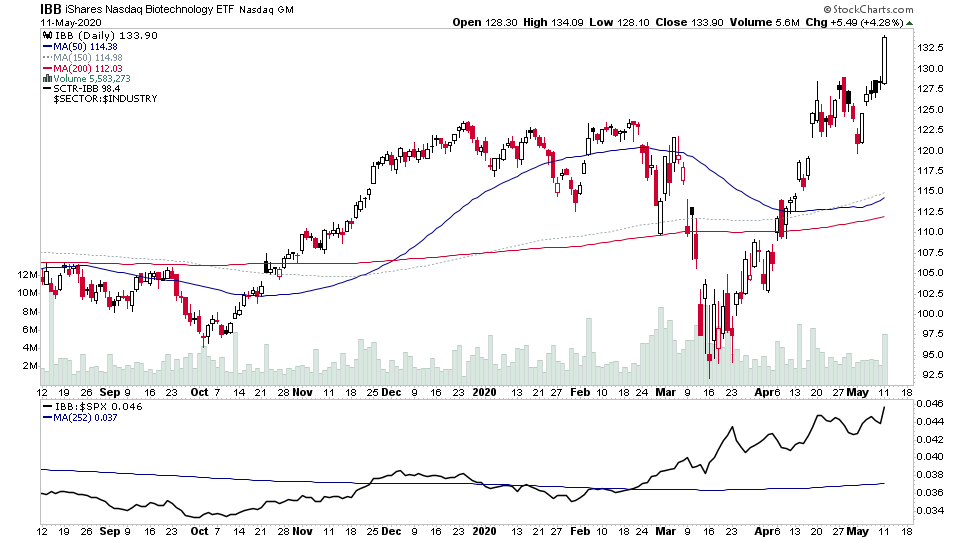
With the Biotech sector ETF breaking out to new highs today on strong volume, it unsurprising that over half of todays visual picks for watchlist stocks turned out to be in the Biotech sector.
Read More
10 May, 2020
US Major Indexes and Market Breadth Update - 10th May 2020
The indexes had a strong week, after a few weeks of indecision, with the Nasdaq indexes making new weekly highs, but the majority of other indexes didn't manage to clear the previous weeks highs although they did close strongly on Friday.
Read More
09 May, 2020
US Breakout Stocks Watchlist - 9 May 2020
More strong moves to close out the week, a few of which are at key levels going into next week.
Read More
07 May, 2020
US Breakout Stocks Watchlist - 7 May 2020
A continuing theme of earnings gaps and numerous breakouts today. Things are feeling a bit frothy, but until there's evidence to the contrary. i.e breakouts start failing...
Read More
06 May, 2020
US Breakout Stocks Watchlist - 6 May 2020
The broad market closed lower, but the market remains very split currently as many stocks had very strong moves today. A few are new additions to the watchlist below, but a lot were stocks that had already broken out and were continuing to move higher.
Read More
05 May, 2020
US Breakout Stocks Watchlist - 5 May 2020
Another strong list of constructive price action, breakouts and earnings gaps today. The contrarian in me thinks that maybe it's a little bit too strong, which is making me cautious. But as long as they keep setting up and breaking out. it's when the breakouts start failing that I'll get more concerned.
Read More
04 May, 2020
US Breakout Stocks Watchlist - 4 May 2020
A fairly large list tonight for the watchlist, with multiple stocks breaking out of consolidation patterns today.
Read More

