Blog

US Stocks Watchlist

Finding stocks with the best potential can be difficult. For many years now I've created the US Stocks Watchlist to try and find the stocks that meet the Stage Analysis method criteria and that are near to potential entry points in the coming days, weeks or months. i.e they may be in late Stage 1 developing a Wyckoff Spring or breaking out in early Stage 2 on strong relative volume, or tightening up with Volatility Contraction Pattern (VCP) characteristics in a re-accumulation base after having a strong Stage 2 advance.

Disclaimer: This is not a stock alerts service. We won’t tell you what stocks to buy or sell. But if you follow the watchlist it may give you ideas for your own trades and save you countless hours, by giving you a more refined starting point for your own stock research.

Non-members
To see all the watchlist posts and other premium content, such as regular detailed videos and exclusive Stage Analysis tools, become a member

Join Today

Nasdaq and S&P 500 Approaching Potential Resistance Zone and Further Market Breadth Improvements

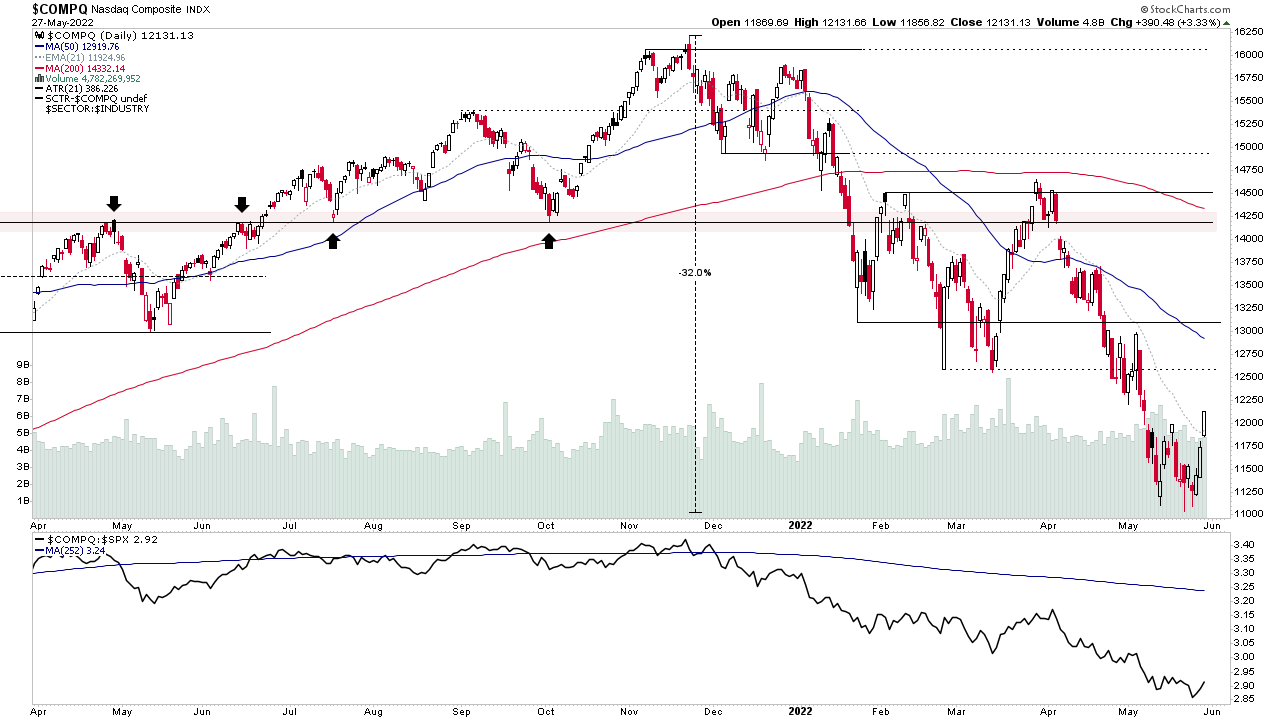
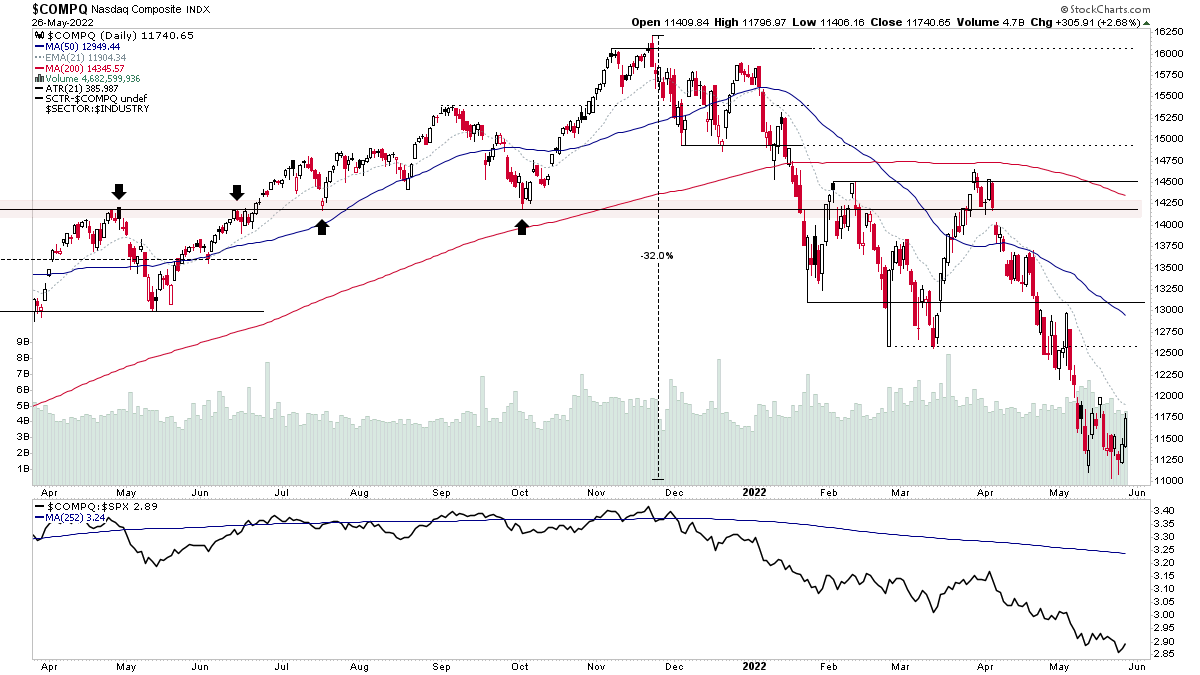
The Nasdaq Composite is approaching a significant level of interest that has acted as both support and resistance five times or so in the past year. Hence, it is a key level to overcome in order for the short term Change of Behaviour that we've seen to turn into a more significant Change of Character – which would be more bullish. As although the initial Stage 4 breakdown attempt failed and the rebound has been strong, relative strength in the Nasdaq remains weak versus the S&P 500 and it's moving into a logical area for shorts to initiate a test of the recent price action...
Read More

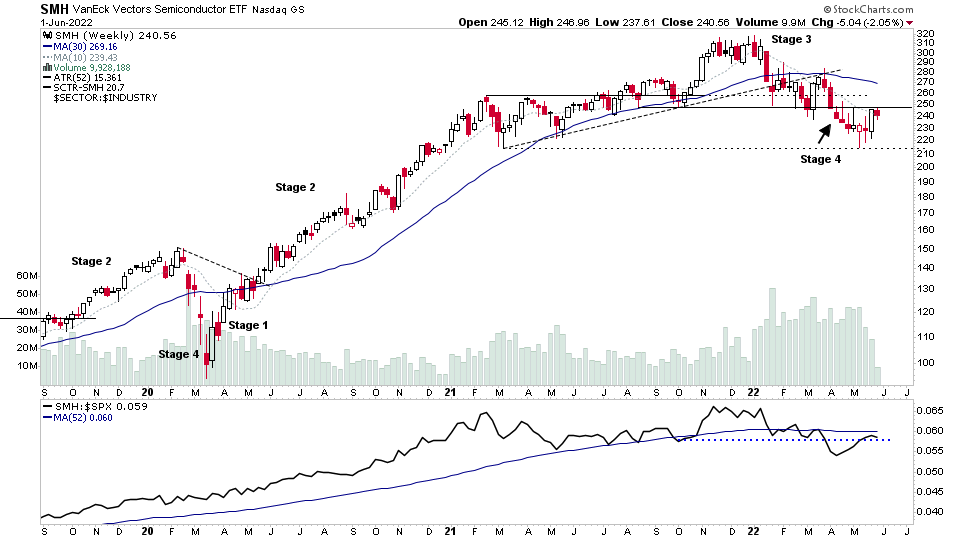
Leading Groups Continue to Push Higher While the Broad Market Consolidates

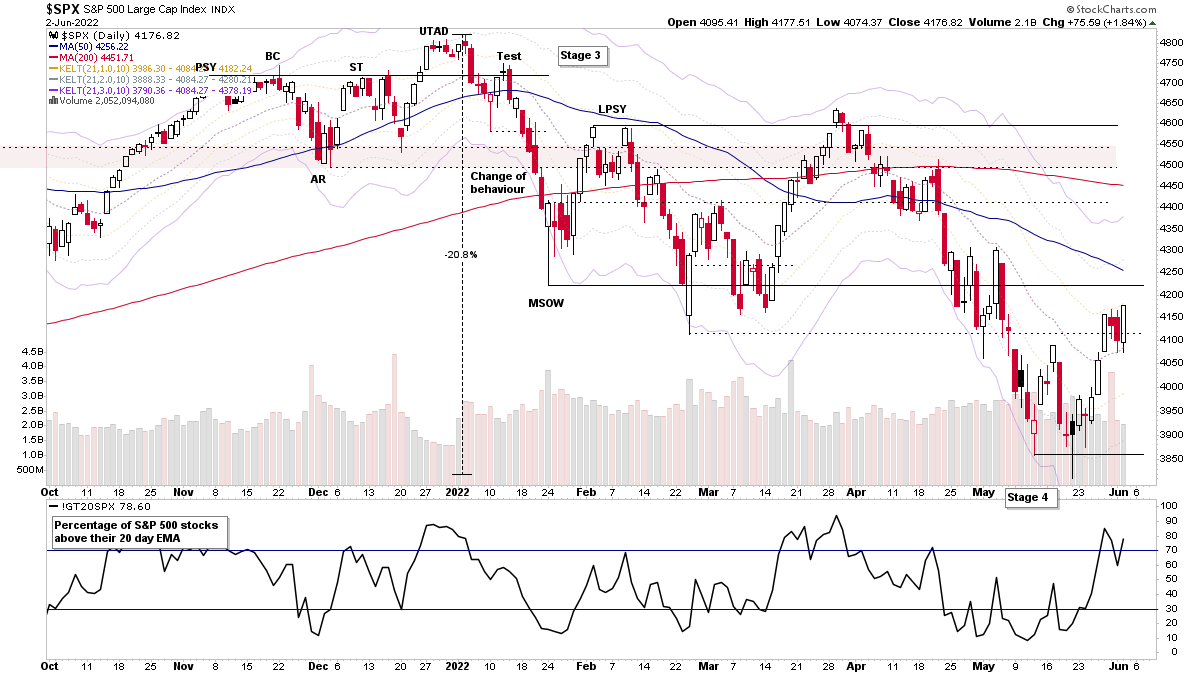
The base structures which began to develop with the local Selling Climax (SC) on the 24th January continues to mature, and last weeks potential Change of Behaviour held reasonably well on the first day of testing by the large operators today with the S&P 500 holding above the year to date VWAP level and the Nasdaq 100 holding the VPOC of the range, but remaining under its year to date VWAP level. Hence, the S&P 500 continues to show more relative strength than the Nasdaq. But the behaviour in each remains similar.
Read More

Nasdaq February Lows Tested and the US Stocks Watchlist - 14 March 2022

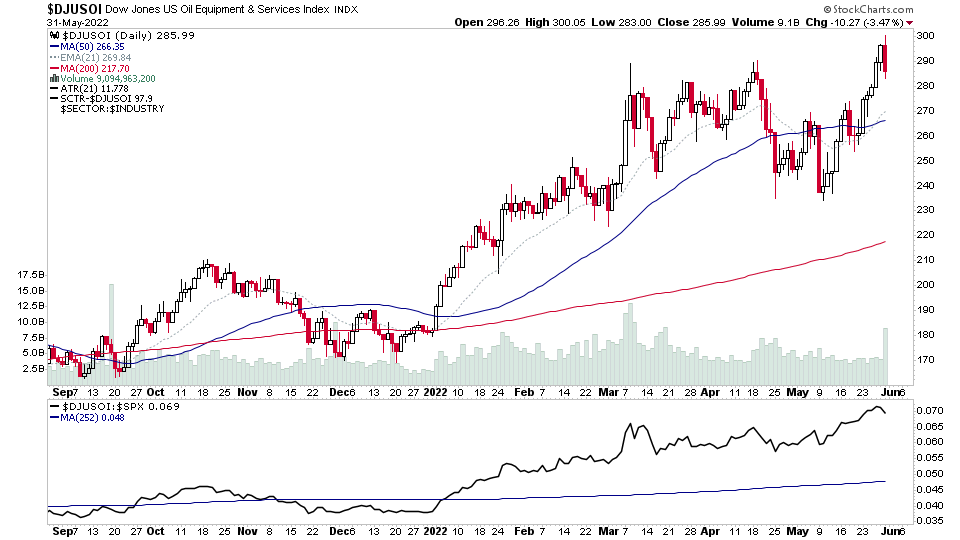
I talked about the Major Indexes Attempting to Breakdown into Stage 4 in a previous post. Today we saw some further weakness in the market, such as the Nasdaq 100 (attached) as the recent leading groups that had been running strongly in Stage 2, started to unwind, following short term climatic action in a number of areas such as Oil, Commodities and Precious Metals last week.
Read More

Stage Analysis Members Weekend Video - 13 March 2022

Weekend Stage Analysis Members Video covering the Major Indexes, Commodities, ETFs in focus, the Sectors and Industry Group Relative Strength, Market Breadth Update and finally the US Stocks Watchlist in detail where I mark up the price and volume action that I'm looking for in and the developing themes from the watchlist.
Read More