Blog

US Stocks Watchlist

Finding stocks with the best potential can be difficult. For many years now I've created the US Stocks Watchlist to try and find the stocks that meet the Stage Analysis method criteria and that are near to potential entry points in the coming days, weeks or months. i.e they may be in late Stage 1 developing a Wyckoff Spring or breaking out in early Stage 2 on strong relative volume, or tightening up with Volatility Contraction Pattern (VCP) characteristics in a re-accumulation base after having a strong Stage 2 advance.

Disclaimer: This is not a stock alerts service. We won’t tell you what stocks to buy or sell. But if you follow the watchlist it may give you ideas for your own trades and save you countless hours, by giving you a more refined starting point for your own stock research.

Non-members
To see all the watchlist posts and other premium content, such as regular detailed videos and exclusive Stage Analysis tools, become a member

Join Today

Spring Attempt (Again) and the US Stocks Watchlist – 2 May 2022

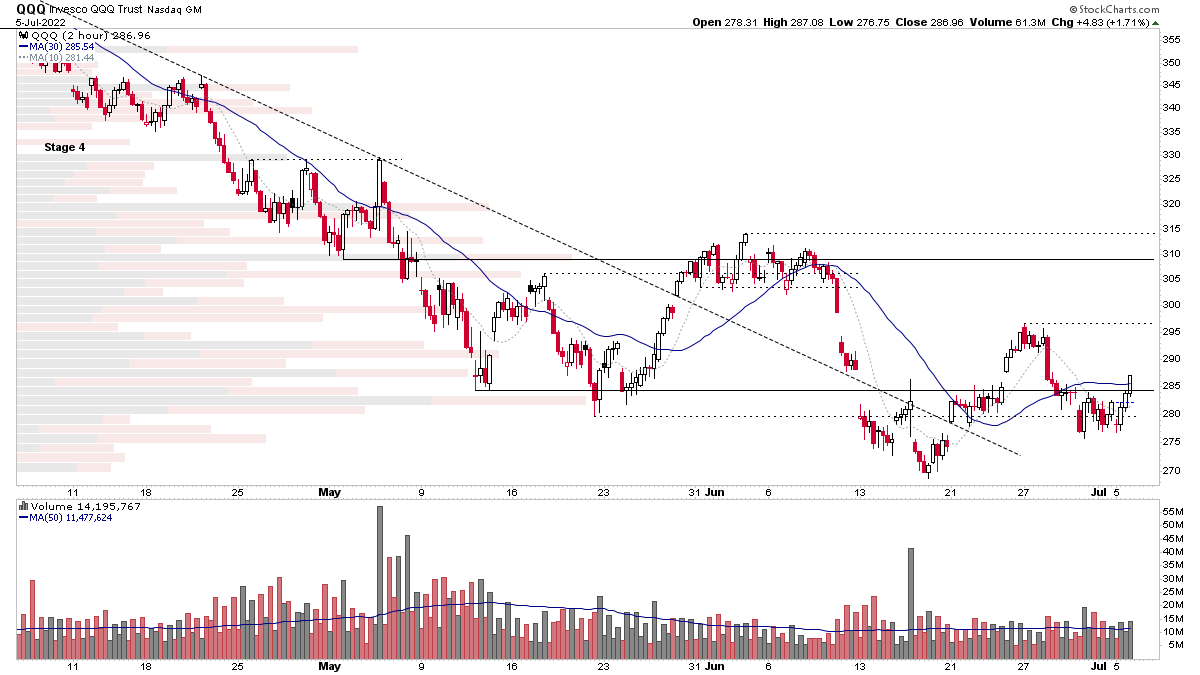
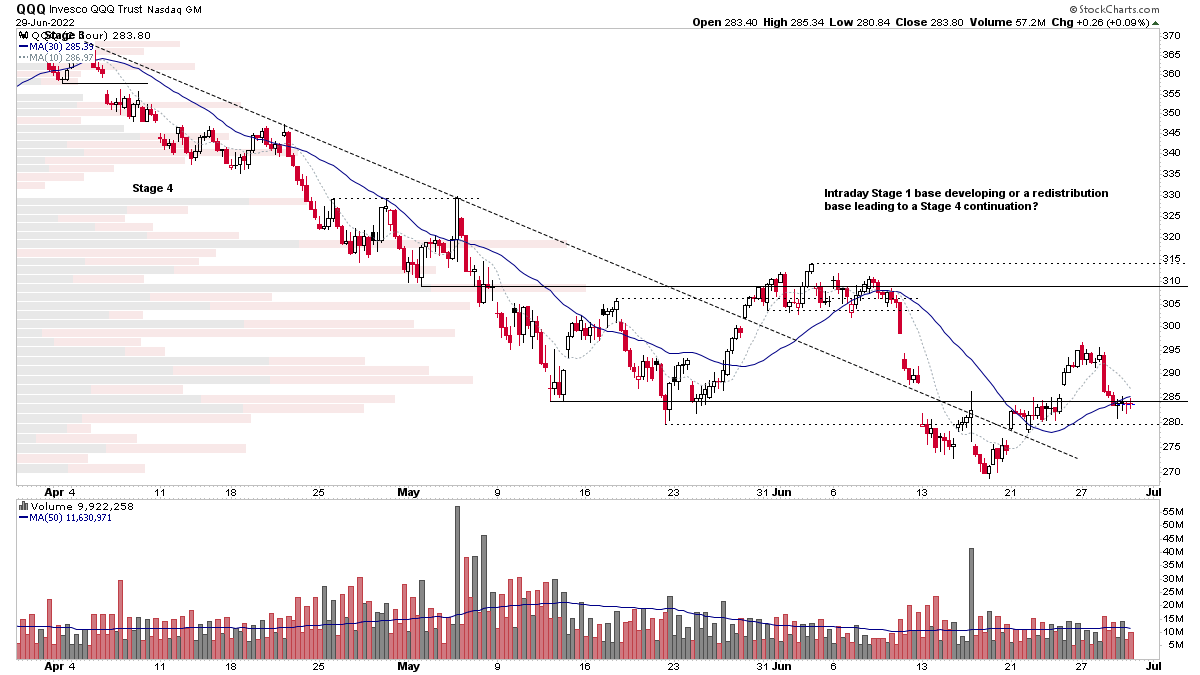
The Nasdaq 100 (I'm showing the QQQ etf above) today made yet another attempt to spring after trading down to a lower near term low. I've included multiple timeframe charts above, with the intraday 2 hour chart at the top, which is in a Stage 4 decline on that timeframe currently, and is yet to show a Change of Behaviour (CHoBH), that would potentially move it into Stage 1 on that timeframe. So to validate a spring event, I'd want to see an Automatic Rally event, that broke the Stage 4 downtrend supply line as a first sign of a CHoBH.
Read More

Stage Analysis Members Weekend Video – 1 May 2022 (1hr 22mins)

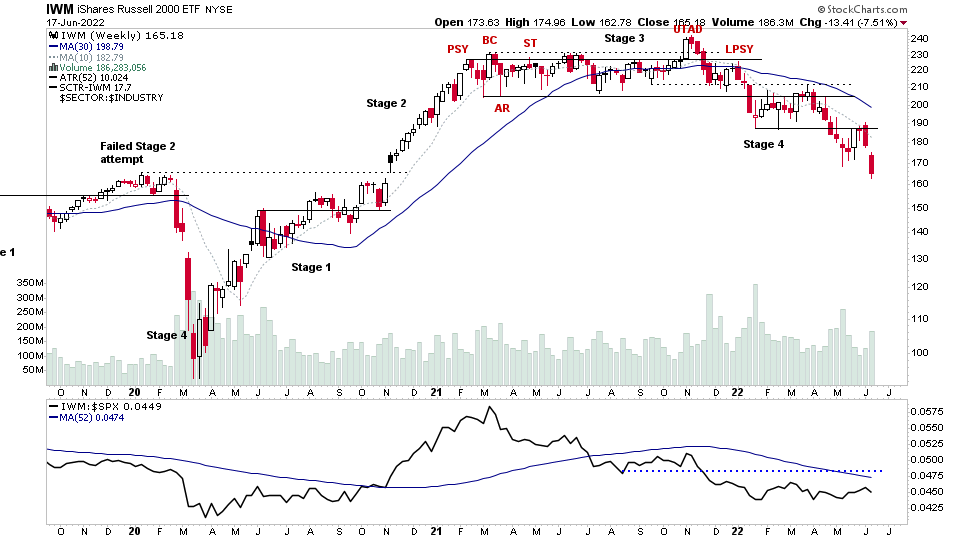
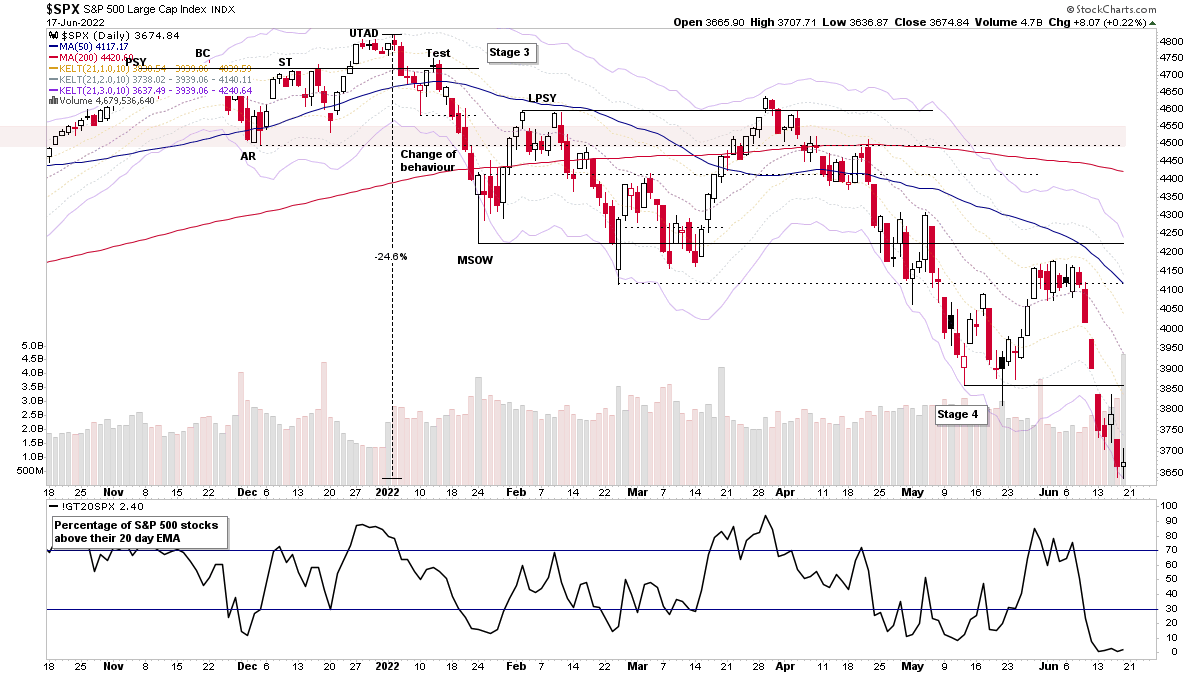
This weekends Stage Analysis Members Video features analysis of the Major US Stock Market Indexes and ETFs – S&P 500, Nasdaq Composite, Russell 2000, IBD 50, ARKK, plus the VIX and also a look at the earnings reactions of some of the mega cap stocks that reported over the last week, including GOOGL, AAPL, MSFT, AMZN and more.
Read More

Stage Analysis Members Midweek Video – 27 April 2022 (1hr 2mins)

Stage Analysis Members Midweek Video with a FREE preview reviewing the charts of the mega caps earnings reactions and the upcoming earnings in the next few days. Followed by the members only content talking first about the Q2 Weak Spot in the Four Year Presidential Election Cycle, and Major Indexes, short term Market Breadth charts. Plus a look at the Wyckoff Distribution Schematics with some potential examples from current charts showing weak structures and price and volume action. And to finish a few watchlist stocks.
Read More

Stage Analysis Members Weekend Video - 24 April 2022 (1hr 30mins)

This weekends Stage Analysis Members Video features analysis of the Major US Stock Market Indexes – S&P 500, Nasdaq Composite, Russell 2000 and the individual US Market Sectors Stages. Plus the a detailed look at the US Industry Groups Relative Strength focusing on the Change of Behaviour in the strongest RS groups...
Read More

Earnings Watchlist – 25 to 29 April 2022

Due to the weak current market conditions – which I've talked about in the various weekend Market Breadth posts – this weekends watchlist post will instead focus on some this weeks key upcoming earnings. As there are number of large and mega cap stocks reporting this week that are close to (in late Stage 3B) or already breaking down into Stage 4...
Read More

Stage Analysis Members Midweek Video - 20 April 2022 (56 mins)

Stage Analysis Members Midweek Video with a FREE preview covering the Stage 4 continuation breakdown in NFLX Netflix, and then members only content going through the Major Indexes, Short Term Market Breadth Charts, todays after hours moves from earnings in TSLA and UAL. The Uranium group attempt to rebound and the US Stocks Watchlist and Group Themes in more detail.
Read More